
RDP 2026-04: Tracking Mergers and Acquisitions Using Australian Administrative Data 5. The Characteristics of Acquiring and Target Firms
July 2026
- Download the Paper 2.2MB
The database lets us explore the characteristics of those firms involved in M&A activity, which is useful for a range of reasons. For example, understanding the nature of acquiring and acquired firms can provide valuable insights for policy. For example, better understanding the relative size of the parties can help us understand what share of the activity appears to be mergers of equals, and what share acquisition on firms. Considering the profitability and productivity of acquired firms can help us to understand issues around whether acquisitions appear to be focused on under-performing firms that can be turned around, or high-performing firms. And exploring the industry dimensions can help us understand where the activity tends to take place, and therefore where more focus could be beneficial for competition regulators.
More generally, exploring the nature of these firms can help us better understand the motivations for M&A. While the overseas literature is relatively well-developed on this issue, studies in an Australian context are rare owing to the data limitations discussed above. For example, overseas analysis has shown that firms may seek to increase innovation or patent stock (Entezarkheir and Moshiri 2019), relieve financial frictions in target firms, especially when the target firm is relatively small (Erel, Jang and Weisbach 2015), or be driven by cyclical technological or industry shocks (Martynova and Renneboog 2008). Managerial hubris or misstep may also be a factor: Martynova and Renneboog (2008) argues that takeovers towards the end of each cyclical wave of mergers are usually driven by non-rational, frequently self-interested managerial decision-making. The motivation for mergers can also be highly industry-specific and strategic within a regulatory environment: for example, the desire to obtain ‘too-big-to-fail’ status may motivate US banking mergers (DeYoung, Evanoff and Molyneux 2009). Mergers may also be motivated by low productivity financially constrained acquirers looking to avoid constraints (Bruyland et al 2019; Zhang 2022), by higher productivity firms targeting lower productivity firms to improve them (Andrade, Mitchell and Stafford 2001; Harris and Robinson 2002; Fukao, Ito and Kwon 2005; Bertrand and Zitouna 2008), or by high productivity acquirers targeting high productivity targets (Rhodes–Kropf, Robinson and Viswanathan 2005; David 2021).
Our dataset is well-placed to explore questions relating to a range of entity characteristics such as size, productivity, broader performance measures including profitability, and more niche issues such as the role of intellectual property.[5] As detailed below, we use this dataset to quantify how these characteristics affect the likelihood of a business being involved in at least one merger in a given year, providing separate estimates for acquirers and targets.
5.1 Trends by firm size over time and industry
We start by simply looking at the sizes of acquiring firms and acquired firms over time. For this analysis, we generally focus on the labour flows approach, because it should capture a more representative cross-section of firm types than the other approaches.
Figures 6 and 7 decompose acquisitions based on the size of the acquirer and target firm. We can see that most target firms are medium-sized businesses, while acquisitions are disproportionately made by very large firms (who account for less than 1 per cent of the universe of firms). After a large spike in activity in 2009 by very large acquirers (related to the health sector) merger activity stabilised for all sizes of acquirers for a run of years before slowly increasing after 2013. The increase was particularly notable for very large firms.
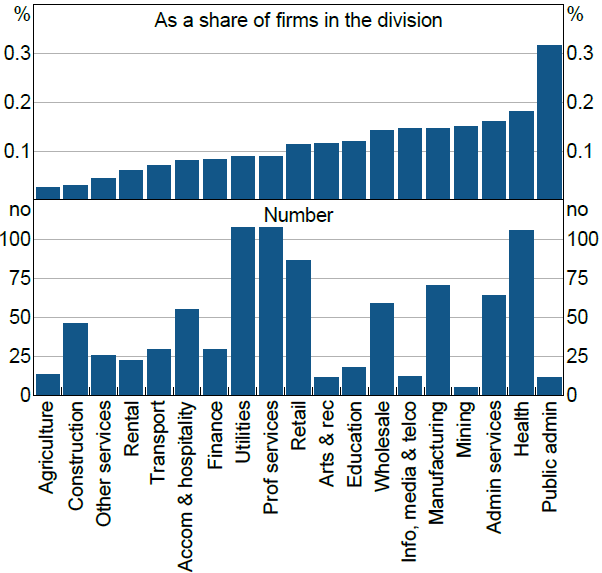
Figure 8 shows the average annual annual distribution of M&A activity by Division over the sample period 2002 to 2018. It shows that in terms of total numbers, M&A was more frequent in the utilities, professional services, retail trade and health divisions. But when scaling by the size of the industry the story looks a bit different, with administrative services, health, mining and manufacturing featuring more prominently.
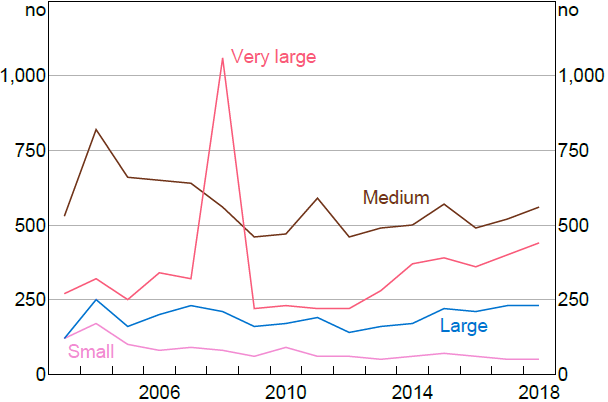
Notes: Each count is a single ABN. ‘Small’ is 1–19 employees, ‘Medium’ is 20–199 employees, ‘Large’ is 200–499 employees, ‘Very large’ is 500+ employees.
Sources: ABS; Authors' calculations.
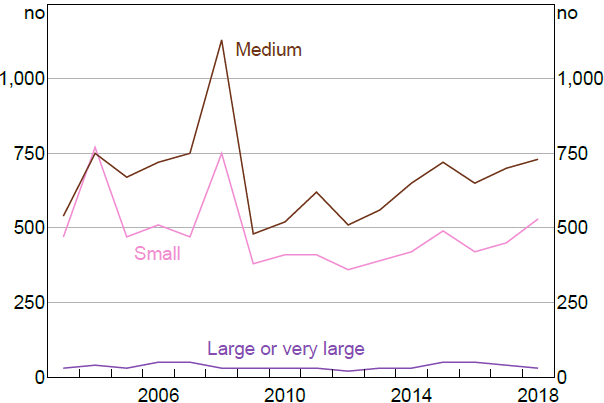
Notes: Each count is a single ABN. ‘Small’ is 1–19 employees, ‘Medium’ is 20–199 employees, ‘Large or very large’ is 200+ employees.
Sources: ABS; Authors' calculations.
Sources: ABS; Authors' calculations.
5.2 Modelling the odds of acquisition
We now turn to a more formal statistical model of the probability of a firm being an acquirer, or being acquired. This allows is to assess multiple dimensions at the same time, and tease out which factors might be important. For example, it could be that the earlier finding that acquirer tend to be larger is driven by the fact that acquirers tend to be in certain industries, and firms in those industries tend to be larger.
To do this, we need to decide how to treat business/enterprise group. For targets, we estimate the odds of being acquired at the level of the firm, as firm-level characteristics are likely to be most relevant when considering an acquisition. For acquirers, if the firm is part of an enterprise group, we proceed by aggregating all variables discussed at the enterprise group level. Where an acquiring firm is not a member of an enterprise group, it is treated as a one-firm enterprise group and all variables are constructed at firm-level. This means that an acquisition by any firm within a business group (regardless of its share of the group's activity) is taken as an acquisition by the group as a whole. This is consistent with the notion that strategic business decisions are made at the enterprise group level. For acquirer estimates, we use the mergers as measured by the labour flows and ASIC methods outlined above. For target estimates we use mergers as measured by labour flows (as the ASIC dataset does not contain details of targets).
We do not include mergers as measured by movements between tax consolidated groups for this analysis. This is because movements between these tax-consolidated entities consist of groups of entities moving together, some of which post no income or employees. In this case, performance measures cannot be calculated or may not reflect the true nature of the acquisitions even where they can be calculated.
We explore the impact of enterprise group/firm size, measured by both employment and turnover, on the likelihood of being an acquirer or target. An examination of the raw data indicates that the percentage of firms/enterprise groups making at least one acquisition in a financial year rises monotonically with size (consistent with Figure 6), with around 8 per cent of all enterprise groups with a turnover of over $500 million tagged in the dataset as acquirers, compared to around 5 per cent in the $200 to $500 million turnover bucket and 2 per cent in the $50 to $200 million turnover bucket. Less than 1 per cent of firms in the smallest turnover buckets (under $10 million and between $10 to $50 million) are acquirers. For target firms, there is a relatively higher distribution of targets among the mid-sized turnover buckets, consistent with Figure 7.
We also include measures of firm/enterprise group performance, measured by (the log of) productivity and profitability. Productivity (calculated as value added divided by full-time-equivalent employment) and profitability (profitability is calculated as income divided by expenses) are constructed using variables from the business income tax records in BLADE.[6] We use a three-year average of these variables to abstract from volatility, and to account for the fact that sustained profit and productivity performance may be relevant for an acquirer to undertake a merger, or for a firm to be considered a target.
To explore the role of intellectual property, we include variables for whether the firm/enterprise group involved in the merger holds one or more patents and trademarks. We use trademarks and patents registered by each firm as recorded by Intellectual Property Longitudinal Research Data (IPLORD).
Finally, we include industry and year effects. Inclusion of year dummies allows us to abstract from macroeconomic conditions and more general year-to-year volatility in M&A activity. For some specifications we interact these with years dummies, which allow us to account for industry conditions and other factors that may be driving M&A actvity, and so just compare firms within industries. For acquired firms, we use 2-digit ANZSIC codes. For acquirers, we use 1-digit ANZSIC Divisions. This is because there is a large number of complex enterprise groups among the acquirer sample. The complex entities may tend to have operations in a number of subdivisions, so we focus on a coarser industry control. In cases where the acquirer has activities across several Divisions, we assign the most common ANZSIC Division to the entire group.
Formally, we estimate a logistic regression where the dependent variable is equal to 1 if the enterprise group i engages in at least one acquisition in a year t and 0 otherwise. We include firm size dummies (sizeit), whether the enterprise group held at least one patent (patentit) or registered trademark (trademarkit) as well as profitability (profitabilityit) and productivity (productivityit). In the regressions we also control for industry-year fixed effects to capture broader conditions in the sector. Standard errors are clustered at the firm/enterprise group level, and so allow for autocorrelation.
5.3 Acquirer results
The likelihood of being an acquirer rises monotonically by size, measured both by employment and turnover (Table 4). Compared to enterprise groups with a turnover of less than $10 million, firms/enterprise groups in the next turnover bucket are 6 times more likely to be acquirers. This increases to 15 and 29 times more likely for firms in the $50 million to $200 million and the $200 million to $500 million turnover buckets. The largest enterprise groups with a turnover of more than $500 million have the highest odds of being an acquirer – they are 48 times more likely to be acquirers compared to the reference group of firms/enterprise groups with a turnover of less than $10 million. This monotonic increase in the odds of being an acquirer is also apparent when we measure size using employee headcounts instead of turnover. Results controlling for industry show similar (under headcount measures of size) or stronger (under turnover measures of size) relationships between the size of an enterprise group and the odds of it being an acquirer.
The profitability of an enterprise group/firm seems to have little bearing on the odds of being an acquirer with the productivity results are mixed: they range from higher productivity leading to a slightly lower likelihood (under turnover measures of size) to a slightly higher likelihood (under headcount measures of size). This is consistent with the potential different motivations for being an acquirer, discussed above, and so could be a useful direction for future research.
Enterprise groups holding at least one trademark are around 1.6 to 2 times as likely to be an acquirer, with slightly smaller odds after controlling for industry. The existence of a patent does not seem to increase the odds of an enterprise group being an acquirer.
Australia's new mandatory merger regime will require notification where (a) the acquirer has a turnover above $200 million, and the target has Australian turnover of more than $50 million; and (b) a business with Australian turnover of more than $500 million and the target has a turnover above $10 million. These results indicate that the threshold at $200 million would capture firms most likely to be acquirers.
| Turnover size controls | Employment size controls | |||
|---|---|---|---|---|
| $10m to $50m turnover | 6.301*** (0.194) |
6.866*** (0.234) |
||
| $50m to $200m turnover | 15.16*** (0.719) |
16.72*** (0.862) |
||
| $200m to $500m turnover | 28.89*** (2.154) |
32.25*** (2.538) |
||
| $500m+ turnover | 48.45*** (4.372) |
54.58*** (5.226) |
||
| 21 to 200 employees | 5.914*** (0.216) |
6.003*** (0.220) |
||
| 201 to 500 employees | 32.79*** (1.685) |
32.08*** (1.696) |
||
| 501+ employees | 88.36*** (5.154) |
83.68*** (5.097) |
||
| At least one patent | 1.033 (0.0934) |
1.094 (0.0989) |
1.139 (0.101) |
1.189* (0.105) |
| At least one trademark | 1.881*** (0.125) |
1.726*** (0.118) |
1.601*** (0.0983) |
1.591*** (0.102) |
| Profitability | 0.968 (0.0531) |
0.867** (0.0546) |
1.001 (0.0843) |
0.950 (0.0896) |
| Productivity | 0.919*** (0.0121) |
0.925*** (0.0128) |
1.204*** (0.0248) |
1.181*** (0.0252) |
| Industry-year fixed effects | No | Yes | No | Yes |
| Year fixed effects | Yes | No | Yes | No |
| Pseudo R-squared | 0.01 | 0.03 | 0.01 | 0.03 |
| Observations | 2,307,395 | 2,307,395 | 2,339,760 | 2,339,760 |
|
Notes: Odds ratios and diagnostics from logit model to predict acquiring firms. *** and ** denote statistical significance at the 1 and 5 per cent levels, respectively. Standard errors are in parentheses and are for the odds ratios not the coefficients from the logit model. Sources: ABS; Authors' calculations. |
||||
5.4 Target results
The target results (estimated at firm level) indicate that mid-sized firms are most likely to be targets in a merger (Table 5). Firms with a turnover of between $10 million and $50 million are around 1.4 times more likely to be a merger target in any given year, compared to the benchmark firms with a turnover of less than $1 million. Firms with a turnover of between $5 million and $10 million are the next most likely group to be acquired and are around 1.2 times more likely to be targets compared to the benchmark group. In both cases, the likelihood is a bit stronger once the industry distribution of the types of firms is accounted for. In contrast small firms with a turnover between $1 million and $5 million are least likely to be targets in a merger.
Using the headcount measure of size, firms employing between 20 and 100 employees are most likely to be targets once the distribution of firms across industries is taken into account, followed by firms employing between 101 and 500 employees (1.4 times more likely). The results for larger firms earning over $50 million and those employing over 500 employees is insignificant, suggesting they have a similar probability of being a target as very small firms.
| Turnover size controls | Employment size controls | |||
|---|---|---|---|---|
| $1m to $5m turnover | 0.866*** (0.0169) |
0.877*** (0.0185) |
||
| $5m to $10m turnover | 1.169*** (0.0349) |
1.207*** (0.0385) |
||
| $10m to $50m turnover | 1.348*** (0.0424) |
1.396*** (0.0474) |
||
| $50m+ turnover | 1.047 (0.0789) |
1.071 (0.0831) |
||
| 20 to 100 employees | 1.592*** (0.0278) |
1.531*** (0.0274) |
||
| 101 to 500 employees | 1.591*** (0.0591) |
1.410*** (0.0547) |
||
| 501+ employees | 0.872 (0.117) |
0.709** (0.0955) |
||
| Belongs to EG | 0.914 (0.0552) |
0.872** (0.0538) |
0.910 (0.0542) |
0.922 (0.0556) |
| At least one patent | 0.845 (0.131) |
0.875 (0.136) |
0.854 (0.132) |
0.895 (0.138) |
| At least one trademark | 0.583*** (0.0260) |
0.561*** (0.0252) |
0.579*** (0.0253) |
0.566*** (0.0252) |
| Profitability | 1.338*** (0.0301) |
1.235*** (0.0346) |
1.336*** (0.0311) |
1.231*** (0.0356) |
| Productivity | 0.898*** (0.0100) |
0.878*** (0.00957) |
0.925*** (0.0105) |
0.895*** (0.00996) |
| Industry-year fixed effects | No | Yes | No | Yes |
| Year fixed effects | Yes | Yes | No | No |
| Pseudo R-square | 0.01 | 0.04 | 0.01 | 0.04 |
| Observations | 2,353,462 | 2,353,332 | 2,353,462 | 2,353,332 |
|
Notes: Odds ratios and diagnostics from logit model to predict target firms. *** and ** denote statistical significance at the 1 and 5 per cent levels, respectively. Standard errors are in parentheses and are for the odds ratios not the coefficients from the logit model. Sources: ABS; Authors' calculations. |
||||
Interestingly, under all specifications, firms are less likely to be a member of an enterprise group.
Notably, more profitable firms are more likely to be targets, but so are less productive firms. Recall that profitability is calculated here as income divided by expenses, while productivity is calculated as value added divided by employment. These results could imply that these target firms are considered good revenue generating prospects that would benefit from reorganization, which could include rationalising the workforce and gaining synergies from existing auxiliary services (like administration and HR). These findings are more in line with the set of overseas findings pointing to low productivity firms being a target of acquisition (Harris and Robinson 2002; Bertrand and Zitouna 2008).
A future area of research could be to track the productivity and profitability performance of acquirers and targets both before and after a merger. Given the possibility that the target's workforce may be rationalised, analysing what happens to workers of the target may also be a good avenue for future research.
Target firms are less likely to hold a registered trademark and the existence of at least one registered patent does not seem to have a bearing on whether a firm is a target in any given year, with results insignificant across all specifications. This is an surprising result, since acquisition of intellectual property rights may be a motivation for merger activity.
To explore this further, we re-run the regression with the intellectual property intensity, using the count of trademarks and patents held by target firms (Table 6). The results indicate that the intensive margin does matter, with each additional patent held by a firm increasing the odds of it becoming a target by 3 per cent. In contrast, an additional trademark held by a firm slightly decreases the odds of it becoming a target in a given year.
| Turnover size controls | Employment size controls | |||
|---|---|---|---|---|
| $1m to $5m turnover | 0.935*** (0.0188) |
0.952** (0.0207) |
||
| $5m to $10m turnover | 1.258*** (0.038) |
1.318*** (0.0425) |
||
| $10m to $50m turnover | 1.465*** (0.0463) |
1.546*** (0.0527) |
||
| $50m+ turnover | 2.140*** (0.0895) |
1.997*** (0.0871) |
||
| 20 to 100 employees | 1.583*** (0.0276) |
1.522*** (0.0272) |
||
| 101 to 500 employees | 1.576*** (0.0586) |
1.393*** (0.0541) |
||
| 501+ employees | 0.909 (0.122) |
0.734** (0.0984) |
||
| Belongs to EG | 0.686*** (0.043) |
0.676*** (0.0429) |
0.921 (0.0546) |
0.929 (0.0558) |
| Number of patents | 1.027*** (0.00293) |
1.027*** (0.00306) |
1.025*** (0.00289) |
1.025*** (0.00302) |
| Number of trademarks | 0.893*** (0.0134) |
0.893*** (0.014) |
0.903*** (0.0134) |
0.903*** (0.014) |
| Profitability | 1.249*** (0.0363) |
1.133*** (0.0417) |
1.283*** (0.0405) |
1.158*** (0.0459) |
| Productivity | 0.889*** (0.00954) |
0.873*** (0.00934) |
0.927*** (0.0107) |
0.898*** (0.0103) |
| Industry-year fixed effects | No | Yes | No | Yes |
| Year fixed effects | Yes | No | Yes | No |
| Pseudo R-square | 0.01 | 0.03 | 0.01 | 0.03 |
| Observations | 2,353,497 | 2,353,367 | 2,353,497 | 2,353,367 |
|
Notes: Odds ratios and diagnostics from logit model to predict target firms, using intensive margin of intellectual property measures. *** and ** denote statistical significance at the 1 and 5 per cent levels, respectively. Standard errors are in parentheses and are for the odds ratios not the coefficients from the logit model. Sources: ABS; Authors' calculations. |
||||
One potential explanation for the patent results may relate to target firms holding rights to products that acquirers may see as particularity valuable. For example, it may show a preference for products with mid-level complexity, which are ready to bring to the Australian market.
Fernandez Donoso (2014) shows that products with mid-level complexity are more likely to have a high patent count while products with very high complexity are likely to cutting-edge technologies that are protected by trade secrets, making them less likely to be shared with the world through the patenting system. This nuanced relationship between intellectual property and mergers would be a valuable area for future research.
Footnotes
This analysis has focused on a subset of data currently available in BLADE. However, further avenue of research will become possible as the ABS adds new data modules into BLADE in areas such as managerial skill and corporate board membership. [5]
Value added is calculated as income minus expenses plus depreciation, wages, interest, super, bad debts and rent. [6]