
RDP 2026-04: Tracking Mergers and Acquisitions Using Australian Administrative Data 3. Data and Methodology
July 2026
- Download the Paper 2.2MB
As noted above, we take three different approaches to identify mergers. Each has its own strengths and weaknesses, and is likely to capture different types of mergers. We provide more detail on the approaches in the following sections, but below we give a high-level overview of each approach, and how they relate to each other in terms of scope and coverage. First, using payrolls data, we track flows of clusters of workers moving from one firm to another within a short period of time. Second, we track the movement of groups of companies between tax consolidated groups.[3] Last, we track forms submitted to ASIC signalling a takeover or a scheme of arrangement, which are both methods under which mergers may occur in Australia. The scope of mergers covered by the different approaches is summarised in Table 1.
As evident from the above, there should be little overlap between the labour flows method and the tax consolidation method. In almost 90 per cent of acquisitions, the target entity under the labour flows method disappears from the administrative data in the year following worker moves. In contrast, the entity under the tax consolidation method stays intact and nominates a new head company after it moves groups. The tax consolidation approach also has a narrower scope than the other two methods because it only tracks transactions between tax consolidated group. While it is possible to track firms that enter consolidated groups where they were not previously part of a consolidated group, we would not be able to confirm whether these are mergers. That is because tax consolidated groups may hold interests in entities outside the group, and so may already own the entity that is entering the consolidated group.
| Merger tracking method | Type of merger captured | Mergers not captured |
|---|---|---|
| Labour flows method | Mergers by all business types and sizes, where a substantial percentage of workers leave the original entity and start being paid by a new entity. |
|
| Tax consolidated group changes | Purchase of entities by one tax consolidated group from another tax consolidated group. |
|
| ASIC form submissions | Change in ownership of the entity through takeovers and schemes of arrangement, usually executed through purchases of equities or units in trusts. |
|
|
Source: ABS. |
||
Notwithstanding the three approaches, there are still some examples of M&A activity that we are currently not able to capture: where there is a purchase of assets like buildings, equipment, leases and intellectual property that are sold to another entity but where no/few workers move with the assets and where control of a firm is acquired by another entity through acquisition of majority shareholding/special voting rights. Looking at these other forms of change in control of a firm's operations would be a useful area of future research.
3.1 Tracking employee flows
Using payment summaries from the Person Level Integrated Data Asset (PLIDA) linked with firm-level data in the Business Longitudinal Analysis Data Environment (BLADE), we link all employees to their employers in Australia over the period 2000–2020. We then identify all worker transitions (i.e. when a worker moves employers) and apply the following rules: we keep all movements where a worker was at a new firm in year t but not at t −1; and where workers are at a new firm in year t + 1 but not in t −1.
To focus on mergers, rather than normal job transitions, we require 50 per cent or more of all employees in a target firm to move to the acquiring firm within the year. In line with the literature, we also remove cases where target firms have fewer than 10 employees to limit the possibility that we are picking up movements of a handful of workers in job transitions unrelated to mergers. We remove corporate restructures, where both acquiring and target firms belong to the same Enterprise Group (EG). An EG in BLADE is a group of related businesses that are usually part of a wholly-owned or otherwise controlled group. These filters give us the full sample of all possible mergers, as indicated by the full sample line in Figure 1.
We attempt to remove phoenix firms by requiring that the acquiring firm must have existed in t −1. A firm may phoenix when it ceases operations and restarts under another business, without a substantial change to its workforce. This can also occur for reasons such as change in business type (e.g. going from partnership to company). However, requiring that firms must exist in t −1 potentially removes mergers that are implemented by way of a new special purpose vehicle (SPV), or where two firms merge into a new entity. We address the latter by adding back in cases where two firms appear to be acquired by one new firm. Further work could address the use of SPVs, potentially by requiring that the EG existed in t −1, not the Australian business number (ABN), as SPVs are primarily used by large entities for complex/large acquisitions.
One limitation of this method is, as noted above, we cannot track mergers where assets move from one business to another but very few workers move with them. For example, a business operation may be sold where only the assets are moved, but the staff are retained by the parent company or are let go. In this case, we cannot track the merger as assets are not tracked in our dataset.
Using this methodology, we find that there were around 1,000 mergers each year from 2003–2018. Figure 1 shows three series. First, it shows the counts of activity where at least 50 per cent of workers have moved to a new entity between one year and the next (labeled as ‘Full sample’). Imposing the filter that the new firm must exist before the labour movement gives us the second series, labelled ‘Pre-exist’. Last, adding back in our suspected cases of SPVs gives us the final estimate of mergers and acquisitions using this method. Figure 1 shows that there was a period of relatively robust mergers activity in the early to mid-2000s, with a spike in 2008 of around almost 2,000 acquisitions. Mergers activity dropped off to around 1,000 acquisitions in 2009. Activity has been slowly rising over the past decade, although mergers activity remains lower than in the period before 2009.
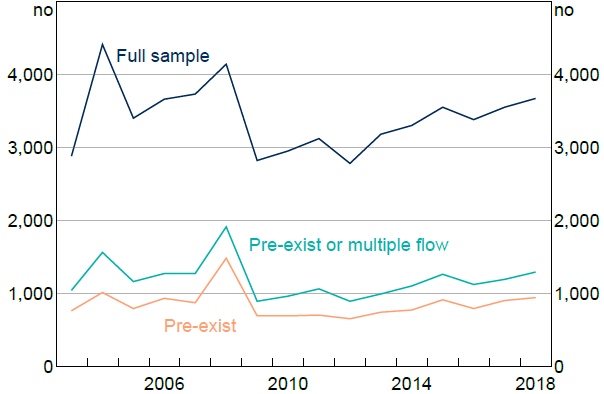
Notes: Each count is a single ABN. ‘Full sample’ counts all cases where a large share of workers moved to another entity. ‘Pre-exist’ only captures cases where the acquiring firm existed in year t −1. ‘Pre-exist or multiple flow’ measure is similar, but also includes cases where two or more entities flowed into one new entity, suggesting a merger.
Sources: ABS; Authors' calculations.
3.2 Tracking movements between tax consolidated groups
The tax consolidation regime in Australia allows wholly-owned entities to be treated as a single entity for taxation purposes. Entities that are wholly-owned by a foreign parent entity can form a multiple entry consolidated group. In both cases, a head entity must be nominated as the ultimate holding company for every member of the group. We can therefore infer an acquisition has taken place when an entity changes its nominated ultimate holding company and consolidated group identifier in its tax records.
Specifically, we define a merger as having potentially occurred where, in a financial year:
- an ABN is currently a member of a consolidated group;
- the ABN transferred from a different consolidated group, and
- the time difference between the end date at the previous consolidated group and the start date at the new consolidated group is less than 30 days.
One limitation of this method is that it will miss mergers where the target firm is not already part of a consolidated group. While it is possible to track firms that enter a consolidated group, it is not possible to determine if this event represents the entry of a firm already owned by the group or mergers activity. For example, the tax consolidated group may already control an entity that has been previously kept out of the group because it was controlled but not wholly owned, or for strategic business reasons. For this reason, we limit our mergers counts to include only those cases where a firm is already part of a consolidated group and changes its nominated head company.
We find around 2,000 ABNs switching between tax consolidated groups over the past 20 years (Figure 2), with a spike of activity in the mid-2000s, echoing the spike we saw in the labour flows charts.
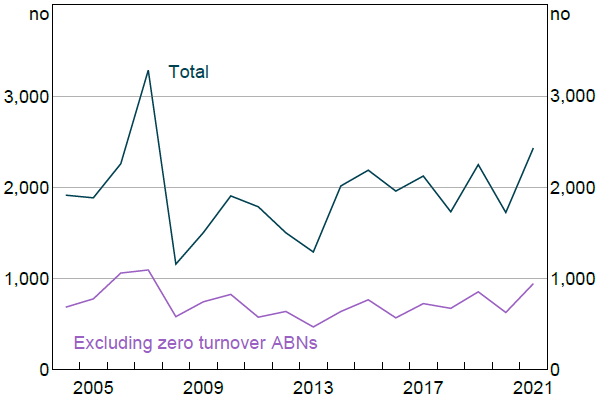
Note: Each count is a single ABN.
Sources: ABS; Authors' calculations.
Notably we also find that a third to a half of all ABNs that are switching between consolidated groups do not post a turnover in the tax system, and many do not have payment summaries associated with them, indicating that these firms do not have any employees. This may be because these entities are vehicles for holding assets such as buildings, plant or intangible assets such as options, leases or intellectual property assets. So this approach seems potentially well suited to capturing transfers of assets.
We further find that groups of ABNs move together from one consolidated group to another. Aggregating and tracking firms that move together may be a more accurate way to track the number of mergers than simply counting the ABNs separately. This is because the firm grouping may represent one arm of economic activity – where plant and buildings are owned by one ABN, the intellectual property by another, and workers attached to yet another firm. It can also more accurately represent the overall financing effort or size of the ‘deal’ that the acquirer undertakes. For these reasons, we take a group of ABNs moving between groups as one merger and the preferred measure for tracking mergers between consolidated groups.
Overall, grouping the ABNs that are moving together, plus adding singleton ABN moves, we find that over the past 20 years, between 300 and 400 groups of ABNs moved between tax consolidated groups. Figure 3 shows that the period of relatively robust activity in 2008 was followed by a sharp drop off in 2009, again echoing the mergers activities we saw in the labour flows method. Activity has been slowly rising since 2010, recovering back to around 400 mergers per year by the end of our data.
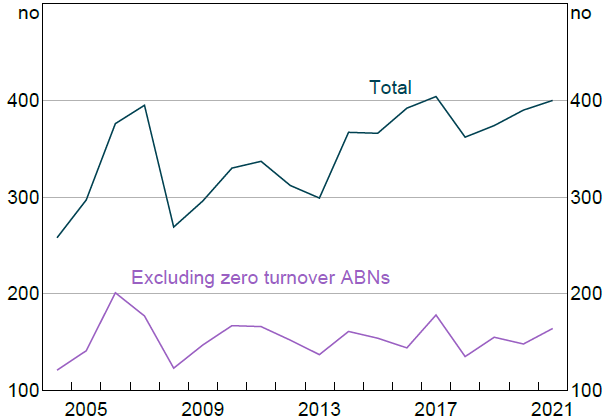
Note: Each count is a group of ABNs from a single consolidation group.
Sources: ABS; Authors' calculations.
Interestingly, some acquisitions are of groups of ABNs that post zero turnover, so potentially holding assets such as buildings or intellectual property. These zero-turnover acquisitions have been relatively stable, with around 150 groups of firms every year posting zero turnover in the tax system.
3.3 Takeovers and schemes of arrangement
ASIC requires several forms to be lodged when one firm conducts a takeover of another firm. These forms are related to takeover bids and conditions related to the takeover operation.
There are two types of takeover bids: an off market bid (which may offer cash or other consideration, may be subject to conditions, and may be for 100 per cent of the target securities or a specified proportion of each target security holder's securities); and a market bid (which must be an unconditional cash offer). Virtually all takeover bids are off-market bids because of the ability to include conditions (such as ‘defeating conditions’ that end the takeover bid if conditions are not met).
Another way that firms may merge is through a scheme of arrangement, which is a shareholder and court-approved statutory arrangement between a company and its shareholders that becomes binding on all shareholders. Members of a scheme lodge a court order document approving the scheme, which we use to identify those entities involved in a scheme.
For our analysis, we obtain forms for both takeover bids, and schemes of arrangement from ASIC. We focus on the forms submitted by the acquirer (which comprise almost all the form types) and ignore forms submitted by the targets to avoid double counting. The relevant forms are detailed in Appendix A.
Adding this method allows us to identify the firms undertaking mergers but does not accurately allow us to identify the number of mergers taking place. This is because each merger/takeover is likely to have a number of forms submitted during execution, with the combination of forms specific to the circumstances of the transaction. We see a spike in the number of acquiring firms in 2008 and 2009, echoing the analysis presented above using the labour flows and tax consolidated groups method. Interestingly, we see another spike in 2012 and 2013, after which the number of acquiring firms stabilises to around 50 firms each year (Figures 4 and 5).
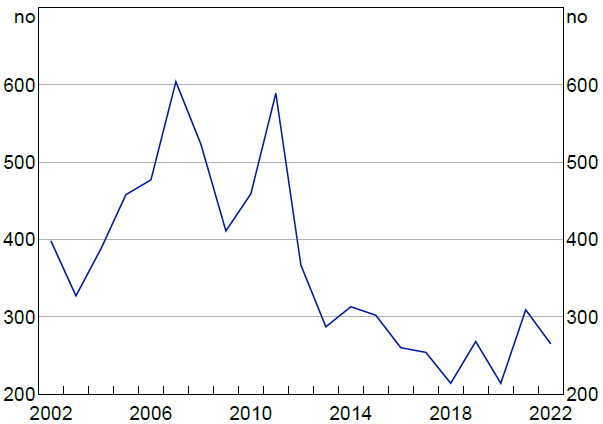
Note: Each count is a single merger form.
Sources: ABS; ASIC; Authors' calculations.
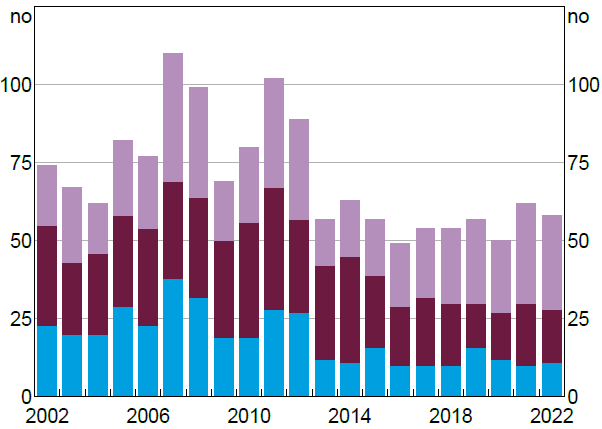
Notes: Each count represents a single acquisition. Partial takeovers in 2016, 2017, 2018 and 2021 have a count of 10 or less and are rounded to 10 to prevent identifiability of firms.
Sources: ABS; ASIC; Authors' calculations.
Footnote
Tax consolidation in Australia is where groups of wholly-owned firms are able to interact with the tax system as one entity for reporting taxable income and utilising tax losses. [3]