
Research Discussion Paper – RDP 2026-04 Tracking Mergers and Acquisitions Using Australian Administrative Data
July 2026
1. Introduction
Australia has been rare among advanced economies in not having had a formal requirement for firms to ‘pre-notify’ the competition authority of an upcoming merger.[1] While this situation will change from 2026 when Australia introduces a formal obligation to notify, up until now notification has been purely voluntary. The absence of any formal reporting requirement has contributed to a lack of comprehensive data on mergers and acquisitions (M&A) activity in Australia. This incomplete view of M&A activity has limited the ability of Australian researchers and policymakers to derive policy-relevant insights into patterns in M&A activity and the effects of that activity on the Australian economy. For example, without comprehensive data it is difficult to assess how factors such as firm size and industry affect the pattern of M&A activity, let alone the impact of mergers on the employees, productivity and broader performance of the merging firms.
In this paper, we seek to address these gaps by building the first M&A database using Australian administrative microdata. The use of administrative data for research has expanded greatly in recent years with the increasing availability of powerful, linked government datasets. By building the database and methodology, and making it accessible in the Australian Bureau of Statistics secure Datalab environment, we hope to enable future researchers to analyse the economic consequences of M&A. This can help to inform policy to support a resilient, dynamic and productive private sector in Australia. We also hope this database and methodology will support other important research that would benefit from information on M&A, such as research into the effects of firm closure on worker outcomes.
As mentioned above, this new database also comes at a critical juncture for Australia's merger system, as it moves from a voluntary to a mandatory and suspensory regime from 1 January 2026. This means mergers above designated monetary thresholds will be prohibited from proceeding without approval from the competition authority, and failure to notify such mergers will render them void. The specific thresholds set out in legislation are as follows:
- Australian turnover of the combined businesses is above $200 million, and either the business or assets being acquired has Australian turnover of more than $50 million or global transaction value above $250 million.
- A business with Australian turnover of more than $500 million buying a smaller business or assets with Australian turnover above $10 million.
We make use of these thresholds in our analysis below, allowing our new database to provide some early insights into the nature of mergers that may be captured.[2] Similarly, our database can help inform these key policy settings going forward.
While the focus of the paper is on the methodology and database, we provide some initial insight to demonstrate its value. Three key insights emerge:
- The number of mergers was higher over the 2000s, before declining in the early 2010s and then recovering somewhat in the late 2010s. Part of the more recent pick up reflected increasing acquisitions by very large firms.
- A sizable share of acquisitions are made by firms acquiring multiple different businesses over time, often referred to as ‘serial’ or ‘creeping’ acquisitions. These acquisitions are particularity prevalent in the Care and Medical Services sectors.
- Takeover targets are most likely to be medium-sized entities with higher profitability and lower productivity. They are also likely to have a larger number of patents, though many also have no patents. This may suggest that target firms that do have patents, tend to have patents on moderately complex technologies with patents attached to the technology. Acquirers are, unsurprisingly, likely to be large and likely to have trademarks.
The paper proceeds as follows. Section 2 provides a short literature review and Section 3 steps through the data and methodology for Australia. Sections 4 and 5 document some initial insights from the database, looking at serial acquisitions and what types of firms are more likely to be acquirers or targets, before Section 6 concludes and discusses next steps.
2. Literature Review
Our paper relates to previous overseas studies that seek to measure merger and acquisition activity using indirect methods in the absence of formal reporting requirements.
One method used in the literature is to use surveys, or private sector databases on known mergers or acquisitions (such as Bloomberg or SDC Platinum investment banking deal activity database). However, private sector databases pose several limitations for research. Most notably, they fail to capture the full spectrum of mergers and acquisitions within an economy, often skewing towards large publicly announced transactions. For instance, Sharma and Ho (2002) relies on a small sample of just 36 Australian acquisitions. Second, while these databases usually contain some firm-level and industry-level information, they do not have a full range of information on subsidiaries, workers or wages. As a result, the effects of mergers, productivity and workers cannot be analysed.
Another method is to use administrative data to identify restructures (including mergers) by tracking worker flows between firms in a linked employee-employer dataset. This method can identify mergers, but also improve overall administrative data quality by allowing researchers to identify cases where a firm appears to have closed, but there has actually been a re-structuring Hethey-Maier and Schmieder (2013), which can be important in exploring the effect of job loss and firm closure on workers. This method for identifying mergers is built on the assumption that workers from a target firm move together to the new acquiring firm. Since not all workers in a target firm may move (and the acquiring firm may rationalise the target workforce) a merger is usually taken to have occurred if a certain percentage or number of workers move together to a new firm. For example, Benedetto et al (2007) and Hethey-Maier and Schmieder (2013) use both shares and numbers, classifying a worker cluster transition to occur either where five or more workers move together between the firms or when 80 per cent of employees from the target move to the acquirer. Similarly, Geurts and Van Biesebroeck (2014) uses a minimum cluster of three to five employees in addition to a set of percentage thresholds. This method will normally exclude very small firms to remove the chance that natural turnover in these firms are erroneously identified as mergers. For example, Benedetto et al (2007) and Geurts and Vets (2013) exclude firms with five or fewer employees.
One difficulty in using this approach is differentiation between mergers and other types of restructures, such as where a part of a firm is spun off to create a new firm. For example, Geurts and Vets (2013) links two firms using threshold worker flows and then identifies whether the firms are start ups, exiting or continuing firms, using the relative size of these flows. Geurts and Van Biesebroeck (2014) differentiates between mergers, where at least 50 per cent of employees move to acquirer, and takeovers, where over 75 per cent of workers move to the acquirer. Fackler, Schnabel and Schmucker (2016) follows an approach used by Eriksson and Kuhn (2006) to identify start up firms, in which more than 50 per cent of the initial workforce were employed together in the same firm in the year before, but only if this group of workers did not make up more than 50 per cent of the predecessor firm's workforce.
This paper adopts the second method outlined above – that is, by tracking both flows of workers. We also add two other methods, using data not previously available to researchers: tracking flows of entities between tax consolidated groups; and tracking firms' lodgments of merger forms to the securities regulator, the Australian Securities and Investments Commission (ASIC).
3. Data and Methodology
As noted above, we take three different approaches to identify mergers. Each has its own strengths and weaknesses, and is likely to capture different types of mergers. We provide more detail on the approaches in the following sections, but below we give a high-level overview of each approach, and how they relate to each other in terms of scope and coverage. First, using payrolls data, we track flows of clusters of workers moving from one firm to another within a short period of time. Second, we track the movement of groups of companies between tax consolidated groups.[3] Last, we track forms submitted to ASIC signalling a takeover or a scheme of arrangement, which are both methods under which mergers may occur in Australia. The scope of mergers covered by the different approaches is summarised in Table 1.
As evident from the above, there should be little overlap between the labour flows method and the tax consolidation method. In almost 90 per cent of acquisitions, the target entity under the labour flows method disappears from the administrative data in the year following worker moves. In contrast, the entity under the tax consolidation method stays intact and nominates a new head company after it moves groups. The tax consolidation approach also has a narrower scope than the other two methods because it only tracks transactions between tax consolidated group. While it is possible to track firms that enter consolidated groups where they were not previously part of a consolidated group, we would not be able to confirm whether these are mergers. That is because tax consolidated groups may hold interests in entities outside the group, and so may already own the entity that is entering the consolidated group.
| Merger tracking method | Type of merger captured | Mergers not captured |
|---|---|---|
| Labour flows method | Mergers by all business types and sizes, where a substantial percentage of workers leave the original entity and start being paid by a new entity. |
|
| Tax consolidated group changes | Purchase of entities by one tax consolidated group from another tax consolidated group. |
|
| ASIC form submissions | Change in ownership of the entity through takeovers and schemes of arrangement, usually executed through purchases of equities or units in trusts. |
|
|
Source: ABS. |
||
Notwithstanding the three approaches, there are still some examples of M&A activity that we are currently not able to capture: where there is a purchase of assets like buildings, equipment, leases and intellectual property that are sold to another entity but where no/few workers move with the assets and where control of a firm is acquired by another entity through acquisition of majority shareholding/special voting rights. Looking at these other forms of change in control of a firm's operations would be a useful area of future research.
3.1 Tracking employee flows
Using payment summaries from the Person Level Integrated Data Asset (PLIDA) linked with firm-level data in the Business Longitudinal Analysis Data Environment (BLADE), we link all employees to their employers in Australia over the period 2000–2020. We then identify all worker transitions (i.e. when a worker moves employers) and apply the following rules: we keep all movements where a worker was at a new firm in year t but not at t −1; and where workers are at a new firm in year t + 1 but not in t −1.
To focus on mergers, rather than normal job transitions, we require 50 per cent or more of all employees in a target firm to move to the acquiring firm within the year. In line with the literature, we also remove cases where target firms have fewer than 10 employees to limit the possibility that we are picking up movements of a handful of workers in job transitions unrelated to mergers. We remove corporate restructures, where both acquiring and target firms belong to the same Enterprise Group (EG). An EG in BLADE is a group of related businesses that are usually part of a wholly-owned or otherwise controlled group. These filters give us the full sample of all possible mergers, as indicated by the full sample line in Figure 1.
We attempt to remove phoenix firms by requiring that the acquiring firm must have existed in t −1. A firm may phoenix when it ceases operations and restarts under another business, without a substantial change to its workforce. This can also occur for reasons such as change in business type (e.g. going from partnership to company). However, requiring that firms must exist in t −1 potentially removes mergers that are implemented by way of a new special purpose vehicle (SPV), or where two firms merge into a new entity. We address the latter by adding back in cases where two firms appear to be acquired by one new firm. Further work could address the use of SPVs, potentially by requiring that the EG existed in t −1, not the Australian business number (ABN), as SPVs are primarily used by large entities for complex/large acquisitions.
One limitation of this method is, as noted above, we cannot track mergers where assets move from one business to another but very few workers move with them. For example, a business operation may be sold where only the assets are moved, but the staff are retained by the parent company or are let go. In this case, we cannot track the merger as assets are not tracked in our dataset.
Using this methodology, we find that there were around 1,000 mergers each year from 2003–2018. Figure 1 shows three series. First, it shows the counts of activity where at least 50 per cent of workers have moved to a new entity between one year and the next (labeled as ‘Full sample’). Imposing the filter that the new firm must exist before the labour movement gives us the second series, labelled ‘Pre-exist’. Last, adding back in our suspected cases of SPVs gives us the final estimate of mergers and acquisitions using this method. Figure 1 shows that there was a period of relatively robust mergers activity in the early to mid-2000s, with a spike in 2008 of around almost 2,000 acquisitions. Mergers activity dropped off to around 1,000 acquisitions in 2009. Activity has been slowly rising over the past decade, although mergers activity remains lower than in the period before 2009.
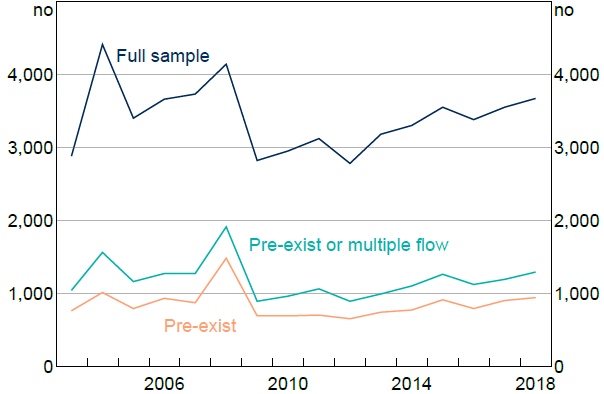
Notes: Each count is a single ABN. ‘Full sample’ counts all cases where a large share of workers moved to another entity. ‘Pre-exist’ only captures cases where the acquiring firm existed in year t −1. ‘Pre-exist or multiple flow’ measure is similar, but also includes cases where two or more entities flowed into one new entity, suggesting a merger.
Sources: ABS; Authors' calculations.
3.2 Tracking movements between tax consolidated groups
The tax consolidation regime in Australia allows wholly-owned entities to be treated as a single entity for taxation purposes. Entities that are wholly-owned by a foreign parent entity can form a multiple entry consolidated group. In both cases, a head entity must be nominated as the ultimate holding company for every member of the group. We can therefore infer an acquisition has taken place when an entity changes its nominated ultimate holding company and consolidated group identifier in its tax records.
Specifically, we define a merger as having potentially occurred where, in a financial year:
- an ABN is currently a member of a consolidated group;
- the ABN transferred from a different consolidated group, and
- the time difference between the end date at the previous consolidated group and the start date at the new consolidated group is less than 30 days.
One limitation of this method is that it will miss mergers where the target firm is not already part of a consolidated group. While it is possible to track firms that enter a consolidated group, it is not possible to determine if this event represents the entry of a firm already owned by the group or mergers activity. For example, the tax consolidated group may already control an entity that has been previously kept out of the group because it was controlled but not wholly owned, or for strategic business reasons. For this reason, we limit our mergers counts to include only those cases where a firm is already part of a consolidated group and changes its nominated head company.
We find around 2,000 ABNs switching between tax consolidated groups over the past 20 years (Figure 2), with a spike of activity in the mid-2000s, echoing the spike we saw in the labour flows charts.
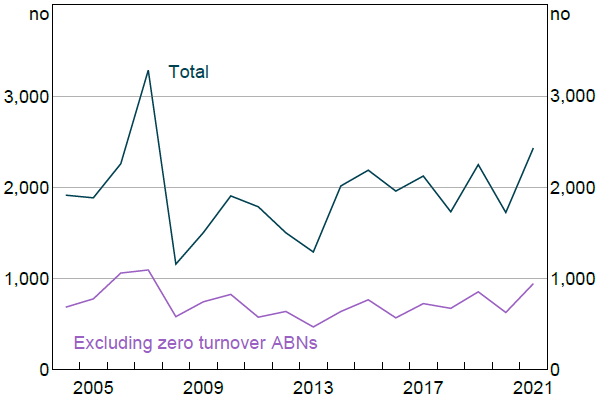
Note: Each count is a single ABN.
Sources: ABS; Authors' calculations.
Notably we also find that a third to a half of all ABNs that are switching between consolidated groups do not post a turnover in the tax system, and many do not have payment summaries associated with them, indicating that these firms do not have any employees. This may be because these entities are vehicles for holding assets such as buildings, plant or intangible assets such as options, leases or intellectual property assets. So this approach seems potentially well suited to capturing transfers of assets.
We further find that groups of ABNs move together from one consolidated group to another. Aggregating and tracking firms that move together may be a more accurate way to track the number of mergers than simply counting the ABNs separately. This is because the firm grouping may represent one arm of economic activity – where plant and buildings are owned by one ABN, the intellectual property by another, and workers attached to yet another firm. It can also more accurately represent the overall financing effort or size of the ‘deal’ that the acquirer undertakes. For these reasons, we take a group of ABNs moving between groups as one merger and the preferred measure for tracking mergers between consolidated groups.
Overall, grouping the ABNs that are moving together, plus adding singleton ABN moves, we find that over the past 20 years, between 300 and 400 groups of ABNs moved between tax consolidated groups. Figure 3 shows that the period of relatively robust activity in 2008 was followed by a sharp drop off in 2009, again echoing the mergers activities we saw in the labour flows method. Activity has been slowly rising since 2010, recovering back to around 400 mergers per year by the end of our data.
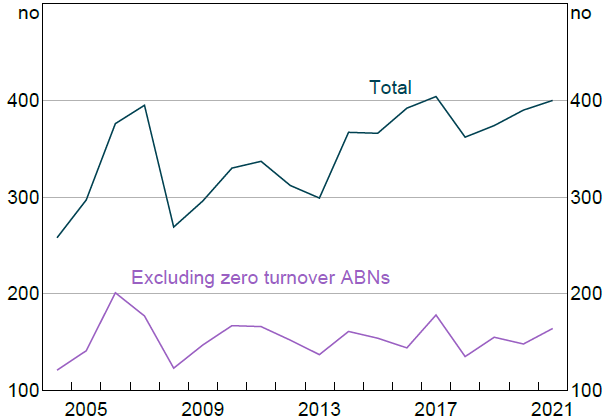
Note: Each count is a group of ABNs from a single consolidation group.
Sources: ABS; Authors' calculations.
Interestingly, some acquisitions are of groups of ABNs that post zero turnover, so potentially holding assets such as buildings or intellectual property. These zero-turnover acquisitions have been relatively stable, with around 150 groups of firms every year posting zero turnover in the tax system.
3.3 Takeovers and schemes of arrangement
ASIC requires several forms to be lodged when one firm conducts a takeover of another firm. These forms are related to takeover bids and conditions related to the takeover operation.
There are two types of takeover bids: an off market bid (which may offer cash or other consideration, may be subject to conditions, and may be for 100 per cent of the target securities or a specified proportion of each target security holder's securities); and a market bid (which must be an unconditional cash offer). Virtually all takeover bids are off-market bids because of the ability to include conditions (such as ‘defeating conditions’ that end the takeover bid if conditions are not met).
Another way that firms may merge is through a scheme of arrangement, which is a shareholder and court-approved statutory arrangement between a company and its shareholders that becomes binding on all shareholders. Members of a scheme lodge a court order document approving the scheme, which we use to identify those entities involved in a scheme.
For our analysis, we obtain forms for both takeover bids, and schemes of arrangement from ASIC. We focus on the forms submitted by the acquirer (which comprise almost all the form types) and ignore forms submitted by the targets to avoid double counting. The relevant forms are detailed in Appendix A.
Adding this method allows us to identify the firms undertaking mergers but does not accurately allow us to identify the number of mergers taking place. This is because each merger/takeover is likely to have a number of forms submitted during execution, with the combination of forms specific to the circumstances of the transaction. We see a spike in the number of acquiring firms in 2008 and 2009, echoing the analysis presented above using the labour flows and tax consolidated groups method. Interestingly, we see another spike in 2012 and 2013, after which the number of acquiring firms stabilises to around 50 firms each year (Figures 4 and 5).
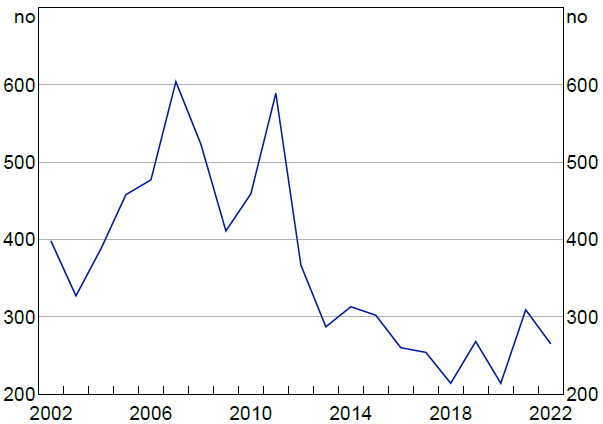
Note: Each count is a single merger form.
Sources: ABS; ASIC; Authors' calculations.
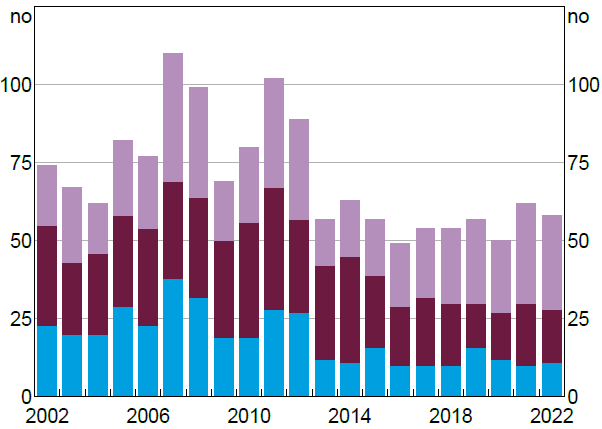
Notes: Each count represents a single acquisition. Partial takeovers in 2016, 2017, 2018 and 2021 have a count of 10 or less and are rounded to 10 to prevent identifiability of firms.
Sources: ABS; ASIC; Authors' calculations.
4. Serial Acquisitions
While the focus of this paper is on methodologies and the database, below we document two case studies of how the database could be used to better understand M&A activity in Australia, and in turn inform policy. These case studies also provide a valuable cross-check on the data, as they can allow us to consider whether patterns align with what might be expected based on other data sources.
The first of these is to consider ‘serial acquisitions’ (or ‘creeping acquisitions’) where an acquirer makes numerous small acquisitions in the same market over time that may cumulatively lead to a significant increase in market share. Serial acquisitions are an area of increasing focus for regulators, as they can allow an acquirer to avoid review by competition authorities as each individual acquisition is too small to be detected and/or trigger statutory thresholds for notification.[4] For example, in their submission on merger law reform, the ACCC highlighted serial acquisitions as a key increasing area of concern, and gap in the current mergers regime (ACCC 2024).
Serial acquisitions have been explored extensively in some other advanced economies, but to date there has been relatively limited work in Australia. One notable piece of research is (Hossain, Pham and Islam 2021), which finds that serial acquirers have lower stock returns than single acquirers. But it focuses on a relatively small sub-set of mergers recorded in private sector data.
To consider this issue in the administrative data, use mergers identified under the labour flows and tax consolidated groups (TCG) methods because they are able to link acquirers to targets. We start by looking at some aggregate measures of serial acquisitions. To do this we simply look at how many identified acquisitions each acquirer has over the sample, where we treat multiple acquisitions occurring in the same year as one to limit issues around several entities being acquired as part of the same deal. We can see that around 10 per cent of acquirers have more than one acquisition, with a number having several across the sample (Table 2).
| Number | Labour flows method | TCG method |
|---|---|---|
| 1 | 8,170 | 3,140 |
| 2 | 720 | 240 |
| 3 | 180 | – |
| 4 | 70 | – |
| 5+ | 110 | – |
|
Note: TCG method top-coded at 2 due to small sample sizes, so includes cases with more than two acquisitions. Sources: ABS; Authors' calculations. |
||
While the aggregate numbers are useful to get a sense of these outcomes, we may be particularly interested in cases where acquisitions are in the same industry, as these cases may be more concerning from a competition dimension by allowing a firm to increase its market share and so gain market power. And even more so where there are several such acquisitions over a number of years.
We create a measure of serial acquisitions as follows. First we use the mergers identified through the labour flows methodology. This is because we can link the acquirer and target under the labour flows method (unlike the ASIC method) and the entity being acquired is likely to be an entity with business operations (as it holds the payrolls of staff, unlike the tax consolidated method where groups of related entities may move together, with some firms having zero turnover). Then we identify potential cases of serial acquisitions by selecting labour flows where:
- the acquiring ABN and target ABN share the same 4-digit ANZSIC class (‘same-industry’)
- the acquirer has made same-industry acquisitions in a single ANZSIC class in at least 3 years during the period 2003 to 2018. These years need not be consecutive.
We find that around 40 per cent of all labour flows satisfy the first criterion above (same-industry), while around 7 per cent satisfy both criteria (same-industry, serial acquisitions).
Table 3 shows the ANZSIC classes (4-digit industries) with the highest incidence of these same-industry, serial acquisitions. Rankings were assigned by counting each year during the period 2003 to 2018 where a serial acquisition occurred, as defined above, and then summing these counts over acquirers. It is interesting that the top four serial acquisition industries are in care and medical services, while supermarkets and some hospitality industries are all high on the list. The ACCC has previously identified grocery retailing and childcare as sectors of concern with regards to serial acquisitions (ACCC 2024).
| Rank | ANZSIC class |
|---|---|
| 1 | Q 8710 Child Care Services |
| 2 | Q 8601 Aged Care Residential Services |
| 3 | Q 8511 General Practice Medical Services |
| 4 | Q 8531 Dental Services |
| 5 | G 4110 Supermarket and Grocery Stores |
| 6 | M 7000 Computer System Design and Related Services |
| 7 | H 4512 Takeaway Food Services |
| 8 | G 4271 Pharmaceutical, Cosmetic and Toiletry Goods Retailing |
| 9 | H 4400 Accommodation |
| 10 | H 4520 Pubs, Taverns and Bars |
|
Source: ABS. |
|
Unsurprisingly, serial acquires tend to be quite large firms. For example, of the 61 serial acquirers across these top ten ANZSIC classes, around 40 per cent were in the top 10 of their ANZSIC class by turnover in the year of the acquisition. So its seems to be the largest firms in industries who are making these serial acquisitions, reinforcing concerns that they could be being used to increase maker share and market power.
While this provides some initial insights into serial acquisitions, but there are numerous areas that could be explored in the future. For example, to what extent have serial acquisitions actually increased market concentration? What are the characteristics of those being acquired? Do they tend to be more innovative, raising concerns around the potential for ‘killer acquisitions’ aimed at discontinuing a competitors innovative ideas (Cunningham, Ederer and Ma 2021)? And what happens to the workers in these firms?
5. The Characteristics of Acquiring and Target Firms
The database lets us explore the characteristics of those firms involved in M&A activity, which is useful for a range of reasons. For example, understanding the nature of acquiring and acquired firms can provide valuable insights for policy. For example, better understanding the relative size of the parties can help us understand what share of the activity appears to be mergers of equals, and what share acquisition on firms. Considering the profitability and productivity of acquired firms can help us to understand issues around whether acquisitions appear to be focused on under-performing firms that can be turned around, or high-performing firms. And exploring the industry dimensions can help us understand where the activity tends to take place, and therefore where more focus could be beneficial for competition regulators.
More generally, exploring the nature of these firms can help us better understand the motivations for M&A. While the overseas literature is relatively well-developed on this issue, studies in an Australian context are rare owing to the data limitations discussed above. For example, overseas analysis has shown that firms may seek to increase innovation or patent stock (Entezarkheir and Moshiri 2019), relieve financial frictions in target firms, especially when the target firm is relatively small (Erel, Jang and Weisbach 2015), or be driven by cyclical technological or industry shocks (Martynova and Renneboog 2008). Managerial hubris or misstep may also be a factor: Martynova and Renneboog (2008) argues that takeovers towards the end of each cyclical wave of mergers are usually driven by non-rational, frequently self-interested managerial decision-making. The motivation for mergers can also be highly industry-specific and strategic within a regulatory environment: for example, the desire to obtain ‘too-big-to-fail’ status may motivate US banking mergers (DeYoung, Evanoff and Molyneux 2009). Mergers may also be motivated by low productivity financially constrained acquirers looking to avoid constraints (Bruyland et al 2019; Zhang 2022), by higher productivity firms targeting lower productivity firms to improve them (Andrade, Mitchell and Stafford 2001; Harris and Robinson 2002; Fukao, Ito and Kwon 2005; Bertrand and Zitouna 2008), or by high productivity acquirers targeting high productivity targets (Rhodes–Kropf, Robinson and Viswanathan 2005; David 2021).
Our dataset is well-placed to explore questions relating to a range of entity characteristics such as size, productivity, broader performance measures including profitability, and more niche issues such as the role of intellectual property.[5] As detailed below, we use this dataset to quantify how these characteristics affect the likelihood of a business being involved in at least one merger in a given year, providing separate estimates for acquirers and targets.
5.1 Trends by firm size over time and industry
We start by simply looking at the sizes of acquiring firms and acquired firms over time. For this analysis, we generally focus on the labour flows approach, because it should capture a more representative cross-section of firm types than the other approaches.
Figures 6 and 7 decompose acquisitions based on the size of the acquirer and target firm. We can see that most target firms are medium-sized businesses, while acquisitions are disproportionately made by very large firms (who account for less than 1 per cent of the universe of firms). After a large spike in activity in 2009 by very large acquirers (related to the health sector) merger activity stabilised for all sizes of acquirers for a run of years before slowly increasing after 2013. The increase was particularly notable for very large firms.
Figure 8 shows the average annual annual distribution of M&A activity by Division over the sample period 2002 to 2018. It shows that in terms of total numbers, M&A was more frequent in the utilities, professional services, retail trade and health divisions. But when scaling by the size of the industry the story looks a bit different, with administrative services, health, mining and manufacturing featuring more prominently.
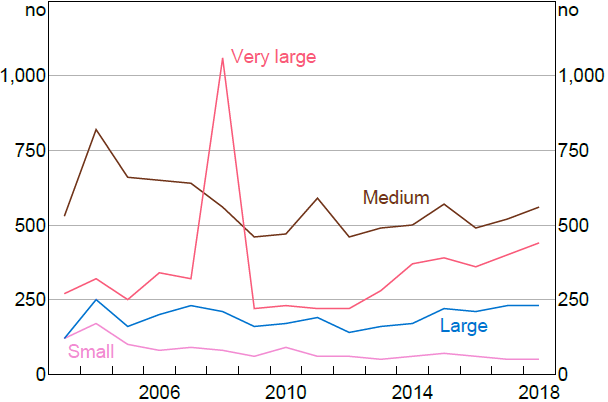
Notes: Each count is a single ABN. ‘Small’ is 1–19 employees, ‘Medium’ is 20–199 employees, ‘Large’ is 200–499 employees, ‘Very large’ is 500+ employees.
Sources: ABS; Authors' calculations.
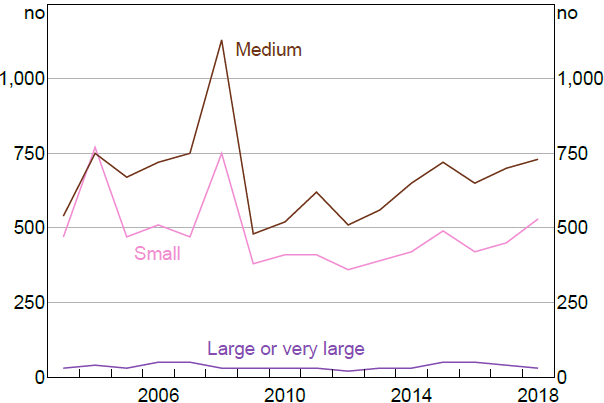
Notes: Each count is a single ABN. ‘Small’ is 1–19 employees, ‘Medium’ is 20–199 employees, ‘Large or very large’ is 200+ employees.
Sources: ABS; Authors' calculations.
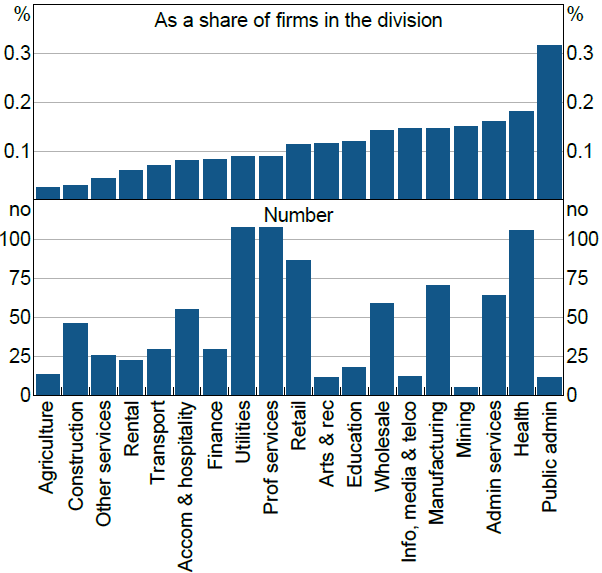
Sources: ABS; Authors' calculations.
5.2 Modelling the odds of acquisition
We now turn to a more formal statistical model of the probability of a firm being an acquirer, or being acquired. This allows is to assess multiple dimensions at the same time, and tease out which factors might be important. For example, it could be that the earlier finding that acquirer tend to be larger is driven by the fact that acquirers tend to be in certain industries, and firms in those industries tend to be larger.
To do this, we need to decide how to treat business/enterprise group. For targets, we estimate the odds of being acquired at the level of the firm, as firm-level characteristics are likely to be most relevant when considering an acquisition. For acquirers, if the firm is part of an enterprise group, we proceed by aggregating all variables discussed at the enterprise group level. Where an acquiring firm is not a member of an enterprise group, it is treated as a one-firm enterprise group and all variables are constructed at firm-level. This means that an acquisition by any firm within a business group (regardless of its share of the group's activity) is taken as an acquisition by the group as a whole. This is consistent with the notion that strategic business decisions are made at the enterprise group level. For acquirer estimates, we use the mergers as measured by the labour flows and ASIC methods outlined above. For target estimates we use mergers as measured by labour flows (as the ASIC dataset does not contain details of targets).
We do not include mergers as measured by movements between tax consolidated groups for this analysis. This is because movements between these tax-consolidated entities consist of groups of entities moving together, some of which post no income or employees. In this case, performance measures cannot be calculated or may not reflect the true nature of the acquisitions even where they can be calculated.
We explore the impact of enterprise group/firm size, measured by both employment and turnover, on the likelihood of being an acquirer or target. An examination of the raw data indicates that the percentage of firms/enterprise groups making at least one acquisition in a financial year rises monotonically with size (consistent with Figure 6), with around 8 per cent of all enterprise groups with a turnover of over $500 million tagged in the dataset as acquirers, compared to around 5 per cent in the $200 to $500 million turnover bucket and 2 per cent in the $50 to $200 million turnover bucket. Less than 1 per cent of firms in the smallest turnover buckets (under $10 million and between $10 to $50 million) are acquirers. For target firms, there is a relatively higher distribution of targets among the mid-sized turnover buckets, consistent with Figure 7.
We also include measures of firm/enterprise group performance, measured by (the log of) productivity and profitability. Productivity (calculated as value added divided by full-time-equivalent employment) and profitability (profitability is calculated as income divided by expenses) are constructed using variables from the business income tax records in BLADE.[6] We use a three-year average of these variables to abstract from volatility, and to account for the fact that sustained profit and productivity performance may be relevant for an acquirer to undertake a merger, or for a firm to be considered a target.
To explore the role of intellectual property, we include variables for whether the firm/enterprise group involved in the merger holds one or more patents and trademarks. We use trademarks and patents registered by each firm as recorded by Intellectual Property Longitudinal Research Data (IPLORD).
Finally, we include industry and year effects. Inclusion of year dummies allows us to abstract from macroeconomic conditions and more general year-to-year volatility in M&A activity. For some specifications we interact these with years dummies, which allow us to account for industry conditions and other factors that may be driving M&A actvity, and so just compare firms within industries. For acquired firms, we use 2-digit ANZSIC codes. For acquirers, we use 1-digit ANZSIC Divisions. This is because there is a large number of complex enterprise groups among the acquirer sample. The complex entities may tend to have operations in a number of subdivisions, so we focus on a coarser industry control. In cases where the acquirer has activities across several Divisions, we assign the most common ANZSIC Division to the entire group.
Formally, we estimate a logistic regression where the dependent variable is equal to 1 if the enterprise group i engages in at least one acquisition in a year t and 0 otherwise. We include firm size dummies (sizeit), whether the enterprise group held at least one patent (patentit) or registered trademark (trademarkit) as well as profitability (profitabilityit) and productivity (productivityit). In the regressions we also control for industry-year fixed effects to capture broader conditions in the sector. Standard errors are clustered at the firm/enterprise group level, and so allow for autocorrelation.
5.3 Acquirer results
The likelihood of being an acquirer rises monotonically by size, measured both by employment and turnover (Table 4). Compared to enterprise groups with a turnover of less than $10 million, firms/enterprise groups in the next turnover bucket are 6 times more likely to be acquirers. This increases to 15 and 29 times more likely for firms in the $50 million to $200 million and the $200 million to $500 million turnover buckets. The largest enterprise groups with a turnover of more than $500 million have the highest odds of being an acquirer – they are 48 times more likely to be acquirers compared to the reference group of firms/enterprise groups with a turnover of less than $10 million. This monotonic increase in the odds of being an acquirer is also apparent when we measure size using employee headcounts instead of turnover. Results controlling for industry show similar (under headcount measures of size) or stronger (under turnover measures of size) relationships between the size of an enterprise group and the odds of it being an acquirer.
The profitability of an enterprise group/firm seems to have little bearing on the odds of being an acquirer with the productivity results are mixed: they range from higher productivity leading to a slightly lower likelihood (under turnover measures of size) to a slightly higher likelihood (under headcount measures of size). This is consistent with the potential different motivations for being an acquirer, discussed above, and so could be a useful direction for future research.
Enterprise groups holding at least one trademark are around 1.6 to 2 times as likely to be an acquirer, with slightly smaller odds after controlling for industry. The existence of a patent does not seem to increase the odds of an enterprise group being an acquirer.
Australia's new mandatory merger regime will require notification where (a) the acquirer has a turnover above $200 million, and the target has Australian turnover of more than $50 million; and (b) a business with Australian turnover of more than $500 million and the target has a turnover above $10 million. These results indicate that the threshold at $200 million would capture firms most likely to be acquirers.
| Turnover size controls | Employment size controls | |||
|---|---|---|---|---|
| $10m to $50m turnover | 6.301*** (0.194) |
6.866*** (0.234) |
||
| $50m to $200m turnover | 15.16*** (0.719) |
16.72*** (0.862) |
||
| $200m to $500m turnover | 28.89*** (2.154) |
32.25*** (2.538) |
||
| $500m+ turnover | 48.45*** (4.372) |
54.58*** (5.226) |
||
| 21 to 200 employees | 5.914*** (0.216) |
6.003*** (0.220) |
||
| 201 to 500 employees | 32.79*** (1.685) |
32.08*** (1.696) |
||
| 501+ employees | 88.36*** (5.154) |
83.68*** (5.097) |
||
| At least one patent | 1.033 (0.0934) |
1.094 (0.0989) |
1.139 (0.101) |
1.189* (0.105) |
| At least one trademark | 1.881*** (0.125) |
1.726*** (0.118) |
1.601*** (0.0983) |
1.591*** (0.102) |
| Profitability | 0.968 (0.0531) |
0.867** (0.0546) |
1.001 (0.0843) |
0.950 (0.0896) |
| Productivity | 0.919*** (0.0121) |
0.925*** (0.0128) |
1.204*** (0.0248) |
1.181*** (0.0252) |
| Industry-year fixed effects | No | Yes | No | Yes |
| Year fixed effects | Yes | No | Yes | No |
| Pseudo R-squared | 0.01 | 0.03 | 0.01 | 0.03 |
| Observations | 2,307,395 | 2,307,395 | 2,339,760 | 2,339,760 |
|
Notes: Odds ratios and diagnostics from logit model to predict acquiring firms. *** and ** denote statistical significance at the 1 and 5 per cent levels, respectively. Standard errors are in parentheses and are for the odds ratios not the coefficients from the logit model. Sources: ABS; Authors' calculations. |
||||
5.4 Target results
The target results (estimated at firm level) indicate that mid-sized firms are most likely to be targets in a merger (Table 5). Firms with a turnover of between $10 million and $50 million are around 1.4 times more likely to be a merger target in any given year, compared to the benchmark firms with a turnover of less than $1 million. Firms with a turnover of between $5 million and $10 million are the next most likely group to be acquired and are around 1.2 times more likely to be targets compared to the benchmark group. In both cases, the likelihood is a bit stronger once the industry distribution of the types of firms is accounted for. In contrast small firms with a turnover between $1 million and $5 million are least likely to be targets in a merger.
Using the headcount measure of size, firms employing between 20 and 100 employees are most likely to be targets once the distribution of firms across industries is taken into account, followed by firms employing between 101 and 500 employees (1.4 times more likely). The results for larger firms earning over $50 million and those employing over 500 employees is insignificant, suggesting they have a similar probability of being a target as very small firms.
| Turnover size controls | Employment size controls | |||
|---|---|---|---|---|
| $1m to $5m turnover | 0.866*** (0.0169) |
0.877*** (0.0185) |
||
| $5m to $10m turnover | 1.169*** (0.0349) |
1.207*** (0.0385) |
||
| $10m to $50m turnover | 1.348*** (0.0424) |
1.396*** (0.0474) |
||
| $50m+ turnover | 1.047 (0.0789) |
1.071 (0.0831) |
||
| 20 to 100 employees | 1.592*** (0.0278) |
1.531*** (0.0274) |
||
| 101 to 500 employees | 1.591*** (0.0591) |
1.410*** (0.0547) |
||
| 501+ employees | 0.872 (0.117) |
0.709** (0.0955) |
||
| Belongs to EG | 0.914 (0.0552) |
0.872** (0.0538) |
0.910 (0.0542) |
0.922 (0.0556) |
| At least one patent | 0.845 (0.131) |
0.875 (0.136) |
0.854 (0.132) |
0.895 (0.138) |
| At least one trademark | 0.583*** (0.0260) |
0.561*** (0.0252) |
0.579*** (0.0253) |
0.566*** (0.0252) |
| Profitability | 1.338*** (0.0301) |
1.235*** (0.0346) |
1.336*** (0.0311) |
1.231*** (0.0356) |
| Productivity | 0.898*** (0.0100) |
0.878*** (0.00957) |
0.925*** (0.0105) |
0.895*** (0.00996) |
| Industry-year fixed effects | No | Yes | No | Yes |
| Year fixed effects | Yes | Yes | No | No |
| Pseudo R-square | 0.01 | 0.04 | 0.01 | 0.04 |
| Observations | 2,353,462 | 2,353,332 | 2,353,462 | 2,353,332 |
|
Notes: Odds ratios and diagnostics from logit model to predict target firms. *** and ** denote statistical significance at the 1 and 5 per cent levels, respectively. Standard errors are in parentheses and are for the odds ratios not the coefficients from the logit model. Sources: ABS; Authors' calculations. |
||||
Interestingly, under all specifications, firms are less likely to be a member of an enterprise group.
Notably, more profitable firms are more likely to be targets, but so are less productive firms. Recall that profitability is calculated here as income divided by expenses, while productivity is calculated as value added divided by employment. These results could imply that these target firms are considered good revenue generating prospects that would benefit from reorganization, which could include rationalising the workforce and gaining synergies from existing auxiliary services (like administration and HR). These findings are more in line with the set of overseas findings pointing to low productivity firms being a target of acquisition (Harris and Robinson 2002; Bertrand and Zitouna 2008).
A future area of research could be to track the productivity and profitability performance of acquirers and targets both before and after a merger. Given the possibility that the target's workforce may be rationalised, analysing what happens to workers of the target may also be a good avenue for future research.
Target firms are less likely to hold a registered trademark and the existence of at least one registered patent does not seem to have a bearing on whether a firm is a target in any given year, with results insignificant across all specifications. This is an surprising result, since acquisition of intellectual property rights may be a motivation for merger activity.
To explore this further, we re-run the regression with the intellectual property intensity, using the count of trademarks and patents held by target firms (Table 6). The results indicate that the intensive margin does matter, with each additional patent held by a firm increasing the odds of it becoming a target by 3 per cent. In contrast, an additional trademark held by a firm slightly decreases the odds of it becoming a target in a given year.
| Turnover size controls | Employment size controls | |||
|---|---|---|---|---|
| $1m to $5m turnover | 0.935*** (0.0188) |
0.952** (0.0207) |
||
| $5m to $10m turnover | 1.258*** (0.038) |
1.318*** (0.0425) |
||
| $10m to $50m turnover | 1.465*** (0.0463) |
1.546*** (0.0527) |
||
| $50m+ turnover | 2.140*** (0.0895) |
1.997*** (0.0871) |
||
| 20 to 100 employees | 1.583*** (0.0276) |
1.522*** (0.0272) |
||
| 101 to 500 employees | 1.576*** (0.0586) |
1.393*** (0.0541) |
||
| 501+ employees | 0.909 (0.122) |
0.734** (0.0984) |
||
| Belongs to EG | 0.686*** (0.043) |
0.676*** (0.0429) |
0.921 (0.0546) |
0.929 (0.0558) |
| Number of patents | 1.027*** (0.00293) |
1.027*** (0.00306) |
1.025*** (0.00289) |
1.025*** (0.00302) |
| Number of trademarks | 0.893*** (0.0134) |
0.893*** (0.014) |
0.903*** (0.0134) |
0.903*** (0.014) |
| Profitability | 1.249*** (0.0363) |
1.133*** (0.0417) |
1.283*** (0.0405) |
1.158*** (0.0459) |
| Productivity | 0.889*** (0.00954) |
0.873*** (0.00934) |
0.927*** (0.0107) |
0.898*** (0.0103) |
| Industry-year fixed effects | No | Yes | No | Yes |
| Year fixed effects | Yes | No | Yes | No |
| Pseudo R-square | 0.01 | 0.03 | 0.01 | 0.03 |
| Observations | 2,353,497 | 2,353,367 | 2,353,497 | 2,353,367 |
|
Notes: Odds ratios and diagnostics from logit model to predict target firms, using intensive margin of intellectual property measures. *** and ** denote statistical significance at the 1 and 5 per cent levels, respectively. Standard errors are in parentheses and are for the odds ratios not the coefficients from the logit model. Sources: ABS; Authors' calculations. |
||||
One potential explanation for the patent results may relate to target firms holding rights to products that acquirers may see as particularity valuable. For example, it may show a preference for products with mid-level complexity, which are ready to bring to the Australian market.
Fernandez Donoso (2014) shows that products with mid-level complexity are more likely to have a high patent count while products with very high complexity are likely to cutting-edge technologies that are protected by trade secrets, making them less likely to be shared with the world through the patenting system. This nuanced relationship between intellectual property and mergers would be a valuable area for future research.
6. Conclusion
Mergers and acquisition research in Australia has long been hampered by shortcomings in data availability. Previously available data sources have not had full financial details of the transacting parties, nor has it previously allowed linking with the employees in each of the firms.
In this paper we present a methodology to create a database using linked administrative data. Using clusters of worker flows between firms, movements of clusters firms between tax consolidated groups, and details of firms lodging forms related to takeovers and schemes of arrangement, we find around 1,500 mergers a year.
Using this new database we provide some valuable early insights into merger activity in Australia. We find that the likelihood of being an acquirer rises dramatically with size of the enterprise groups, and that very large firms have accounted for a large share of the increase in merger activity over the 2010s. Targets are most likely to be mid-sized, singleton firms with slightly higher profitability, slightly lower productivity, and a large number of patents. And serial acquisitions appear to be an important feature of the Australian M&A landscape, and are particularity prevalent in some high-profile industries like health and supermarkets.
This is the first step in a rich field of future research in Australia and will allow researchers to answer questions including: what happens to workers of firms that merge; what subsequent financial and investment performance of merged firms looks like; and whether managerial quality makes a difference. The set of research questions that can be explored will also expand as new datasets are integrated into the data sharing ecosystem.
Appendix A: Detail on ASIC Forms
| Form name | Form code | Acquirer complete | Target complete |
|---|---|---|---|
| Off market takeovers | |||
| Off market bid | 6321B | ✓ | |
| Bidder statement and offer – off market | 6181 | ✓ | |
| Target statement and report – off market | 6211 | ✓ | |
| Notice of service of bidder's statement – off market | 6011 | ✓ | |
| Notice that takeover offers have been sent – off market | 6201 | ✓ | |
| Notice of status of defeating conditions | 672 | ✓ | |
| Defeating condition near end of offer period | 672B | ✓ | |
| Defeating condition fulfilled | 672A | ✓ | |
| Notice offers free of defeating condition – off market bid | 6261 | ✓ | |
| Notice date set for determining securities holders – off market | 670 | ✓ | |
| On market takeovers | |||
| Market bid | 6321A | ✓ | |
| Takeover bidders statement & docs sent to exchange | 6291 | ✓ | |
| Target statement and report – on market | 6331 | ✓ | |
| Document accompanying bidders statement – on market bid | 6301 | ✓ | |
| Compulsory acquisitions | |||
| Notice of compulsory acquisition following takeover bid | 6021 | ✓ | |
| Notice of right of buy out to remaining holder of securities following a takeover bid | 6022 | ✓ | |
| Notice of right of buy out to holders of convertible securities following a takeover bid | 6023 | ✓ | |
| Additional statements | |||
| Supplementary statement re takeover bid | 675 | ✓ | ✓ |
| Bidder's supplementary statement | 675A | ✓ | |
| Target's supplementary statement | 675B | ✓ | |
| Replacement bidder statement | 675C | ✓ | |
| Replacement bidder statement marked up | 675D | ✓ | |
| Court order re proportional takeover in constitution | 6271 | ✓ | ✓ |
| Notice of variation in takeover offer | 6321 | ✓ | |
| Notice of disclosure re substantial shareholding in bid period | 671 | ✓ | |
|
Source: ASIC. |
|||
References
ACCC (Australian Competition & Consumer Commission) (2024), ‘Treasury – Competition Taskforce Merger Reform – Consultation Paper – ACCC Submission’, Second submission to Treasury on merger reform, January.
Andrade G, M Mitchell and E Stafford (2001), ‘New Evidence and Perspectives on Mergers’, Journal of Economic Perspectives, 15(2), pp 103–120.
Benedetto G, J Haltiwanger, J Lane and K McKinney (2007), ‘Using Worker Flows to Measure Firm Dynamics’, Journal of Business & Economic Statistics, 25(3), pp 299–313.
Bertrand O and H Zitouna (2008), ‘Domestic Versus Cross-border Acquisitions: Which Impact on the Target Firms' Performance?’, Applied Economics, 40(17), pp 2221–2238.
Bruyland E, M Lasfer, W De Maeseneire and W Song (2019), ‘The Performance of Acquisitions by High Default Risk Bidders’, Journal of Banking & Finance, 101, pp 37–58.
Cunningham C, F Ederer and S Ma (2021), ‘Killer Acquisitions’, Journal of Political Economy, 129(3), pp 649–702.
David JM (2021), ‘The Aggregate Implications of Mergers and Acquisitions’, The Review of Economic Studies, 88(4), pp 1796–1830.
DeYoung R, DD Evanoff and P Molyneux (2009), ‘Mergers and Acquisitions of Financial Institutions: A Review of the Post-2000 Literature’, Journal of Financial Services Research, 36(2–3), pp 87–110.
Entezarkheir M and S Moshiri (2019), ‘Is Innovation a Factor in Merger Decisions? Evidence From a Panel of US Firms’, Empirical Economics, 57(5), pp 1783–1809.
Erel I, Y Jang and MS Weisbach (2015), ‘Do Acquisitions Relieve Target Firms' Financial Constraints?’, The Journal of Finance, 70(1), pp 289–328.
Eriksson T and JM Kuhn (2006), ‘Firm Spin-offs in Denmark 1981–2000 — Patterns of Entry and Exit’, International Journal of Industrial Organization, 24(5), pp 1021–1040.
Fackler D, C Schnabel and A Schmucker (2016), ‘Spinoffs in Germany: Characteristics, Survival, and the Role of Their Parents’, Small Business Economics, 46(1), pp 93–114.
Fernandez Donoso J (2014), ‘Do Complex Inventions Need Less International Patent Protection?’, Economics Letters, 125(2), pp 278–281.
Fukao K, K Ito and HU Kwon (2005), ‘Do Out-In M&As Bring Higher TFP to Japan? An Empirical Analysis Based on Micro-data on Japanese Manufacturing Firms’, Journal of the Japanese and International Economies, 19(2), pp 272–301.
Geurts K and J Van Biesebroeck (2014), ‘Job Creation, Firm Creation, and De Novo Entry’, KU Leuven Center for Economic Studies Discussion Paper No DPS14.25.
Geurts K and P Vets (2013), ‘Employee Flows to Study Firm and Employment Dynamics’, Dynam Working Paper No 2013.
Harris R and C Robinson (2002), ‘The Effect of Foreign Acquisitions on Total Factor Productivity: Plant-level Evidence from U.K. Manufacturing, 1987–1992’, The Review of Economics and Statistics, 84(3), pp 562–568.
Hethey-Maier T and JF Schmieder (2013), ‘Does the Use of Worker Flows Improve the Analysis of Establishment Turnover? Evidence from German Administrative Data’, Schmollers Jahrbuch: Journal of Applied Social Science Studies/Zeitschrift für Wirtschafts- und Sozialwissenschaften, 133(4), pp 477–510.
Hossain M, MD Pham and N Islam (2021), ‘The Performance and Motivation of Serial Acquisitions: Evidence from Australia’, International Review of Financial Analysis, 77, Article 101827.
Martynova M and L Renneboog (2008), ‘A Century of Corporate Takeovers: What Have We Learned and Where Do We Stand?’, Journal of Banking & Finance, 32(10), pp 2148–2177.
OECD (Organisation for Economic Co-operation and Development) (2023), ‘Serial Acquisitions and Industry Roll-ups’, OECD Competition Policy Roundtable Background Note.
Rhodes–Kropf M, DT Robinson and S Viswanathan (2005), ‘Valuation Waves and Merger Activity: The Empirical Evidence’, Journal of Financial Economics, 77(3), pp 561–603.
Sharma DS and J Ho (2002), ‘The Impact of Acquisitions on Operating Performance: Some Australian Evidence’, Journal of Business Finance & Accounting, 29(1-2), pp 155–200.
Zhang EQ (2022), ‘Why are Distressed Firms Acquisitive?’, Journal of Corporate Finance, 72, Article 102126.
Copyright and Disclaimer Notice
BLADE Disclaimer
The following Disclaimer Notice refers to data and graphs sourced from the Australian Bureau of Statistics' BLADE (Business Longitudinal Analysis Data Environment) database.
The results of these studies are based, in part, on data supplied to the ABS under the Taxation Administration Act 1953, A New Tax System (Australian Business Number) Act 1999, Australian Border Force Act 2015, Social Security (Administration) Act 1999, A New Tax System (Family Assistance) (Administration) Act 1999, Paid Parental Leave Act 2010 and/or the Student Assistance Act 1973. Such data may only be used for the purpose of administering the Census and Statistics Act 1905 or performance of functions of the ABS as set out in section 6 of the Australian Bureau of Statistics Act 1975. No individual information collected under the Census and Statistics Act 1905 is provided back to custodians for administrative or regulatory purposes. Any discussion of data limitations or weaknesses is in the context of using the data for statistical purposes and is not related to the ability of the data to support the Australian Taxation Office, Australian Business Register, Department of Social Services and/or Department of Home Affairs' core operational requirements.
Legislative requirements to ensure privacy and secrecy of these data have been followed. For access to MADIP and/or BLADE data under Section 16A of the ABS Act 1975 or enabled by section 15 of the Census and Statistics (Information Release and Access) Determination 2018, source data are de-identified and so data about specific individuals has not been viewed in conducting this analysis. In accordance with the Census and Statistics Act 1905, results have been treated where necessary to ensure that they are not likely to enable identification of a particular person or organisation.
Acknowledgements
Nu Nu Win would like to acknowledge the support of the Sir Roland Wilson Scholarship Program. The authors would like to thank Yun Jiang for research assistance and the Department of the Treasury's Competition Review Taskforce for valuable feedback and comments on this paper. The views expressed in this paper are those of the authors and should not be attributed to the Reserve Bank of Australia, the Australian Competition and Consumer Commission, the Department of the Treasury or the Australian Government. Any errors are the sole responsibility of the authors.
Footnotes
‘Pre-notify’ is used interchangeably with ‘notify’ in the merger context, with both referring to a requirement to alert the competition authority before a merger is completed. Merger control systems in many overseas jurisdictions are also ‘suspensory’ insofar as the merger cannot be completed until cleared by the competition authority. [1]
The new laws also include tailored notification rules for ‘serial acquisitions’, to deal with the strategy of larger businesses progressively accumulating market share via separate small transactions that would otherwise not be notifiable. The serial acquisition thresholds are not the focus of this paper's analysis but could easily be incorporated into future work. [2]
Tax consolidation in Australia is where groups of wholly-owned firms are able to interact with the tax system as one entity for reporting taxable income and utilising tax losses. [3]
See, for example, (OECD 2023) for a discussion of serial acquisitions, their impacts on competition, and approaches to notification and regulation. [4]
This analysis has focused on a subset of data currently available in BLADE. However, further avenue of research will become possible as the ABS adds new data modules into BLADE in areas such as managerial skill and corporate board membership. [5]
Value added is calculated as income minus expenses plus depreciation, wages, interest, super, bad debts and rent. [6]