
Research Discussion Paper – RDP 2026-03 Designing an Efficient Reference Rate: Lessons from SOFIA
June 2026
1. Introduction
Interest rate benchmarks are important to the functioning of modern financial markets. For example, in Australia, the bank bill swap rate (BBSW) is used to price contracts with a notional value worth $35 trillion in the 90-day futures market alone (ASX 2024). If a benchmark is distorted, financial contracts referencing it may be mispriced, undermining market efficiency. When benchmark quality is undermined, this can erode trust in the financial system, as illustrated by the global fallout from the London Interbank Offered Rate (LIBOR) scandal.
Two elements support the sound design and monitoring of benchmarks. First, benchmark quality must be measurable. Second, benchmark design should be informed by evidence on the factors that influence benchmark quality, including specific design elements and prevailing market conditions.
Broadly, benchmark quality is defined by two key characteristics: (i) low levels of noise, implying high informational efficiency; and (ii) resilience and robustness to manipulation. These are interrelated. Manipulation introduces noise by shifting rates away from their efficient market-based value, leading to movements that subsequently reverse (e.g. Comerton-Forde and Putniņš 2011a, 2011b). However, noise can also occur independently of manipulation. For instance, certain benchmark design features may fail to smooth or trim extreme rate observations, resulting in transitory price spikes.
This paper focuses on noise – defined as transitory deviations from the efficient rate that subsequently reverse. High noise impairs informational efficiency and distorts valuations of contracts indexed to the rate. We do not address the issue of manipulation directly as the beta version of the Secured Overnight Funding Index Australia (Beta SOFIA™) is published by the Australian Securities Exchange (ASX) solely for information and testing purposes. Its use as a reference, index, or benchmark in a financial instrument or contract is prohibited. Without contractual application, there is no object to be manipulated, and the incentive for manipulation is minimal during the beta phase. Where relevant, we discuss benchmark design features that are likely to affect both noise and manipulation incentives, drawing on the theoretical framework developed by Duffie and Dworczak (2021). We empirically estimate benchmark noise and examine how benchmark design and market conditions influence noise.
Our subject is Beta SOFIA, a new reference rate currently in beta form and not yet designated as a reference rate or financial benchmark. Given its developmental status, this presents a timely opportunity to evaluate the quality of the benchmark before it is launched. Beta SOFIA is based on overnight repurchase agreements (repos) collateralised by Australian dollar-denominated Australian and state government securities. It is administered by the ASX and was developed in response to demand from market participants for a secured overnight benchmark, similar to the Secured Overnight Financing Rate (SOFR) in the United States. Unlike many jurisdictions that have replaced legacy benchmarks like LIBOR with a single overnight rate – for example, SOFR in the United States and the Sterling Overnight Index Average (SONIA) in the United Kingdom – Australia has adopted a multi-rate approach: BBSW continues to operate alongside the cash rate (the unsecured overnight rate, also known by the acronym AONIA or AUD Overnight Index Average), with Beta SOFIA under development as a secured overnight rate.
Since 2023, the ASX has been publishing Beta SOFIA using volume-weighted trimmed mean methodology. The calculation excludes the bottom 25 per cent of transaction volume based on the yield distribution. This is because the repo market acts as a market for cash and collateral. The market for collateral is when participants engage in the repo market looking for a specific security as collateral, for example if they want to sell it short. Collateral transactions trade at discount to cash transactions. So, to decrease the chance of collateral transactions affecting Beta SOFIA, the administrator takes the transactions with lowest yield out of the data.
We estimate noise in Beta SOFIA using a state-space model developed in Brugler, Khomyn and Putniņš (2025), which allows us to generate a daily time series. Using transaction-level data on the repo trades underpinning Beta SOFIA, we also estimate noise at the level of individual repo trades. We then conduct time series and panel regressions to explain noise as a function of benchmark design and market structure variables, including trading volume, market concentration, related-party transaction prevalence, and market liquidity.
Our time series analysis shows that noise in Beta SOFIA tends to increase during periods of lower transaction volumes, greater market concentration, a higher proportion of related-party transactions, or reduced liquidity. These relationships are also confirmed at the transaction level, controlling for buyer and seller identity, collateral type, and day-level fixed effects, with standard errors clustered at the collateral-day level.
A key strength of this study is the use of a unique dataset comprising the actual repo transactions used to construct Beta SOFIA. This allows us to directly observe the rate distribution and simulate counterfactual benchmark designs (e.g. applying alternative trimming thresholds). For example, under the current design, the bottom 25 per cent of transaction volume (by yield) is excluded. We find that noise can be reduced by also trimming the top 5 per cent of transactions, although this comes at the cost of reduced eligible transaction volume.
Our findings yield several changes that could enhance SOFIA's design:
- Make the reporting of related-party transactions mandatory and exclude them from the rate calculation to improve benchmark quality and align with the International Organization of Securities Commissions (IOSCO) Principles for Financial Benchmarks (IOSCO 2013).
- Apply expert judgement when market liquidity falls below pre-defined thresholds where the risk of rate distortion increases substantially.
- Trim the top 5 per cent of transactions to avoid outliers and decrease the level of noise.
Some benchmark rates, such as BBSW and AONIA, have rules guiding how the rates are formed on days when market liquidity is exceptionally low, also known as expert judgement. To identify such a threshold, we analyse the distribution of noise on days with very low liquidity and find that noise tends to be four to five times higher when market activity falls below the following thresholds: total volume between $0.75-$1.5 billion; 10-20 transactions; or 6-14 distinct counterparties.[1]
This paper contributes to the growing literature on benchmark design, benchmark quality measurement, and the informational content of interest rate benchmarks.
First, we build on theoretical work on optimal benchmark design, particularly in the context of reforms following the LIBOR manipulation scandals. Duffie and Stein (2015) highlight the need for reforms to benchmark construction, arguing that manipulation risks are heightened when benchmarks are based on low transaction volumes or unverifiable submissions. Building on this, Duffie, Dworczak and Zhu (2017) and Duffie and Dworczak (2021) develop formal models of benchmark design that identify trade-offs between robustness, liquidity coverage, and responsiveness to market fundamentals.
Second, this paper contributes to the empirical literature comparing benchmarks. Empirical studies including Schrimpf and Sushko (2019) and Klingler and Syrstad (2021) assess whether alternative reference rates (ARRs) are more robust and less susceptible to manipulation, largely focusing on international benchmarks such as SOFR and SONIA. Indriawan, Jiao and Tse (2021) find that SOFR tracks the Federal Reserve Bank of New York's policy rate more closely than US$ LIBOR, supporting its adoption.
Unlike prior studies that predominantly rely on published daily data, we utilise the transaction-level regulatory dataset to gain deeper insights into the empirical properties of benchmark noise and its determinants. Our method builds on the empirical work of Brugler et al (2025), who evaluate the quality of LIBOR rates and ARRs in the international markets using a state-space model and find that ARRs are less noisy than LIBOR in four of the five markets. We adapt their methodology to a single-rate setting and use the measurable benchmark design features of Beta SOFIA as explanatory variables for noise.
Third, this study relates to the literature on constructing forward-looking term rates from overnight benchmarks. Although we focus on the quality of the overnight rate, our findings are relevant to the construction of term Beta SOFIA or similar derived benchmarks. As Liu and Bai (2022) point out, the absence of a forward-looking component in ARRs presents challenges for rate users. In response, Heitfield and Park (2019) and Skov and Skovmand (2021) propose models based on futures markets to estimate term structures. Our results contribute to this literature by showing that noise in the overnight benchmark may propagate into term rate construction, reinforcing the need to ensure robustness at the overnight tenor.
Methodologically, we apply a state-space model (Brugler et al 2025) to estimate benchmark noise, allowing us to separate transitory deviations from the efficient rate. This approach builds on empirical methods developed in the market microstructure literature to separate price signals from noise. Our approach follows in the spirit of Menkveld, Koopman and Lucas (2007), who estimate information and noise across overlapping trading intervals, and is closely related to Hasbrouck (1999), Figuerola-Ferretti and Gonzalo (2010), and Hendershott and Menkveld (2014). It also draws on literature that uses vector autoregression models to estimate information shares in parallel markets (e.g. Baillie et al 2002; Putniņš 2013; Hasbrouck 2021). More broadly, our work contributes to the literature on price informativeness (e.g. Campbell and Shiller 1988; Morck, Yeung and Yu 2000; Brogaard et al 2022) by offering a real-time metric of how closely a benchmark rate reflects fundamental value.
This paper proceeds as follows. Section 2 discusses the relevant institutional details of interest rate benchmarks and the repo market in Australia and internationally. Section 3 describes our data, including both Beta SOFIA as computed by the ASX and the underlying repo transactions that we analyse. Section 4 presents the state-space model we use to separate signal and noise from different benchmarks, time series and transaction-level regressions that relate noise to different market characteristics, and comparisons of noise across alternative benchmark design choices. Section 5 concludes.
2. Institutional Background
Interest rate benchmarks are reference rates used to price a vast array of financial products, including corporate loans, bonds, and derivatives such as swaps and futures. In Australia, retail lending products such as mortgages are generally not directly linked to these benchmarks, although changes in benchmark rates affect financial institutions' funding costs and can influence lending rates offered to households and businesses.
An appropriate benchmark reflects actual borrowing costs in the market and enables consistent valuation across financial contracts. These rates affect trillions of dollars in notional value globally.
2.1 Australian interest rate benchmarks
In Australia, there are two main interest rate benchmarks and if fully established Beta SOFIA would become the third:
- BBSW: A credit-sensitive term benchmark used widely in corporate lending and derivatives. As of November 2024, $35 trillion in notional value of futures contracts reference BBSW (ASX 2024). BBSW is administered by the ASX and calculated using a volume-weighted average price (VWAP) methodology based on eligible transactions in prime bank paper. The rate is published for tenors ranging from one to six months, with the 3-month and 6-month tenors accounting for most trading activity. In 2024, the average daily volume in the 3-month tenor was approximately $0.6 billion, and $0.7 billion in the 6-month tenor.[2] In 2018, the BBSW methodology was enhanced to incorporate a transaction-based layer in its calculation waterfall, aligning it with the IOSCO Principles for Financial Benchmarks and recommendations from the Council of Financial Regulators to strengthen the benchmark's robustness and integrity (ASX nd).
- AONIA: An unsecured, nearly risk-free, overnight rate calculated by the Reserve Bank of Australia (RBA) (Bristow and de Roure 2023). AONIA is calculated as the weighted average of the interest rates at which overnight unsecured funds are transacted in the domestic interbank market. In 2024, the underlying value of AONIA-setting transactions was on average $1.3 billion daily (RBA statistical table F1). AONIA is administered by the RBA and serves as the operational target for monetary policy implementation. Contracts referencing AONIA include Australian dollar overnight indexed swaps (OIS) and the ASX's 30-day interbank cash rate futures contract.
- Beta SOFIA: A newly developed secured overnight rate based on general collateral (GC1) repo transactions conducted by Austraclear participants. The rate is currently published in beta version by the ASX. In 2024, the underlying value of SOFIA-setting transactions was, on average, $7 billion daily. Beta SOFIA calculation uses a volume-weighted trimmed mean approach, which excludes the bottom 25 per cent of volume from the yield distribution.[3] SOFIA is not currently designated as a financial benchmark and has not been assessed for compliance with IOSCO Principles for Financial Benchmarks, alignment with these standards would support its future development. SOFIA addresses a gap in repo market infrastructure and transparency.
2.2 International interest rate benchmarks
LIBOR used to be the world's dominant reference rate, underpinning contracts worth over US$200 trillion globally. It was calculated each business day based on submissions from a panel of large banks, which were asked to estimate the rate at which they could borrow funds on an unsecured basis in the interbank market.
This submission-based approach carried inherent risks. Panel banks had strong incentives to manipulate the rate: to benefit their derivatives positions or to improve perceptions of their creditworthiness (Duffie and Stein 2015). Between 2012 and 2015, several major global banks were fined billions of US dollars for colluding to manipulate LIBOR.
Following the global financial crisis, regulatory reforms led to a steep decline in unsecured interbank lending, the market that underpinned LIBOR. On some days, 3-month USD LIBOR was determined by as few as three to eight actual transactions, despite referencing contracts worth trillions of US dollars. This disconnect between the rate-setting market (low volume) and the referencing market (high volume) revealed LIBOR's fragility.
As a result, global regulators – led by the Financial Stability Board (FSB), the Bank for International Settlements (BIS), and IOSCO – coordinated a transition to transaction-based overnight benchmarks, known as ARRs. LIBOR was phased out in stages, with most tenors in British pound, euro, Swiss franc and Japanese yen discontinued from 31 December 2021, and the final US dollar settings ceasing on 30 September 2024. Market participants have since transitioned to these ARRs:
- United States – SOFR: based on secured overnight Treasury repo transactions.
- United Kingdom – SONIA: based on unsecured overnight deposits.
- Euro area – Euro Short-term Rate (€STR): based on unsecured wholesale euro lending.
- Switzerland – Swiss Average Rate Overnight (SARON): based on secured interbank repos.
- Japan – Tokyo Overnight Average Rate (TONAR): based on unsecured overnight interbank rates.
- Canada – Canadian Overnight Repo Rate Average (CORRA): based on secured overnight repo transactions.
2.3 Trade-offs in benchmark design
2.3.1 International evidence on benchmark design trade-offs
The design of financial benchmarks necessarily involves a range of trade-offs. Brugler et al (2025) explore these trade-offs in the context of benchmark reform in five jurisdictions – United States, United Kingdom, euro area, Switzerland and Japan – where ARRs have been introduced to replace LIBOR. Their analysis identifies several key design choices:
- Methodology: survey-based versus trade-based approaches to benchmark construction.
- Underlying market composition: inclusion of only interbank transactions versus a broader pool including wholesale and non-bank counterparties.
- Collateralisation: use of secured versus unsecured transactions.
- Aggregation window: the length of time over which transactions are included in the rate calculation.
- Statistical stabilisation: application of trimming or filtering techniques to mitigate the influence of outliers.
- Treatment of small trades: whether small-value transactions are weighted or excluded entirely.
- Contract-to-market ratio: the relative size of derivative exposures referencing the benchmark versus the volume of underlying transactions, which affects manipulation incentives.
- Multiplicity of benchmarks: whether to maintain a single reference rate or allow for the coexistence of multiple alternatives.
Empirical evidence suggests that robust benchmarks are generally underpinned by deep and liquid markets, consistent with theoretical underpinnings (Duffie and Dworczak 2021). Brugler et al (2025) find that robust benchmarks tend to share certain features: limited scope for manipulation, the use of statistical trimming to reduce noise, and reduced reliance on thin markets with limited transaction depth. However, they argue that no single configuration is optimal across all jurisdictions – benchmark design must be tailored to local market structure and institutional context.
2.3.2 Benchmark design considerations in Australia
Drawing on international experience, several design dimensions are particularly relevant for Australia: the choice of underlying transaction pool, the role of collateralisation, the implementation of statistical stabilisation techniques, the use of expert judgment under low-volume conditions, and the treatment of related-party transactions.
Underlying transaction pool and multi-rate framework
Australia has adopted a multi-rate framework consisting of BBSW and AONIA, with Beta SOFIA being developed as a secured overnight rate that could serve as an additional reference rate in the future. Each is based on distinct transaction types: term unsecured, overnight unsecured, and overnight secured, respectively. This approach allows different segments of the market to choose benchmarks that align with their specific needs. For example, BBSW remains appropriate for contracts requiring credit sensitivity and longer tenors (e.g. 3-month interest rate futures). AONIA is widely used in OIS and other derivatives where minimal credit risk is preferred, reflecting its basis in unsecured overnight cash market transactions. Beta SOFIA's similarity to SOFR (secured, overnight, minimal credit risk) may appeal to participants engaged in international multi-currency swaps involving the US dollar and Australian dollar. While the availability of multiple benchmarks promotes flexibility, it may also lead to fragmentation of liquidity across the referencing markets.
Secured versus unsecured transactions
Beta SOFIA is based on secured repo transactions, which makes it sensitive to volatility in collateral markets. That is, there are many transactions that are motivated for reasons other than raising cash. In contrast, unsecured rates like AONIA may offer more stability but transaction volume tends to be smaller and the group of participants narrower. To manage volatility in secured benchmarks, statistical stabilisation techniques such as trimming are often employed.
Statistical stabilisation (trimming)
Trimming methods that remove extreme observations from the transaction set have been shown to reduce benchmark noise, as in the case of post-reform SONIA since 2018. This is particularly relevant in the repo market, where some transactions may reflect cash settlements from other markets and result in rates that differ materially from prevailing market conditions. While trimming improves the reliability of the benchmark, it also reduces the number of transactions used in the calculation. This presents a trade-off between lowering noise and maintaining sufficient volume to ensure the rate remains representative and less susceptible to manipulation.
Expert judgement and thin markets
Expert judgement may be applied when market liquidity is insufficient for rate calculation. In such cases, expert judgement can improve market efficiency and reduce manipulation risk by allowing the administrator to exclude anomalous transaction days. Depending on the benchmark design, expert judgement may involve administrator discretion or the application of pre-defined rules. For example, the Federal Reserve Bank of New York and the Bank of Canada have discretion to apply expert judgement in the calculation of SOFR and CORRA, respectively. The RBA also applies a pre-established set of rules when the cash rate crosses pre-defined expert judgement thresholds. Nevertheless, excessive reliance on subjective inputs may reduce transparency and distort the benchmark's reflection of actual market conditions. The trade-off between robustness and transparency must therefore be carefully managed.
Related-party transactions and manipulation risk
The IOSCO Principles for Financial Benchmarks only allow for arms-length transactions to be included in the rate calculation (IOSCO 2013). That is, transactions between legally related parties should be excluded from benchmark rates. This is because the inclusion of related-party transactions in benchmark calculations can create opportunities for manipulation. International benchmarks exclude such trades (see Table A1 for details). Moreover, related-party transactions may not be an accurate description of market condition as rates transacted often reflect banks' internal capital markets, which might diverge from current market conditions. At present, it is impossible to perfectly identify related-party transactions in Beta SOFIA and for this reason they are not excluded. This could raise concerns about benchmark integrity when the benchmark is formally launched. The empirical analysis in this paper examines the extent to which the inclusion of related-party transactions contributes to benchmark noise.
3. Data
We use two datasets in our analysis: repo transactions and the daily Beta SOFIA time series data. The first dataset is transaction-level data from the Australian repo market covering the period of Beta SOFIA calculation (4 January 2022 to 31 March 2025), collected by the ASX for clearing purposes. Each transaction record includes the transaction date, settlement date and maturity, buyer and seller identifiers, transaction volume, collateral used, and repo rate, among many other fields. Because our data is based on the ASX's clearing service, buyer and seller identifiers reflect the clearing agents, who may be acting either on their own behalf or on behalf of their clients.
The second dataset is a time series of daily Beta SOFIA rates. Since the transaction-level data underpins the time series published by the ASX, we replicate the construction of Beta SOFIA to generate synthetic SOFIA series for our analysis.[4] This enables us to add time series variables, including noise and liquidity measures.
3.1 Time series data
The time series dataset comprises 803 daily observations and contains daily Beta SOFIA rates and daily measures of market characteristics (e.g. volumes, liquidity, market concentration), computed from transaction-level data. Table 1 presents descriptive statistics on the time series variables and Table A2 defines the variables.
We identify related-party transactions as those in which the same legal entity appears on both the buyer and seller sides of a transaction. A key challenge in measuring related-party activity is that current reporting conventions do not distinguish between transactions executed by clearing agents on their own behalf and those conducted on behalf of clients. As a result, the method may overstate the true number of related-party transactions. The current dataset already includes a flag to reporting dealers to identify whether the transaction is made on own behalf or on client's behalf. However, this field is not mandatory and mostly left blank. Introducing a mandatory requirement to complete this field would enhance the quality and integrity of the data.
| Mean | Standard deviation |
Min | Percentile | Max | |||
|---|---|---|---|---|---|---|---|
| 25th | 50th | 75th | |||||
| Noise (bps) | 0.45 | 0.62 | 0 | 0.15 | 0.34 | 0.56 | 9.67 |
| No of related-party transactions | 8.02 | 7.63 | 0 | 2 | 6 | 12 | 63 |
| Herfindahl-Hirschmann Index (0–1) | 0.033 | 0.3 | 0.1 | 0.023 | 0.029 | 0.036 | 0.505 |
| Bid-ask 3-year (bps) | 1.17 | 0.30 | 0.73 | 0.98 | 1.03 | 1.5 | 3 |
| Hui-Huebel ratio | 0.024 | 0.039 | 0 | 0.011 | 0.018 | 0.025 | 0.884 |
| Amihud ratio | 3.91 | 32.58 | 0 | 0.04 | 0.12 | 0.36 | 857 |
| Market volume (log $) | 22.20 | 0.58 | 15.63 | 21.86 | 22.21 | 22.61 | 23.26 |
| No of trades | 66.22 | 26.46 | 2 | 50 | 59 | 74 | 207 |
| No of counterparties | 24.4 | 4.76 | 2 | 21 | 24 | 28 | 36 |
| Observations | 803 | ||||||
|
Sources: ASX; Authors' calculations: Bloomberg |
|||||||
Based on the current definition, the average number of related-party transactions per day is 8.5, with a maximum of 63. Figure 1 plots the number of related-party transactions over time, and their share of trading volume.
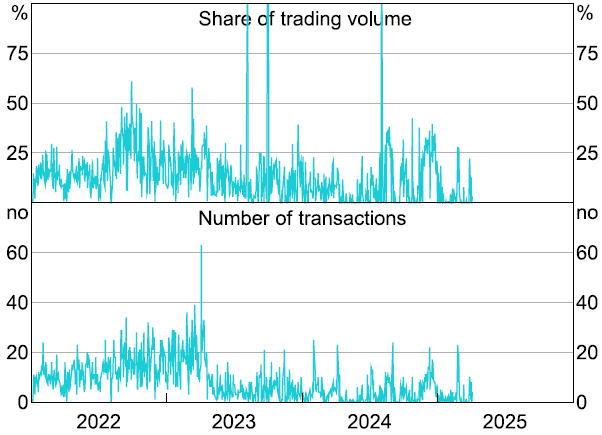
Note: Related party is defined as two affiliates of the same institution.
Sources: ASX; Authors' calculations.
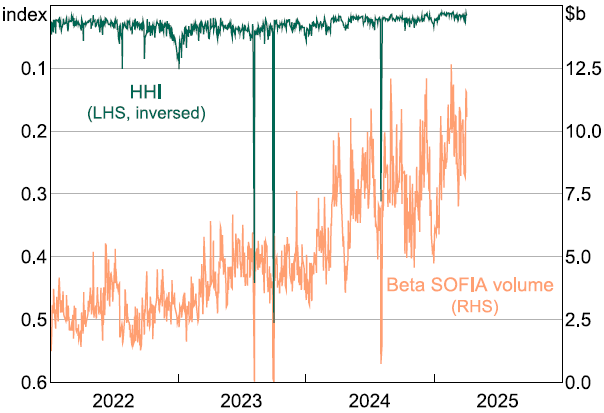
Market concentration is proxied by the Herfindahl-Hirschman Index (HHI), scaled from 0 to 100. Values between 0 and 20 generally indicate a competitive market with many active participants, while higher values reflect increasing concentration (Figure 2). The mean HHI is 0.033, with a minimum of 0.1 (corresponding to 33 counterparties trading on this day) and maximum of 0.505 (when only 2 counterparties were active). Figure 2 overlays the HHI measure with related daily Beta SOFIA volume, using an inverse scale for the HHI. It shows that HHI spikes on days with low transaction volume, suggesting a link between market depth and concentration.
Sources: ASX; Authors' calculations.
Liquidity conditions in the repo market are captured using three proxies: the bid-ask spread on the 3-year Australian government bond (mean = 1.17 basis points)[5], the Hui-Huebel ratio (mean = 0.024), and the Amihud illiquidity ratio (mean = 3.91). Hui-Hebel and Amihud illiquidity ratios measure price movements in relation to market transaction volume, see Table A2 for their empirical definitions. The intuition behind them is that large price movements over small transaction volumes demonstrate illiquidity. The log of total eligible market volume has a mean of 22.2, equivalent to approximately $5 billion, indicating a relatively deep underlying market for Beta SOFIA-setting transactions.
3.2 Transaction-level data
The transaction-level dataset comprises 55,498 observations and contains transaction-level estimates of Beta SOFIA noise and transaction characteristics (e.g. related-party indicators, buyer and seller identifiers, market share of each transaction relative to daily volume, and transaction volume). Table 2 summarises the main transaction-level variables.
| Mean | Standard deviation |
Min | Percentile | Max | |||
|---|---|---|---|---|---|---|---|
| 25th | 50th | 75th | |||||
| Noise (bps) | 1.49 | 2.34 | 0.01 | 0.49 | 0.98 | 1.77 | 298.35 |
| Related-party dummy | 0.117 | 0.321 | 0 | 0 | 0 | 0 | 1 |
| Market share (0–1) | 0.015 | 0.02 | 0 | 0.003 | 0.01 | 0.02 | 0.59 |
| Transaction volume ($m) | 79.1 | 92.2 | 0.0002 | 17.4 | 49.2 | 105 | 1,200 |
| Observations | 55,498 | ||||||
|
Sources: ASX; Authors' calculations. |
|||||||
Related-party transactions account for approximately 11.7 per cent of all repo trades in the sample. While this is a relatively high share, it likely overstates the true extent of related-party activity due to limitations in reporting convention, as discussed previously. Average market share, calculated as the transaction's volume divided by the total Beta SOFIA-eligible market volume on that day, is 1.5 per cent, but this varies substantially across observations, reaching as high as 59 per cent – suggesting that on some days, a single transaction could materially influence the Beta SOFIA rate.[6] The log transaction volume of the first repo leg averages $79 million per trade, and spans a wide range from $2,500 to nearly $1.2 billion.
4. Estimating Noise in Beta SOFIA
Our main goal is to understand how market characteristics and different benchmark construction techniques affect the amount of noise in Beta SOFIA. Noise in the repo market can be understood as transactions that do not reflect current market conditions. A recurrent example is when a repo transaction is part of a larger trade, where the individual transactions may not reflect the current market condition, but together they are meaningful. For example, a cross-currency swap trade that includes a repo trade in the home market, a swap into the foreign currency, a repo trade in the foreign market and a swap back into the home currency. Another example is netted packages, which include a repo transaction in one maturity and a reverse repo in another maturity, such that the participant is long in one maturity and short in another (Hempel et al 2023). In both cases, individual transactions may be treated as noise if considered separately.
To measure noise empirically, we decompose the observed Beta SOFIA rates into information and noise. We use a simple local-level state-space model where the observed benchmark is the sum of an efficient benchmark rate, mt, and a transitory pricing error, st.
Following Menkveld et al (2007), the efficient component is assumed to follow a random walk, implying that innovations to the efficient rate have a permanent effect on its level:
where mt–1 is the efficient rate on day t –1, and wt is information incorporated into the efficient rate on day t. The pricing error, st, is assumed to iid – independent and identically distributed – such that it only affects the current value of Beta SOFIA (and so is transitory by definition). The data-generating process for the observed benchmark rate, yt, is a sum of the efficient rate, mt, the pricing error, st, and control variables, xt, specifically the RBA's cash rate target:
State-space methods allow efficient decomposition of yt into information (wt) and noise (st) while controlling for the cash rate target. As is standard in many state-space applications, both st and wt are assumed to be normally distributed with mean zero and variances and respectively. The assumption of normality allows us to apply a standard Kalman filter to get maximum likelihood estimates of wt and st for each period.
As per Brugler et al (2025), we use the exact diffuse prior for the initial conditions and the L-BFGS algorithm to maximise the log-likelihood function and constrain all variance terms to be no smaller than 10–7. Each model is estimated twice, with maximum iterations of 1,000 and 10,000 respectively, to verify convergence and robustness of the results.
We use the model described in Equations (1) and (2) to extract the daily pricing error term, st, and take its absolute value as our definition of noise, such that noise increases on days with larger (absolute) values of st.
First, we estimate the model on Beta SOFIA calculated using ASX methodology and run time series regressions where the dependent variable is the noise term. The explanatory variables are repo market characteristics such as total volume, liquidity, market concentration, and amount of related-party transactions.
Next, we compare the transaction-level repo rates with the efficient level of Beta SOFIA, as determined by the model. This allows us to construct a transaction-level noise estimate, defined as the absolute difference between the repo rate on a transaction and the efficient rate.
Lastly, we use the underlying transaction data to construct hypothetical SOFIA benchmarks based on different computational rules and compare the aggregate (mean) noise in hypothetical SOFIAs with the published Beta SOFIA. This allows us to assess the benefits of different trimming techniques or criteria for the use of expert judgement.
On average, Beta SOFIA exhibits a daily noise level of 0.45 basis points, with substantial variation across time (standard deviation of 0.62 and a maximum of 9.67 – see row 1 of Table 1). The average transaction-level noise is 1.5 basis points with a standard deviation of 2.34 basis points. While most transactions exhibit small deviations, some extreme outliers persist, with a maximum deviation approaching 300 basis points (see row 1 of Table 2).
4.1 Aggregate determinants of benchmark noise
Our time series analysis allows us to estimate the conditional correlation between benchmark noise and market characteristics at the daily level. After estimating the absolute value of the noise term, st, from the state-space model, we regress it on daily market structure variables. Specifically, we estimate the following regression model:
where Noiset is the absolute value of noise on day t, RelPartyt is the number of related-party transactions on day t, and HHIt is a measure of market concentration, calculated using dollar volumes in the repo market. The vector Controlst includes some market characteristics: transaction volume (measured as log dollar volume of all daily transactions), and liquidity (measured by three variables: Amihud ratio – a measure of the price impact of trades; Hui-Huebel ratio – a measure of the resilience dimension of liquidity; and bid-ask spreads on 3-year government bonds). The error term ut captures any other factors that may influence noise but are not explicitly included in the model.
The regression results in Table 3 suggest that benchmark noise increases with:
- the number of related-party transactions, then is positive; and
- higher market concentration, that is, when trading activity is more concentrated and only a few counterparties are present in the market, then is positive.
| (1) | (2) | (3) | (4) | (5) | (6) | (7) | |
|---|---|---|---|---|---|---|---|
| No of related-party transactions | 0.005** (0.002) |
0.005** (0.002) |
0.004* (0.002) |
0.003 (0.003) |
0.005** (0.002) |
0.007** (0.003) |
|
| HHI | 6.26*** (1.50) |
6.23*** (1.48) |
6.24*** (1.48) |
5.87*** (1.55) |
6.24*** (1.49) |
7.53*** (1.58) |
|
| Bid-ask 3-year | 7.44 (6.82) |
||||||
| Hui-Huebel ratio | 2.82** (1.38) |
||||||
| Amihud ratio | 0.001 0.001 |
||||||
| Market volume | 0.097** (0.048) |
||||||
| Observations | 803 | 803 | 803 | 803 | 803 | 802 | 803 |
| R2 | 0.004 | 0.089 | 0.11 | 0.094 | 0.124 | 0.13 | 0.13 |
|
Notes: ***, ** and * denote statistical significance at the 1, 5 and 10 per cent levels, respectively. Newey-West standard errors with five lags are in parentheses. Sources: ASX; Authors' calculations; Bloomberg. |
|||||||
These findings suggest that related-party transactions and market concentration are detrimental to our measure of benchmark efficiency. To illustrate the effects of related-party transactions on Beta SOFIA, Figure 3 compares Beta SOFIA with a synthetic version constructed by excluding related-party transactions.
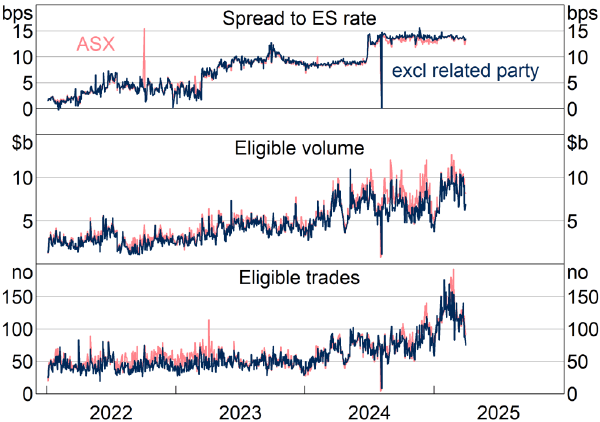
Note: ES rate is the remuneration rate on exchange settlement balances (which are internationally called reserves) banks receive on their excess reserves.
Sources: ASX; Authors' calculations.
4.2 Transaction-level determinants of benchmark noise
In addition to market-level analysis, we examine noise at the transaction level. This more granular approach allows for a richer econometric specification that can control for observed and unobserved characteristics (through fixed effects) of transactions or market-wide effects. We estimate the following regression model:
where Noisei,b,t is the absolute value of noise for the transaction between seller i buyer b on day t. RelPartyDummyi,b,t is the dummy variable taking the value of 1 if seller i and buyer b are related parties, MarketSharei,b,t is the share of dollar volume of this transaction relative to the total dollar volume on day t. Controlsi,b,t is a vector of control variables that includes transaction volume, buyer fixed effects, seller fixed effects, day fixed effects, and collateral-day fixed effects.
The collateral-day fixed effects allow us to compare noise in trades that are executed on the same day and with the same type of collateral. Although all Beta SOFIA-eligible transactions are backed by high-quality liquid assets (HQLA), there are some differences between Australian Government and state government debt securities which could lead to different pricing. For example, for international banks, Australian Government securities qualify as HQLA for liquidity regulation purposes, but state government securities do not. The heterogeneity in the quality of collateral may affect repo pricing and noise. Therefore, in regression specifications with collateral-day fixed effects, we compare noise in transactions within the same collateral class and macro-market conditions, thus reducing omitted variable bias in these regressions.
The results in Table 4 indicate that related-party transactions are associated with higher benchmark noise, consistent with time series analysis. The estimated coefficients for the related-party dummy are positive and significant across all model specifications. This points to the fact that related-party transactions are also detrimental to benchmark efficiency.
| (1) | (2) | (3) | (4) | (5) | (6) | |
|---|---|---|---|---|---|---|
| Related-party dummy | 1.14*** (0.13) |
0.12*** (0.0003) |
1.14*** (0.13) |
0.15*** (0.03) |
||
| Market share | 3.16*** (0.45) |
15.15*** (0.86) |
3.17*** (0.46) |
15.31*** (0.87) |
||
| Transaction volume | –0.03*** (0.004) |
0.07*** (0.006) |
–0.06*** (0.005) |
–0.05*** (0.007) |
–0.06*** (0.005) |
–0.05*** (0.008) |
| Buyer fixed effects | Y | N | Y | N | Y | N |
| Seller fixed effects | Y | N | Y | N | Y | N |
| Day fixed effects | Y | N | Y | N | Y | N |
| Collateral-day fixed effects | N | Y | N | Y | N | Y |
| Observations | 53,153 | 35,661 | 53,153 | 35,661 | 53,153 | 35,661 |
| Within R2 | 0.004 | 0.01 | 0.003 | 0.041 | 0.007 | 0.043 |
|
Notes: ***, ** and * denote statistical significance at the 1, 5 and 10 per cent levels, respectively. Standard errors are in parentheses and clustered on the collateral-day dimension. Sources: ASX; Authors' calculations. |
||||||
Higher market share, that is, concentration, is also associated with increased noise, which reinforces the idea that market dominance can lead to one or several large trades swaying the benchmark rate. In contrast, larger transaction volume is negatively associated with noise, suggesting that smaller trades contribute more to benchmark variability.
Overall, the panel data findings align with our time series results: benchmark noise is elevated in less competitive, more concentrated markets, and in the presence of related-party activity. These results are based on estimates from regressions that compare transactions within the same day (day fixed effects), controlling for different buyers and sellers and within the same day and the same collateral type (collateral-day fixed effects).
4.3 Benchmark design features and noise
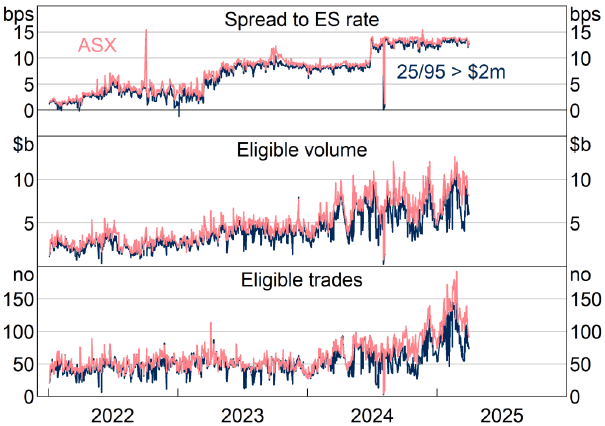
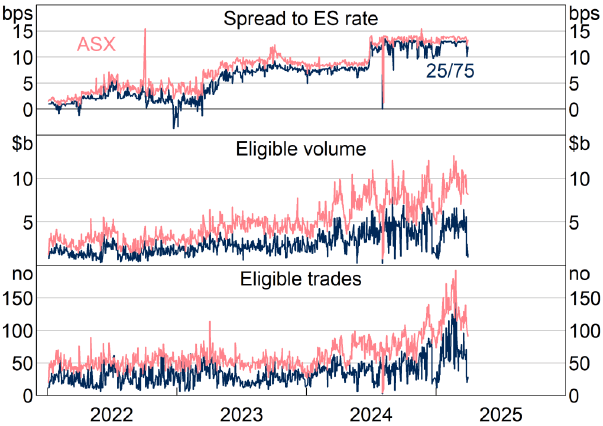
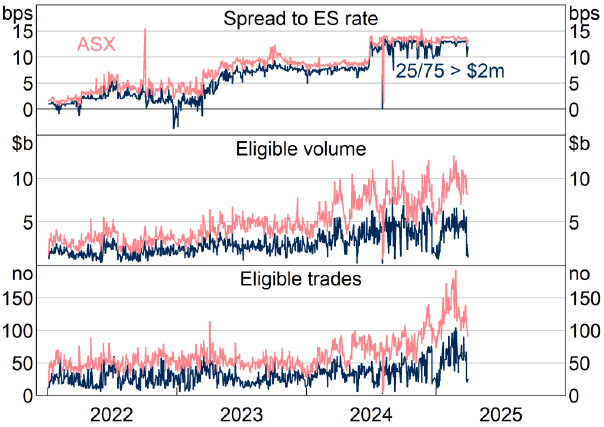
We now explore whether alternative versions of Beta SOFIA could improve benchmark quality. While the 25th percentile trim has been retained, this reflects its distinct purpose of excluding transactions priced below prevailing cash funding rates due to collateral-driven demand, rather than addressing statistical noise. Our focus is therefore on addressing potential noise at the upper end of the rate distribution. Bottom-end trimming is widely adopted across major benchmarks such as SOFR, SONIA, CORRA and €STR, whereas practices around top-end trimming remain less standardised and continue to evolve. Therefore, we focus on different forms to account for noise on the top end of the distribution. To do this we construct several synthetic SOFIAs by (i) adjusting the trimming parameters and (ii) excluding small trades below the threshold of $2 million. Specifically, we test the following synthetic variations:
- 25/95th percentile trimmed mean
- 25/95th percentile trimming, excluding transactions below $2 million
- 25/75th percentile trimmed mean
- 25/75th percentile trimming, excluding transactions below $2 million
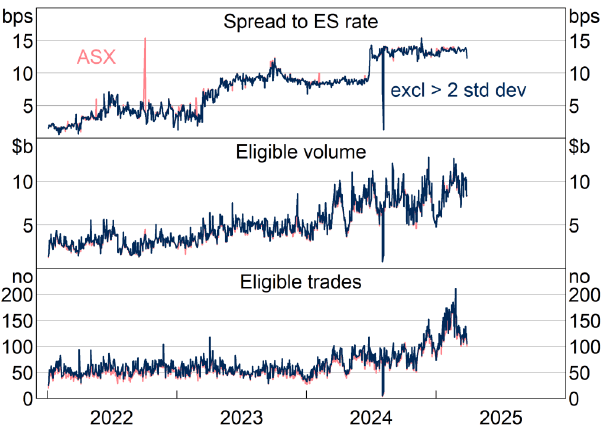
- 25th percentile trimming, excluding transactions with price above mean plus two standard deviations.
After computing each synthetic SOFIA, we estimate a modified version of the state-space model, which compares the synthetic rates' noise to that in actual Beta SOFIA (which employs a trimming approach that excludes the bottom 25 per cent of volume after sorting the rates from lowest to highest).[7] The state-space model assumes that both benchmarks follow a single efficient rate that itself follows a random walk as in Equation (1). Each observed Beta SOFIA variant is the sum of this efficient benchmark and a variant-specific noise term, , which are mean zero, iid normal with variance . The data-generating process for variant is:
where refers to different rates calculated using transaction data from date t. The model for Beta SOFIA and a variant rate can be jointly written in state-space form as:
where yt =(yt,1, yt,2)′, I2 is the 2×2 identity matrix, xt is the RBA cash rate target, is a vector of constants, one of which is normalised to zero, that capture persistent spreads between variants, is a 2×1 vector of pricing errors with distribution and H is a 2×2 diagonal matrix with and on the diagonal elements.[8] We can again employ standard state-space methods to estimate wt and for = 1,2 via maximum likelihood. Estimation details are as per Section 4.1. The variance of the pricing errors, and specifically, their relative magnitudes, are the key outputs of the model. We define the noise share of benchmark as:
A noise share of 50 per cent implies both benchmarks are equally noisy, while less than 50 per cent implies that that the benchmark has lower noise than the alternative.
Table 5 reports the noise share associated with each trimming approach. We find that applying a 25/95th percentile trimmed mean results in a statistically significant reduction in benchmark noise, lowering the noise share from 0.58 in baseline Beta SOFIA to 0.42 in the synthetic version. This corresponds to a reduction of 16 percentage points and is significant at the 1 per cent level (Figure 4). Going a step further and taking small transactions out of the sample (> $2 million) does not result in further improvement (Table 5 and Figure 5). Thus, selecting transactions based on their transaction volume does not deliver a more efficient rate in the Beta SOFIA methodology.
| Beta SOFIA | Synthetic SOFIA | Difference | |
|---|---|---|---|
| 25/95th percentile | 0.58 | 0.42 | 0.16*** |
| 25/95th percentile, > $2million | 0.57 | 0.43 | 0.14*** |
| 25/75th percentile | 0.52 | 0.48 | 0.04 |
| 25/75th percentile, > $2million | 0.52 | 0.48 | 0.04 |
| 25th percentile/mean + 2 std dev | 0.75 | 0.25 | 0.50*** |
|
Notes: Difference tested with Wald test. ***, ** and * denote statistical significance at the 1, 5 and 10 per cent levels, respectively Sources: ASX; Authors' calculations. |
|||
Narrower trimming (25/75) produces more modest noise reduction, with noise shares of 0.52 for baseline Beta SOFIA versus 0.48 for the variant, regardless of trade size threshold. However, the volume reduction is substantial (Figures 6 and 7). Narrower trimming, which reduces the upper bound from the 95th to the 75th percentile while retaining the bottom trim at the 25th percentile, also affects the level of the rate because the distribution is skewed. This raises the question of bias. While the bottom trim primarily removes transactions priced below prevailing cash funding rates due to collateral-driven demand, top-end adjustments aim to reduce noise without distorting the efficient rate. Our results indicate that narrower trims do not provide a less biased estimate of the efficient rate. These differences are not statistically significant.
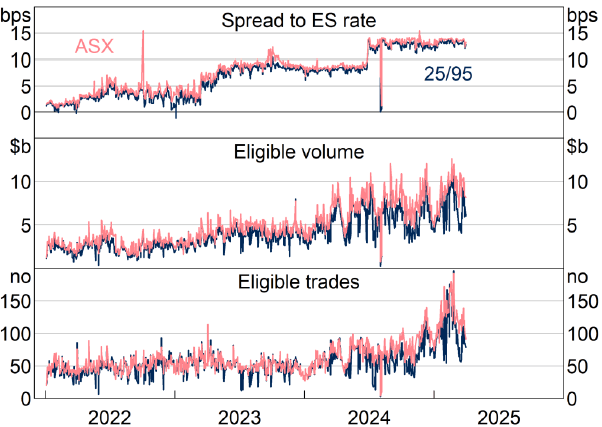
Sources: ASX; Authors' calculations.
Sources: ASX; Authors' calculations.
Sources: ASX; Authors' calculations.
Sources: ASX; Authors' calculations.
As an alternative to percentile trimming, we propose an extreme values trim that excludes all prices above the daily mean plus two standard deviations (Figure 8). This method excludes only 222 observations in total and because these tend to be extreme values the method performs better overall. It corresponds to a noise reduction of about 50 percentage points. Although this methodology performs better statistically it presents some challenges. Because the share of observations excluded in each day changes, this methodology might be perceived as less transparent. To the best of our knowledge, no reference rate trims extreme value observations based on standard deviations. Under the current ASX methodology, this form of trimming is not directly supported, as trimming is applied after sorting the data by price. Accordingly, for this study, the cut-off rate and standard deviation were calculated prior to trimming.
Sources: ASX; Authors' calculations.
Overall, the results suggest that Beta SOFIA can reduce its noise by trimming the top end of the distribution. A trade-off emerges in the implementation of such a trim. On one hand, a small trim at the top (such as the 95th percentile) is easily traceable and follows commonly used strategies. On the other hand, excluding only the observations that are above mean plus two standard deviations reduces noise by a greater amount without loss of too many observations. With these results the administrator can balance out which form a trim in the top end of the distribution can take.
4.4 Expert judgement thresholds
Our analysis in Sections 4.1 to 4.3 suggests that low-volume, low-transaction and high-concentration days tend to be associated with high levels of noise. Therefore, a natural next step is to assess whether there are (and if we can identify them) threshold values of volume, number of participants and number of transactions below which the Beta SOFIA noise spikes. These threshold values are particularly relevant for identifying low-liquidity environments in which the benchmark may require expert judgement.
In our observation window, the days with particularly low transaction volumes are NSW-only public holidays, that is, Labour Day and the Bank Holiday.[9] On these days, settlement occurs but transaction volume is very low because many banks are closed or operating with limited staff. According to communication with the ASX, the administrator will consider only transactions where the second leg of the trade takes place on the business day after the holiday going forward, that is, SOFIA will not be formed on these days. Nevertheless, these days present a useful experiment to understand how noise is related to liquidity and so we conduct our analysis without the ASX's proposed adjustments.
We examine the relationship between transaction volume and noise using binned scatter plots, where each point represents 1 percentile of noise on the y-axis and volume, number of participants or number of transactions on the x-axis (Figure 9). Binned scatter plots only show one observation per value on the x-axis. In this case, the dots shown are the average of different values on the y-axis. The left-hand panels present the full sample, while panels on the right hand zoom in on the bottom 5 percentile of the volume/number of participants/number of trades distribution. A sharp deterioration in benchmark quality is observed once transaction volumes fall below approximately $0.75 billion. Similarly, we observe a sharp increase in noise when the number of market participants is below 6 and when there are fewer than 12 transactions in the market. This nonlinear pattern suggests that noise becomes disproportionately elevated in less liquid market conditions, consistent with theoretical predictions that market depth and participant diversity enhance benchmark robustness.
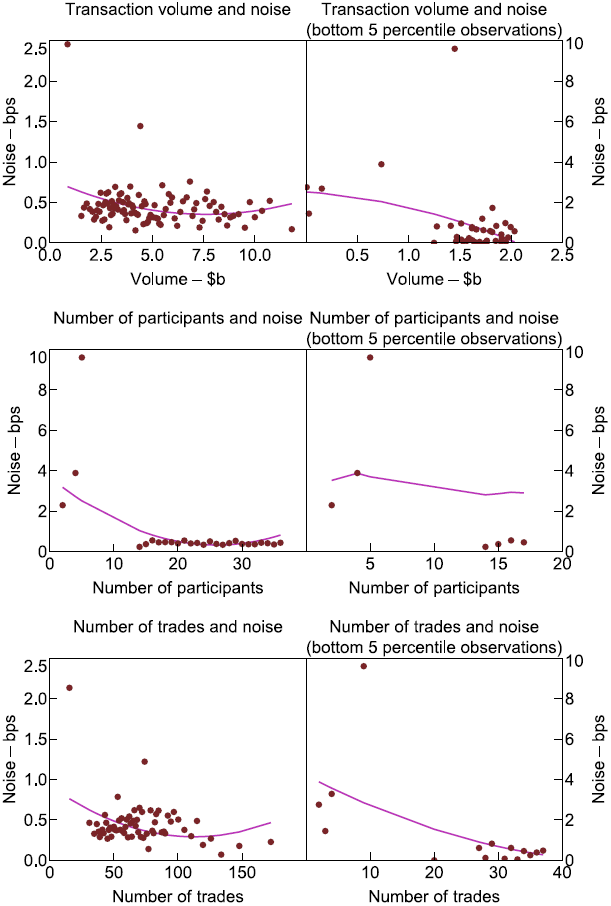
Sources: ASX; Authors' calculations.
To validate this threshold empirically, estimate the following regression:
We define the dummies in the following ways:[10]
- Dummy 1: ≤ $0.1 billion and ≤ 3 trades (2 observations);
- Dummy 2: ≤ $0.5 billion and ≤ 10 trades (3 observations);
- Dummy 3: ≤ $1.2 billion and ≤ 15 trades (4 observations);
- Dummy 4: ≤ $1.5 billion and ≤ 20 trades (5 observations);
- Dummy 5: ≤ $1.5 billion and ≤ 30 trades (6 observations); and
- Dummy 6: ≤ $1.75 billion and ≤ 40 trades (12 observations).
Noiset is the absolute value of noise on day t, log(Volume)t is the natural logarithm of dollar volume of transactions on day t, and the dummy variables are defined at the thresholds of liquidity specified above.
The results in Table 6 suggest that noise is significantly higher on low-volume, low-transaction-number days compared to days with above $1.5 billion volume and 20 trades. The largest marginal increase in noise comes from the transactions in the bucket of $1.2 to $1.5 billion volume and below 20 trades.
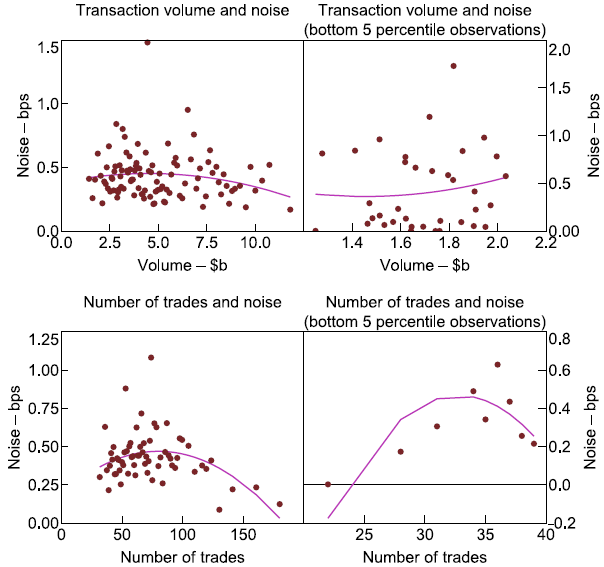
As a robustness check we investigate if the spike in noise shown in Figure 9 is still present once we account for the administrator's new methodology, that is, removing NSW labour days and bank holidays. We find no such spike (see Figure A1). Thus, we conclude that at values higher than the threshold, calculated noise does not seem to spike.
| (1) | (2) | (3) | (4) | (5) | (6) | |
|---|---|---|---|---|---|---|
| log(Volume) | –0.162** (0.082) |
–0.124 (0.079) |
–0.069 (0.049) |
0.069 (0.087) |
0.027 (0.092) |
–0.067 (0.064) |
| Dummy 1 | 0.713 (0.561) |
|||||
| Dummy 2 | 1.235** (0.582) |
|||||
| Dummy 3 | 1.965*** (0.445) |
|||||
| Dummy 4 | 3.899*** (1.432) |
|||||
| Dummy 5 | 3.058** (1.526) |
|||||
| Dummy 6 | 1.320 (0.996) |
|||||
| F-statistic | 10.74 | 12.86 | 11.93 | 4.86 | 5.68 | 7.74 |
| Observations | 803 | 803 | 803 | 803 | 803 | 803 |
|
Notes: ***, ** and * denote statistical significance at the 1, 5 and 10 per cent levels, respectively. Standard deviations are in parentheses. Sources: ASX; Authors' calculations. |
||||||
5. Conclusion
This paper evaluates the determinants of noise in interest rate benchmarks, using Beta SOFIA. We estimate noise in Beta SOFIA at both the daily and transaction levels and identify the market and benchmark design factors that are significantly related to noise.
First, we find that Beta SOFIA exhibits higher noise when trading activity is concentrated, market liquidity is low, or a large share of transactions involve related parties. These conditions amplify the risk that the rate deviates from efficient market pricing, even in the absence of manipulation.
Second, transaction-level regressions confirm that related-party trades systematically contribute more noise than trades between unrelated parties. Similarly, trades that dominate daily volumes (i.e. have high market share) tend to introduce more noise into the rate. In contrast, higher transaction size is associated with reduced noise, suggesting that large trades in deep markets convey more reliable pricing information.
Third, we simulate several benchmark designs by applying alternative trimming techniques and excluding small-value transactions. Among the variants tested, a 25/95th percentile trimming delivers the largest and statistically significant reduction in benchmark noise. This suggests that benchmark precision could be improved through well-calibrated data filtering.
Our findings highlight three key elements that would help support a robust benchmark:
- Make the reporting of related-party transactions mandatory and exclude them from SOFIA calculations to reduce both noise and the potential for manipulation.
- Introduce expert judgement when market trading is thin or highly concentrated, to preserve rate integrity and informational efficiency on illiquid days.
- Consider extending the trimming window (e.g. 25/95th percentile trimming) and applying a minimum trade-size filter to strike a better balance between robustness and representativeness.
The Australian Securities Exchange has already adjusted its SOFIA methodology to reflect most of these findings, in preparation for the potential transition of SOFIA from its beta phase to a live benchmark.
Appendix A: Supplementary Information
| Reference rate | Threshold for expert judgement | Related-party transactions |
|---|---|---|
| BBSW (Australia) | Yes – $100 million, three trades and four counterparties | No |
| AONIA (Australia) | Yes – $500 million, three trades and four counterparties | No |
| SOFR (US) | No | No |
| SONIA (UK) | Yes – the volume of SONIA-eligible transactions is < 70% of the mean of the previous five business days for which SONIA has been calculated in line with the statement of methodology | No |
| €STR (euro area) | Yes – the number of reporting banks is less than twenty; or five banks account for 75% or more of total transaction volumes | No |
| SARON (Switzerland) | No | No |
| TONAR (Japan) | No | No |
| CORRA (Canada) | Yes – if the trimmed volume is below C$3 billion | No |
|
Sources: ASX; Bank of Canada; Bank of England; Bank of Japan; European Central Bank; Federal Reserve Bank of New York; Reserve Bank of Australia; Swiss National Bank. |
||
| Variable | Description |
|---|---|
| Time series | |
| Noise (per cent) | Absolute value of estimated noise term; SOFIA – efficient rate |
| No of related-party transactions | Number of related-party transactions |
| HHI (values between 0 to 100) | Herfindahl-Hirschmann Index; sum of (transaction volume / market volume)2 × 100 |
| Bid-ask 3-year (per cent) | Bid-ask spread of 3-year Australian Government securities |
| Hui-Huebel ratio | Hui-Huebel liquidity ratio; (SOFIAMax – SOFIAMin) / SOFIAVolume |
| Amihud ratio | Absolute value of Amihud illiquidity ratio; ((SOFIA – L.SOFIA) / SOFIAVolume) × 100 |
| Market volume (log) | Sum of all SOFIA-eligible transaction volume |
| Panel data | |
| Noise (per cent) | Absolute value of estimated noise term; transaction rate – efficient rate |
| Related-party dummy | Dummy variable that takes the value 1 if transaction is between related parties |
| Market share (values between 0 and 1) | Transaction volume / total SOFIA-eligible market volume |
| Transaction volume (log) | Log dollar amount of haircut-adjusted transaction size |
Sources: ASX; Authors' calculations.
Appendix B: Why SOFIA Warrants a Higher Expert Judgement Threshold than the BBSW or the Cash Rate
Expert judgement (EJ) is typically applied to a benchmark rate when transaction volume is below a pre-established liquidity threshold. For the cash rate, EJ is triggered if on a given day there are fewer than three transactions, or at least four counterparties, or the total transaction volume is less than $500 million. For the BBSW, the threshold is similar, three transactions by four counterparties, but the volume threshold is lower at $100 million. We are unable to identify a set of principles used to set these EJ thresholds. In our study, we use a criterion based on information efficiency to propose a significantly higher EJ threshold for SOFIA: $0.75 to $1.5 billion, 10 to 20 transactions and 6 to 14 distinct counterparties. During the review process, a referee asked why SOFIA warrants a higher EJ threshold? We provide evidence suggesting that SOFIA-eligible trades have greater price dispersion and for this reason it warrants a higher EJ threshold.
If all markets shared similar characteristics and their EJ thresholds are calculated using the same methodology, we would expect similar levels of EJ across benchmark rates. However, the repo market, which underpins SOFIA, is less information efficient than the cash market (cash rate) or the bank bills market (BBSW). The reason is that the repo market is not solely a market for cash as are the other two, but it is also a market for collateral. That is, some participants engage in the market not to raise cash, but to borrow securities, for example, to facilitate short selling. Moreover, the repo market has a wider set of counterparties, which means greater diversity in trading motives and intentions. In the context of our study, less-information-efficient rates tend to exhibit a higher degree of noise. We define noise as a transitory deviation from the efficient repo rate that subsequently reverses. Based on this, we argue that SOFIA is inherently noisier than its peer benchmark rates and for this reason needs a higher EJ threshold to ensure rate efficiency.
To compare the noise in the three benchmark rates we apply a slightly different concept of noise; here we focus on intraday price disagreement between market participants. While our main empirical strategy estimates noise using local projection, which explores the time series dimension of the data, this exercise uses the cross-section dimension. We define price disagreement as the difference between individual transaction prices and the daily mean price. This is equivalent to calculating the standard deviation (Figure B1). A larger standard deviation indicates that the eligible transactions are taking place further away from the mean, suggesting greater dispersion in pricing.
As predicted, SOFIA-eligible transactions exhibit greater price divergence than BBSW-eligible or cash rate-eligible transactions. Because the tenor of the 3-month BBSW is greater than SOFIA, which only encompasses overnight transactions, its yields tend to be higher. For example, the mean yield between 2022 and 2025:Q1 was 3.40 per cent for BBSW and 3.23 for SOFIA. Based on this yield differential, one might expect BBSW to exhibit greater variance, but this is not supported by the data. The average intraday standard deviation from SOFIA is 2.13 basis points, and from 3-month BBSW is 1.58 basis points. The comparison between the cash rate and SOFIA is more straightforward as both have the same overnight tenor. However, SOFIA consistently displays a higher standard deviation, reinforcing the conclusion that it is the noisier of the two (cash rate standard deviation equals 0.32 basis points).
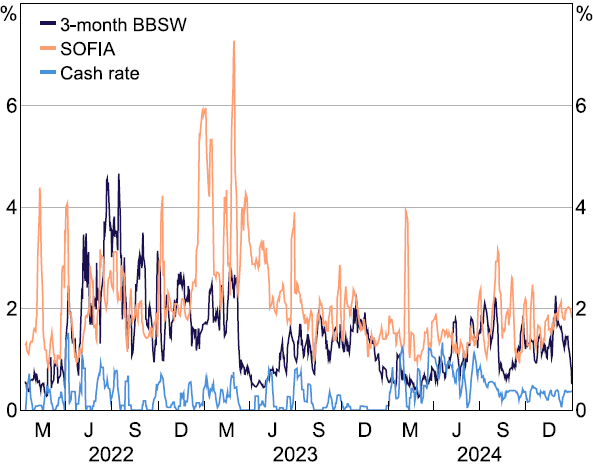
Sources: ASX; Authors' calculations; RBA.
Thus, our conclusion is that SOFIA is noisier than both BBSW and the cash rate. In other words, SOFIA is less information efficient. In our main estimates we show that in days with very low liquidity, SOFIA's noise spikes.[11] Because SOFIA is less information efficient, the cut-off threshold at which noise spikes is higher for SOFIA than for either BBSW or cash rate.
References
ASX (Australian Securities Exchange) (2024), ‘ASX Interest Rate Benchmarks’, Benchmark brochure, November.
ASX (nd), ‘Benchmark Conventions and Calculation Methodologies – BBSW – A Robust Financial Benchmark’, available at <https://www.asx.com.au/connectivity-and-data/information-services/benchmarks/benchmark-data/conventions-and-calculation-methodologies>.
Baillie RT, GG Booth, Y Tse and T Zabotina (2002), ‘Price Discovery and Common Factor Models’, Journal of Financial Markets, 5(3), pp 309-321.
Bristow L and C de Roure (2023), ‘Recent Developments in the Cash Market’, RBA Bulletin, June.
Brogaard J, TH Nguyen, TJ Putniņš and E Wu (2022), ‘What Moves Stock Prices? The Roles of News, Noise, and Information’, The Review of Financial Studies, 35(9), pp 4341–4386.
Brugler J, M Khomyn and T Putniņš (2025), ‘Benchmarking Benchmarks’, Journal of Financial Economics, 168, Article 104018.
Campbell JY and RJ Shiller (1988), ‘The Dividend-Price Ratio and Expectations of Future Dividends and Discount Factors’, The Review of Financial Studies, 1(3), pp 195-228.
Comerton-Forde C and TJ Putniņš (2011a), ‘Measuring Closing Price Manipulation’, Journal of Financial Intermediation, 20(2), pp 135-158.
Comerton-Forde C and TJ Putniņš (2011b), ‘Pricing Accuracy, Liquidity and Trader Behavior with Closing Price Manipulation’, Experimental Economics, 14(1), pp 110-131.
Duffie D and P Dworczak (2021), ‘Robust Benchmark Design’, Journal of Financial Economics, 142(2), pp 775-802.
Duffie D, P Dworczak and H Zhu (2017), ‘Benchmarks in Search Markets’, The Journal of Finance, 72(5), pp 1983-2044.
Duffie D and JC Stein (2015), ‘Reforming LIBOR and Other Financial Market Benchmarks’, The Journal of Economic Perspectives, 29(2), pp 191-212.
Figuerola-Ferretti I and J Gonzalo (2010), ‘Modelling and Measuring Price Discovery in Commodity Markets’, Journal of Econometrics, 158(1), pp 95-107.
Hasbrouck J (1999), ‘The Dynamics of Discrete Bid and Ask Quotes’, The Journal of Finance, 54(6), pp 2109-2142.
Hasbrouck J (2021), ‘Price Discovery in High Resolution’, Journal of Financial Econometrics, 19(3), pp 395-430.
Heitfield EA and Y-H Park (2019), ‘Inferring Term Rates from SOFR Futures Prices’, Board of Governors of the Federal Reserve System Finance and Economics Discussion Series No 2019-014.
Hempel SJ, RJ Kahn, R Mann and M Paddrik (2023), ‘Why Is So Much Repo Not Centrally Cleared’, Office of Financial Research Brief No 23-01.
Hendershott T and AJ Menkveld (2014), ‘Price Pressures’, Journal of Financial Economics, 114(3), pp 405-423.
Indriawan I, F Jiao and Y Tse (2021), ‘The SOFR and the Fed's Influence over Market Interest Rates’, Economics Letters, 209, Article 110095.
IOSCO (The Board of the International Organization of Securities Commission) (2013), ‘Principles for Financial Benchmarks: Final Report', FR07/13.
Klingler S and O Syrstad (2021), ‘Life after LIBOR’, Journal of Financial Economics, 141(2), pp 783-801.
Liu X and Y Bai (2022), ‘Term Risk-free Rates: Methodologies, Challenges, and the Future’, The Journal of Derivatives, 29(3), pp 30-45.
Menkveld AJ, SJ Koopman and A Lucas (2007), ‘Modeling Around-the-clock Price Discovery for Cross-listed Stocks Using State Space Methods’, Journal of Business & Economic Statistics, 25(2), pp 213-225.
Morck R, B Yeung and W Yu (2000), ‘The Information Content of Stock Markets: Why Do Emerging Markets Have Synchronous Stock Price Movements?', Journal of Financial Economics, 58(1-2), pp 215-260.
Putniņš TJ (2013), ‘What Do Price Discovery Metrics Really Measure?’, Journal of Empirical Finance, 23, pp 68-83.
Schrimpf A and V Sushko (2019), ‘Beyond LIBOR: A Primer on the New Reference Rates’, BIS Quarterly Review, March, pp 29-52.
Skov JB and D Skovmand (2021), ‘Dynamic Term Structure Models for SOFR Futures’, The Journal of Futures Markets, 41(10), pp 1520-1544.
Acknowledgements
We thank Claude Lopez, Claudia Seibold, Tom Cusbert, and David Jacobs for their helpful comments and insights. We are also grateful to our external reviewer, Peter O'Neill, for valuable feedback that improved the paper, and to Laurence Bristow for his extensive internal work on SOFIA at the RBA, upon which this work builds. We thank the ASX for the provision of data and for insightful discussions, particularly Allan McGregor. The views expressed in this paper are those of the authors and should not be attributed to the Reserve Bank of Australia. Any errors are the sole responsibility of the authors.
Footnotes
In its current design, SOFIA would not be set in the days analysed because they were holidays, see Section 4.4. [1]
Available at <https://www.asx.com.au/content/dam/asx/benchmarks/asx-interbank-bbsw-daily-volume-report.xlsx>. [2]
Currently, the ASX publishes Beta SOFIA in two forms: volume-weighted trimmed mean and median. Going forward, the ASX is only considering the volume-weighted trimmed mean approach. [3]
There are minor differences in the number of eligible trades and volume. To ensure our results are consistent we use the replicated version of Beta SOFIA in our analysis. [4]
We use the bid-ask in the sovereign bond market as a proxy to the bid-ask spread in the repo market. [5]
Expert judgement is useful on days of high market share concentration and low transaction volume. [6]
We also tested no trim SOFIA and bottom 40th percentile trim. Both were less efficient than the 25th percentile trim. [7]
For example, if one variant excludes the top 5 per cent of transactions by repo rate, it will have a positive average spread on another variant that is computed otherwise identically. [8]
In Australia, public holidays on one state may not necessarily occur on the same date as in other states. [9]
In parentheses, we describe the number of observations each dummy variable has equal to one. [10]
Low liquidity days in SOFIA were mainly due to state-specific holiday in the periods. Although our prior is that this would not affect the price mechanism, this is an important caveat. [11]