RDP 2023-01: The Effect of Credit Constraints on Housing Prices: (Further) Evidence from a Survey Experiment 6. Market Segments and Aggregation
January 2023
- Download the Paper 1.55MB
In aggregate there is a clear relationship between the size of a household's response to loosening collateral constraints and its position on the demand curve. The large responses that drive up the average are typically from households with low WTPs that have no bearing on the market price. In practice, this aggregate market does not exist so it is worth considering whether it is a reasonable reflection of any given housing market. Disaggregating the data also shows how collateral constraints can have different effects in different housing markets.
A possible concern is that by aggregating the data I am obscuring different market outcomes in different housing market segments. For example, there could be some segments in which the marginal buyer is constrained and responds strongly to credit constraints compared to the average response in that segment. If that were the case, there would be no guarantee that the marginal buyers in those segments would have much influence over the estimate of the marginal buyer in aggregate. Looking at more disaggregated data suggests that different market segments do differ in their responsiveness to collateral constraints. However, the pattern observed at the aggregate level is also evident at disaggregated levels. Within every segment I analyse, the change in the marginal buyer's WTP is less than the average change.
The value of a home is one important dimension of market segmentation. This was a focus of Landvoigt et al (2015), which found that in response to an easing of credit conditions, the prices of cheaper homes increased by more than the prices of more expensive ones. The structure of the model in Landvoigt et al (2015) makes all households marginal by assumption, even though they find that constraints appear to bind differentially for households with similar housing demand. For example, a young household with a high income and low wealth may target similar housing to an older household with higher wealth and less binding constraints.
To examine market segmentation by home value, I look at each quintile of home values separately. Table 2 shows that households in the lower quintiles of homes are more commonly renters and tend to have less available equity as a proportion of their home value. Conversely, age and normalised WTP in the 20 per cent down payment condition are similar across quintiles.
| Value quintile |
Mean | Median | ||||||
|---|---|---|---|---|---|---|---|---|
| Home value (US$′000) | Age | Normalised log(WTP20)(a) | Equity available(b) | Normalised log(WTP20)(a) | Equity available(b) | |||
| 1 | 72 | 46 | −0.35 | 0.91 | −0.16 | 0.19 | ||
| 2 | 135 | 47 | −0.42 | 1.11 | −0.11 | 0.51 | ||
| 3 | 188 | 45 | −0.27 | 0.80 | −0.12 | 0.40 | ||
| 4 | 284 | 50 | −0.47 | 0.94 | −0.15 | 0.60 | ||
| 5 | 538 | 50 | −0.51 | 1.08 | −0.21 | 0.90 | ||
| Total | 236 | 48 | −0.40 | 0.96 | −0.15 | 0.48 | ||
|
Notes: (a) Log of WTP with 20 per cent down payment divided by home value. Sources: Author's calculations; Fuster and Zafar (2021) |
||||||||
To look at the effects of this household heterogeneity, I calculate the average WTP change and the change in the marginal buyer's WTP, treating each quintile as a market segment and using the same method as above to estimate the change in the marginal buyer's WTP. Figure 5 shows my results in comparison to the average price response in each quintile as reported in Landvoigt et al (2015). In both sets of results the lower quintiles are more responsive to easier credit conditions. In my results, however, there is also heterogeneity within each quintile that means the change in the marginal buyer's WTP is less than the average change. There is much more heterogeneity in the effect of the collateral constraint than the mortgage rate, both within and between quintiles. Lower heterogeneity for the mortgage rate response is consistent with the lack of systematic variation in the response of WTPs to the mortgage rate in the aggregate demand curve analysis.
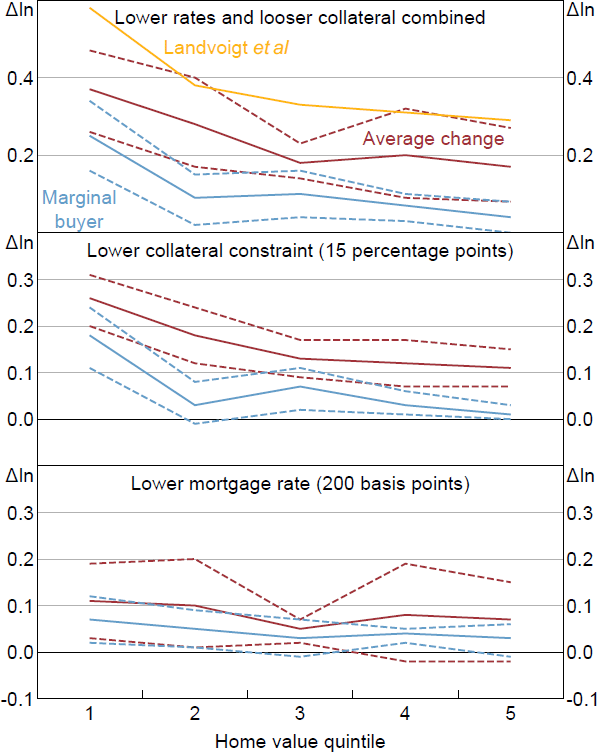
Note: Dashed lines represent 95 per cent confidence intervals.
Sources: Author's calculations; Landvoigt, Piazzesi and Schneider (2015, Figure 10 panel B)
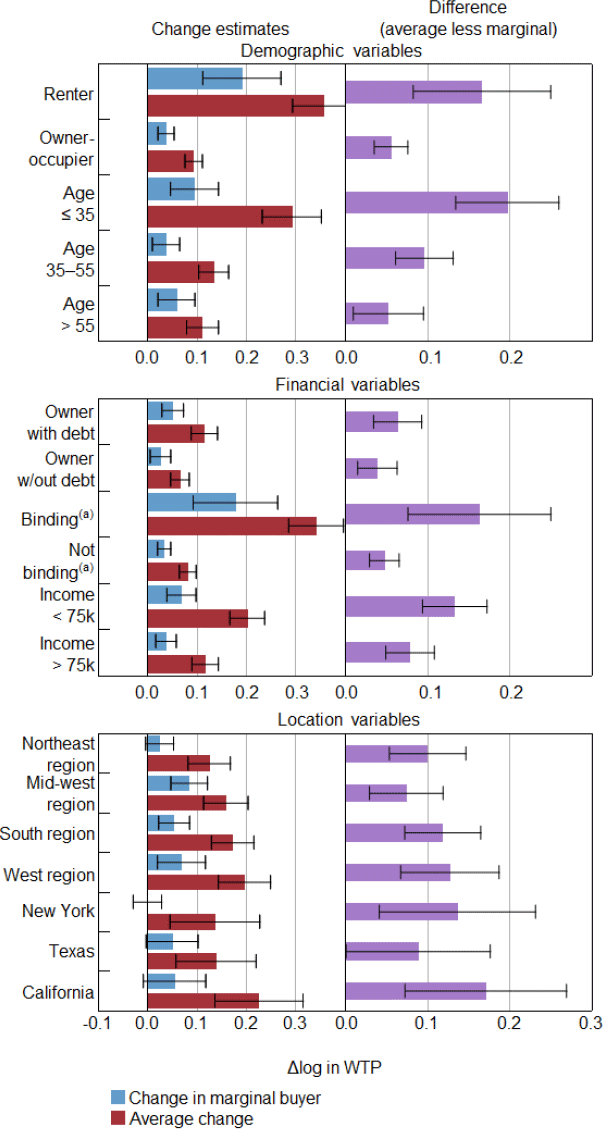
There are many other demographic, location and financial variables that could be important factors in market segmentation, although they are less likely to map to a literal housing market (Figure 6). Analysing subsamples separately weakens the aggregation assumptions required for the main results, although the smaller sample sizes increases the width of the confidence intervals. Overall, the point estimate of the change in the marginal buyer's WTP is smaller than the average change in all segments examined, and the 95 per cent bootstrapped confidence interval for the difference between the two does not contain zero in any segment. For segments in which the average effect is relatively low, the differences between the two methods tend to be small.
Notes:
Whiskers show 95 per cent confidence intervals.
(a) A down payment is binding if the household's wealth available for a deposit is less than 20 per cent of the home value.
Most segments either display a non-parallel shift in demand, with bigger shifts at the lower end, or very little shift in the demand curve. The first pattern is seen in segments where constraints are more likely to bind, like a segment of younger households (Figure 7, left panels). Average effects are large and the change in the marginal buyer is significantly lower. The second pattern is seen in segments where constraints are unlikely to bind, like homeowners with no debt (Figure 7, right panels). Average effects are small and the change in the marginal buyer WTPs are even smaller.
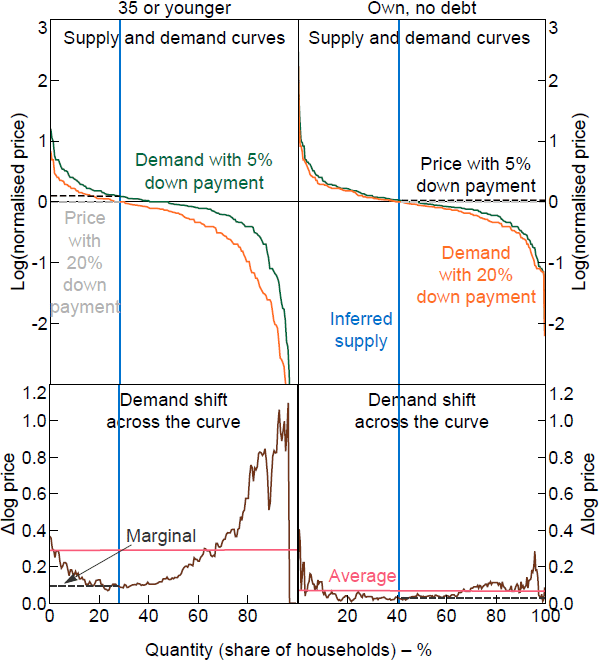
Note: The normalised price is relative to the home value given in the survey data.
Sources: Author's calculations; Fuster and Zafar (2021)