RDP 2023-01: The Effect of Credit Constraints on Housing Prices: (Further) Evidence from a Survey Experiment Appendix B: Robustness
January 2023
- Download the Paper 1.55MB
B.1 Calculating confidence intervals
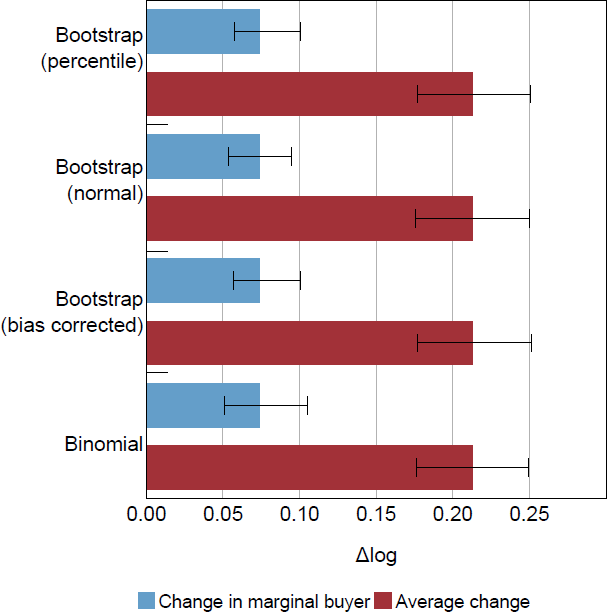
Demand curve analysis using the empirical cumulative distribution functions (CDFs) requires non-parametric calculation of confidence intervals. The main results presented in this paper use bias-corrected confidence intervals generated from bootstrapping. I resample the data repeatedly and calculate the mean change in WTP and the marginal buyer change in WTP each time. I also calculate the difference between the two in each bootstrap iteration to estimate its confidence interval because the mean WTP change and marginal buyer WTP change are likely to be correlated within an iteration of the bootstrap. Figure B1 shows that using percentile, normal or bias corrected confidence intervals gives very similar results.
The confidence intervals for the demand curve analysis estimate can also be calculated using the binomial distribution in a similar way to the non-parametric estimation of a median. This method gives very similar results to the bootstrap (Figure B1). The procedure to estimate the change in the marginal buyer has two stages, and the binomial method can be used for each stage. The first stage is to estimate the percentile of the demand curve that intersects the appraisal price. The second is to estimate the (relative) WTP of that percentile on the shifted demand curve.
B.1.1 Binomial method of confidence intervals
Denote the true underlying CDFs of the WTPs with a 20 per cent down payment F20(x). The first stage of the procedure is to estimate the percentile F20(0), noting that zero is the log of the ratio of relative WTP equal to the appraisal. The binomial confidence interval procedure works using the logic that whether or not a given WTP is higher than this level has probability F20(0). A binomial distribution with success probability F20(0) and the number of trials given by the number of WTPs can then map out a confidence interval for the estimate of the percentile (0). A similar method can be used for the second stage to construct a confidence interval for the WTP at the estimated percentile of the other demand curve, and the two are combined for the overall confidence interval.
In more detail:
The object of interest for the first stage in the marginal buyer procedure is the value of the underlying CDF at F20(0). I will call the point estimate The goal is to get a lower and upper bound (pL and pU) consistent with a level of significance .
To construct the lower bound of the confidence interval, I find the smallest pL such that is not rejected. Let S equal the number of WTPs < 0 and n equal the total sample size of WTPs. Under the null, S is the test statistic, and it follows a binomial distribution based on the success probability pL and sample size n, i.e. S ~ B(n, pL). The null is rejected if the CDF of the binomial is less than the level of significance: BCDF(S, (n, pL)) < . So for the lower bound this binds with equality.
Similarly the upper bound is given by ( 1 – BCDF(S, (m, pU)) ) = .
The second stage of the procedure is a similar process in reverse. For the purposes of this stage I will take the estimate from the first stage as a true parameter, p. The goal is then to estimate the upper and lower bounds on the WTP given by . The point estimate for this is .
Now the relevant null hypothesis for the lower bound is H0 : WTPL = . We know the relevant binomial distribution has success probability p and sample size n. To test H0 count the WTPs < WTPL, and call that number T. Then reject if BCDF (T, (n, p)) The lower bound is given by WTPL that corresponds to the T where this holds with equality.
Similarly, the upper bound is given by the Tth WTP where (1 – BCDF(T, (n, p))) =
To combine the two steps into a confidence interval of size for the whole process I construct a confidence interval for the first stage using a level of significance of . I then do the second stage on the upper and lower bounds of that confidence interval again with level of significance The resulting lower confidence bound from the lower input percentile and upper confidence bound from the upper input percentile form the appropriate confidence interval.
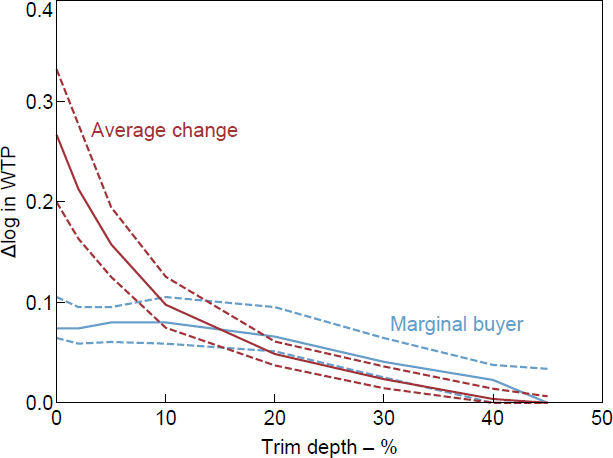
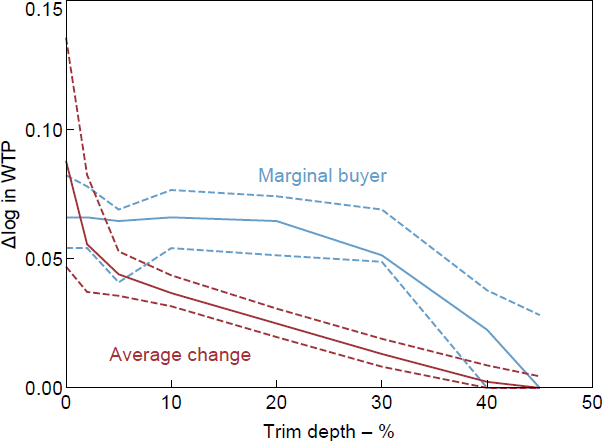
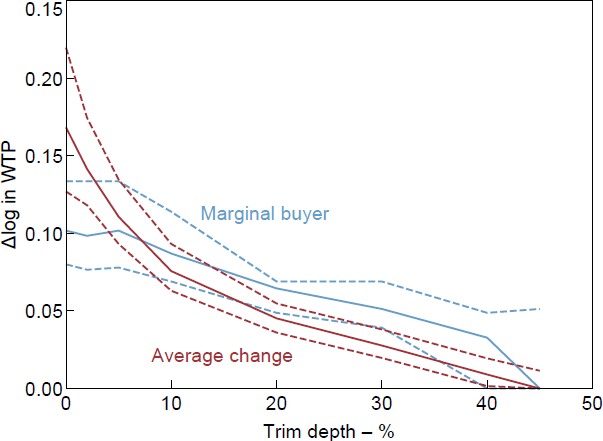
There is substantial skew in the data, with a median change of zero. The range of average changes over different trim depths is very large and it is hard to recommend one in particular. The change in WTP of the marginal buyer is much less sensitive to the trim depth, being pretty consistent from no trimming up to a 30 per cent trim (see Figures B2–B4).
Note:
Dashed lines represent 95 per cent confidence intervals.
Note:
Dashed lines represent 95 per cent confidence intervals.
Note:
Dashed lines represent 95 per cent confidence intervals.
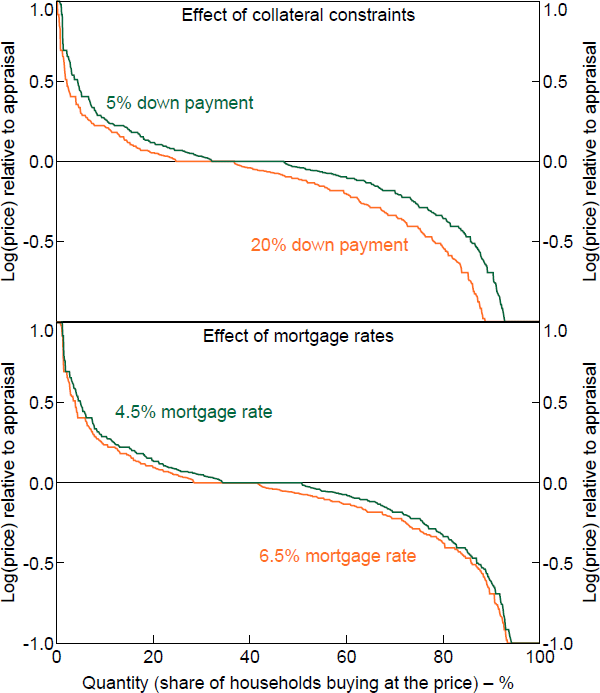
A WTP equal to the appraisal value creates a flat demand curve, which makes it hard to interpret changes (Figure B5). For robustness, I try five different exclusion methods for each of the three experimental conditions, which I explain below.
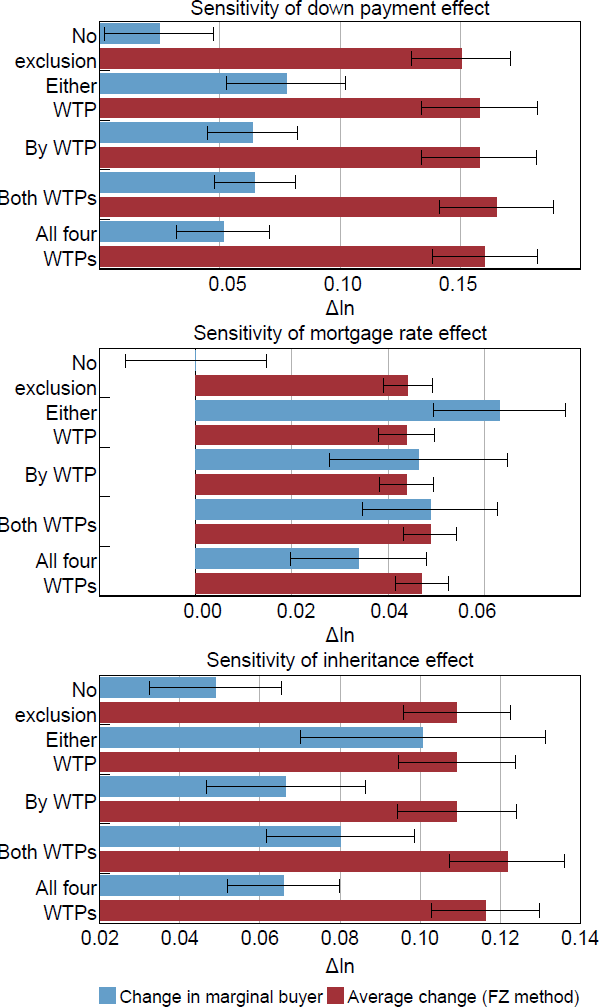
The five methods I use in order from least exclusion to most exclusion are as follows. If there is still a flat area of the demand curve after exclusion, I assume the supply curve is in the middle of it.
Figure B6 shows the results of the five different methods. The results of the down payment experiment are insensitive to the exclusion method. Small changes to the demand curve and the marginal buyer do not change the overall picture. For all methods, the marginal buyer method is significantly less than the mean change, and there are no significant differences between the estimates of each effect by the five methods. In contrast, the results of the mortgage rate do vary significantly depending on the exclusion method. The lack of systematic relationship between the shift size and the position on the demand curve means small changes can have noticeable effects on the marginal buyer. The sensitivity of the inheritance experiment is somewhere in between.
Note:
Whiskers show 95 per cent confidence intervals.
B.2 How much to trim?
B.3 Sensitivity of the results to treatment of WTPs equal to appraisal