RDP 2021-07: Macroprudential Limits on Mortgage Products: The Australian Experience 5. Policy Effects of the Investor Limit
July 2021
- Download the Paper 2,356KB
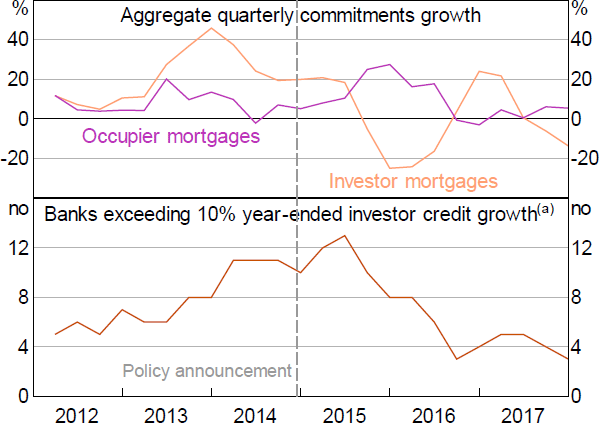
The investor mortgage limit, announced in December 2014, limited banks' growth in investor housing credit to 10 per cent per annum. Other regulatory reports document that the limit took time to implement (e.g. APRA 2019b), as APRA worked with banks to clarify their obligations (as noted in Section 2.1) and banks worked on improving their systems for implementing the policy. Contacts tell us that banks also initially faced some confusion over the definition of the limit, for example, about how to treat pre-existing investor credit that was being reclassified as occupier credit (analysed in Section 7.3), or whether the limit applied to raw or seasonally adjusted credit growth figures. A delay between the policy announcement and its effect is indeed evident in the aggregate data (Figure 2). Aggregate investor commitments growth remains flat in 2015:Q1 and Q2, then declines sharply in 2015:Q3 and Q4 alongside a pick-up in occupier commitments growth (top panel). The number of banks above the limit picks up in 2015:Q1 and Q2, but, from 2015:Q3 onward, steadily declines towards zero (bottom panel).
Notes:
The number of banks in the sample varies slightly across periods but is constant from 2014:Q3 to 2017:Q4
(a) May not perfectly align with APRA's assessment of banks meeting the limit
Sources: APRA; Authors' calculations
5.1 Average effects on mortgage commitments
In the full sample of banks, the policy effect on targeted mortgages is negative, large and statistically significant in 2015:Q3 and Q4 (Table 2, column (a)). The coefficients imply a decline in investor commitments growth of 51 percentage points across these 2 quarters, for the average bank.[12] There are no significant policy effects in the first 2 quarters, in line with the aggregate data (Figure 2), implying a 2-quarter delay from the policy announcement on average. Non-targeted mortgages increase by a statistically insignificant and small amount (column (b)), which implies that the estimated investor policy effects in column (a) are not mistakenly picking up trends in aggregate housing credit. Total mortgage commitments for the average bank are not significantly affected (column (c)). Therefore, the large reduction in investor commitments growth is mostly offset by the small pick-up in occupier commitments growth.
| Sample banks: |
(a) | (b) | (c) | (d) | (e) | (f) | (g) | (h) | (i) | ||
|---|---|---|---|---|---|---|---|---|---|---|---|
| All | Large | Mid-sized | |||||||||
| Mortgage type: | Investor | Occupier | Total | Investor | Occupier | Total | Investor | Occupier | Total | ||
| 𝕀(Q1–15) | –0.058 (0.052) |
0.024 (0.039) |
0.015 (0.039) |
−0.025** (0.011) |
−0.008 (0.011) |
−0.008 (0.007) |
−0.070 (0.062) |
0.029 (0.047) |
0.019 (0.047) |
||
| 𝕀(Q2–15) | −0.051 (0.070) |
0.005 (0.056) |
−0.013 (0.056) |
−0.059 (0.072) |
0.020 (0.071) |
0.003 (0.072) |
−0.031 (0.085) |
0.002 (0.067) |
−0.010 (0.066) |
||
| 𝕀(Q3–15) | −0.235*** (0.072) |
0.029 (0.054) |
−0.061 (0.049) |
−0.236*** (0.032) |
0.144* (0.086) |
−0.025 (0.051) |
−0.241*** (0.089) |
−0.005 (0.060) |
−0.072 (0.057) |
||
| 𝕀(Q4–15) | −0.337*** (0.094) |
0.024 (0.057) |
−0.080 (0.049) |
−0.025 (0.051) |
0.096** (0.044) |
0.055 (0.036) |
−0.423*** (0.108) |
0.002 (0.069) |
−0.116** (0.057) |
||
| Lagged DVs | 2 | 2 | 2 | 2 | 2 | 2 | 2 | 2 | 2 | ||
| Controls | yes | yes | yes | yes | yes | yes | yes | yes | yes | ||
| Sample size | 686 | 686 | 686 | 168 | 168 | 168 | 518 | 518 | 518 | ||
| Notes: Coefficients from panel regressions, across banks and quarters, of commitments growth on 4 lags of the bank-invariant policy indicator variable. The full equation is in first differences, using Arellano–Bond, with 2 lagged dependent variables (DVs) to eliminate second order autocorrelation. The control variables are GDP growth, housing price growth, lagged tier 1 capital ratios, lagged deposit funding ratios and a set of seasonal dummy variables. ***, ** and * denote statistical significance at the 1, 5 and 10 per cent levels, respectively. | |||||||||||
The full sample estimates mask sizeable differences in reactions between large and mid-sized banks. Most notably, large banks substitute into non-targeted mortgages while mid-sized banks do not. Large banks' substitution into occupier commitments (column (e)) offsets their investor commitments growth decline, leaving no significant change in total mortgage commitments (column (f)). Mid-sized banks do not increase occupier commitments growth (column (h)), leaving a statistically significant net decline in total commitments growth of 12 percentage points (column (i)). The reason for this difference in substitution behaviour is not entirely clear, but it is plausible that large banks' operational systems were more capable of implementing a portfolio shift. The full sample estimates for occupier and total commitments show little policy effect (columns (b) and (c)) because large banks' expansions and mid-sized banks' contractions are netted against each other.
Large banks' substitution from investor to occupier credit is consistent with the ‘portfolio choice channel’ theory by Acharya et al (2020). The theory posits that, in general, banks leave some credit demand unmet because they face balance sheet constraints on their credit supply, such as regulatory capital and liquidity requirements. This leaves banks with capability to shift their credit portfolios toward a different customer segment, because potential customers with unmet demand are always available in that segment. Another possible explanation for the substitution is that the reduction in investor credit ‘made room’ for a pick-up in occupier demand. This could occur if a decline in investor activity caused lower housing price growth, which in turn expanded the number of occupiers that could afford to buy. Indeed, housing price growth declined in 2015:Q3 and Q4 – see Figure 1 and Section 5.4.2.
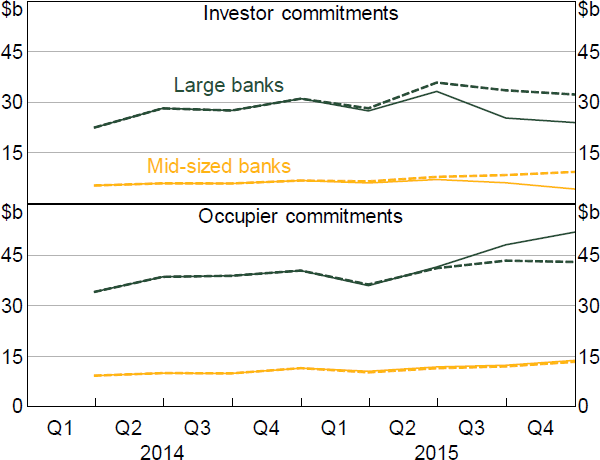
To contextualise the estimated effects, we plot observed total commitments against counterfactual estimates of what would have occurred without the policy (Figure 3), constructed using the coefficients in Table 2.[13] In the quarters before the policy, observed investor commitments steadily rise, fluctuating with seasonal patterns. The policy effects are then visible in the observed series, which drops lower than usual in 2015:Q3 and Q4. The counterfactuals suggest commitments would have been relatively flat absent the policy. The plot also demonstrates the different Q4 outcomes for large and mid-sized banks. For large banks, the total Q4 pick-up in occupier commitments roughly offsets the decline in investor commitments (both around $4 billion), while for mid-sized banks, only investor commitments are affected.
Sources: APRA; Authors' calculations
5.2 Average effects on advertised interest rates
Banks lifted interest rates on investor mortgages in 2015:Q3 (Table 3), the same quarter that investor commitments declined (Section 5.1).[14] In this quarter, large and mid-sized banks raised the spread between investor and occupier mortgage rates by around 10 basis points, by increasing investor rates.[15] RBA (2018) notes that this was the first time that banks systematically price differentiated these products, which is consistent with the aggregate data in Figure 1. Other regulatory reports explain that, after the policy was announced, banks first tried meeting the policy limit by imposing internal limits on loan-application acceptances, and resorted to interest rate increases when the internal limits did not suffice (ACCC 2018a; APRA 2019b).
| Sample banks: |
(a) | (b) | (c) | (d) | (e) | (f) | |
|---|---|---|---|---|---|---|---|
| Large | Mid-sized | ||||||
| Dependent variable: | Investor | Occupier | Spread | Investor | Occupier | Spread | |
| 𝕀(Q1–15) | −0.085** (0.033) |
−0.044 (0.031) |
−0.041 (0.026) |
−0.095*** (0.023) |
−0.088*** (0.020) |
−0.008 (0.026) |
|
| 𝕀(Q2–15) | 0.022 (0.040) |
−0.030 (0.045) |
0.052* (0.028) |
−0.059* (0.034) |
−0.017 (0.019) |
−0.045* (0.026) |
|
| 𝕀(Q3–15) | 0.128*** (0.024) |
0.020 (0.025) |
0.107*** (0.017) |
0.134*** (0.024) |
0.042 (0.033) |
0.095*** (0.020) |
|
| 𝕀(Q4–15) | 0.112*** (0.024) |
0.122*** (0.026) |
−0.010 (0.017) |
0.089*** (0.016) |
0.030* (0.017) |
0.057*** (0.014) |
|
| Fixed effects | Bank | Bank | Bank | Bank | Bank | Bank | |
| Other controls | yes | yes | yes | yes | yes | yes | |
| R squared | 0.241 | 0.295 | 0.098 | 0.157 | 0.280 | 0.108 | |
| Sample | 164 | 164 | 164 | 648 | 666 | 647 | |
|
Notes: Coefficients from panel regressions, across banks and quarters, of change in advertised mortgage rates on 4 lags of the bank-invariant policy indicator variable. The control variables are GDP growth, housing price growth, lagged tier 1 capital ratios, lagged deposit funding ratios and a set of seasonal dummy variables. The regressions include bank fixed effects. Standard errors are clustered at the quarter level for the large bank regressions, and at the bank and quarter levels for the mid-sized bank regressions. ***, ** and * denote statistical significance at the 1, 5 and 10 per cent levels, respectively. |
|||||||
The rate increases are not neatly aligned with the reactions in commitments reported in Section 5.1. The policy-induced rate rises are supply-side driven, rather than caused by a change in credit demand, so we would expect a negative relationship between changes in interest rates and commitments growth. That is, the banks that raise rates most should experience the largest proportional reduction in customers. This holds true in aggregate – investor rates rise and investor commitments growth falls – but not across the cross-section. For example, in 2015:Q4, investor commitments growth falls heavily for mid-sized banks but not for large banks, despite large banks lifting investor rates by 2 basis points more.[16]
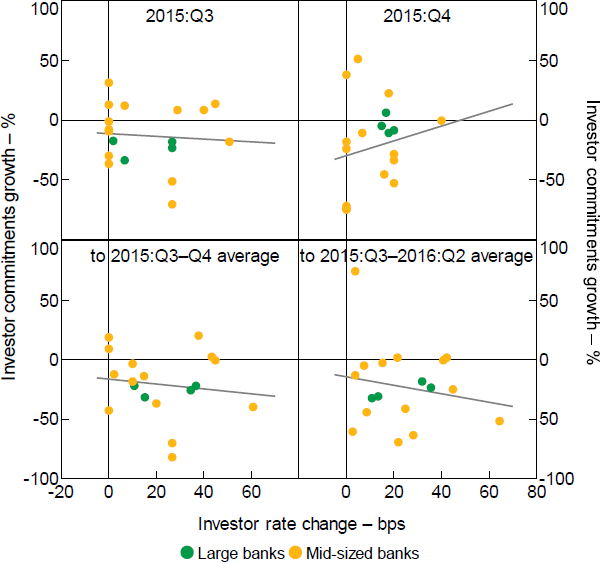
These irregular price–quantity relationships warrant further exploration. We hone in on 2015:Q3 and Q4, and plot each bank's investor commitments growth against its change in investor rates (Figure 4). We also acknowledge that commitments may not co-move tightly with rate changes over short periods, but that banks with consistently lower rates should experience more commitments growth over time. To achieve this, the plots show commitments growth from the level in 2015:Q2 to the average across the next 6 or 12 months (Figure 4, bottom panels). The rate changes are averaged the same way.
Bottom panels: from 2015:Q2 to (subsequent averages)
Notes: Rates are advertised rates, as described in Section 3.2; fitted lines are from OLS on plotted observations
Sources: APRA; Authors' calculations; Canstar
The plots indeed reveal counterintuitive price–quantity relationships across banks, but which become more intuitive at longer time horizons. In 2015:Q3, some mid-sized banks experience investor commitments growth of around –40 per cent without having lowered investor rates, and others experience positive growth after raising rates by around 40 to 50 bps. This is more extreme in Q4: some experience investor commitments growth of around –70 per cent without having lowered investor rates, and overall, banks with larger rate rises experience more commitments growth (i.e. the upward sloping fitted line in the top right panel). The erratic patterns in 2015:Q4 partly wash out at lower frequencies – the bottom panels of Figure 4 show a negative relationship between rates and commitments.
The counterintuitive relationships likely reflect a shake-up from the policy-induced credit reallocation. For mid-sized banks, the customer spillover from large banks shifting their far larger portfolios likely exceeded any typical fluctuations in demand. APRA (2019b, p 11) writes
… APRA did observe this spillover effect to some degree when the benchmarks were initially introduced. As it was, many smaller ADIs found themselves with an unanticipated surge in demand for credit that in some cases was difficult to manage. APRA sought to address concerns about impacts on smaller ADIs' ability to compete by adopting a more flexible approach to application of the benchmarks in the early stages …
Indeed, some banks reportedly reacted by temporarily stopping investor lending completely (PC 2018). We are told by contacts that these effects were also compounded by the role of mortgage brokers. That is, brokers would sometimes direct all their customers to the single bank with lowest rates, potentially a mid-sized bank that had been slower to raise its rates than other banks.
Our findings are consistent with these reports. For example, the reported spillover effects could explain why, in 2015:Q3, some mid-sized banks have positive commitments growth while lifting rates by around 30 to 50 basis points (Figure 4, top left panel). Further, the largest Q4 declines in investor commitments growth (Figure 4, top right panel) – which are not accompanied by rate rises – are consistent with some mid-sized banks temporarily stopping investor lending. Removing those observations would indeed leave a more intuitive negative relationship between prices and quantities. Furthermore, the role of mortgage brokers mentioned above would likely wash out at longer time horizons, as banks that are slower to move rates then catch up, and demand reacts accordingly. Consistent with this, the price–quantity relationships in Figure 4 are more negative for the longer time horizons (i.e. the bottom panels).
5.3 Heterogeneous effects
Specification (3) identifies the policy effect by estimating the difference in responses between banks above and below the limit. The results do not show a clear effect with either measure of policy treatment (Table 4). In the third and fourth quarters, investor commitments growth is indeed lower for banks further above the limit (the column (a) coefficients are negative). However, the effect is not statistically significant, and more broadly, the coefficient signs in columns (a) to (d) are not consistent with the expected heterogeneous effect (negative for investor commitments, positive for occupier commitments). Banks above the limit raise rates more than others in 2015:Q3 and Q4, but roughly equally for targeted and non-targeted mortgages (columns (e) to (h)). The results provide little indication that banks' responses to the policy depend on their distance from the limit (columns (a) to (c)) or whether they exceed the limit (columns (d) to (e)).
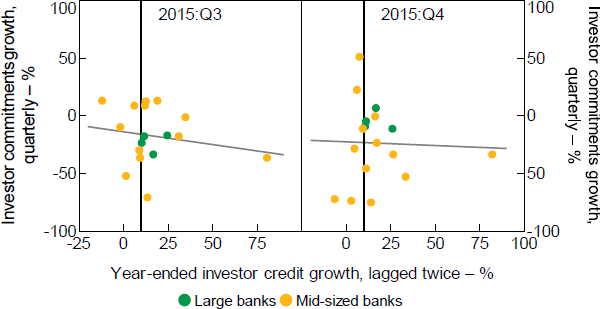
The lack of relationship between the policy treatment and changes in investor commitments growth is visualised in Figure 5. In Q3 and Q4, most banks above the limit indeed reduce their investor commitments growth, but this is also true for banks below the limit. This is consistent with the unpredictability of conditions facing mid-sized banks that is discussed in Section 5.2. Mid-sized banks below the limit, concerned about unpredictable flows pushing them above the limit, may have reduced investor commitments as a precaution, including by raising investor rates.
| Dependent variable: |
(a) | (b) | (c) | (d) | (e) | (f) | (g) | (h) | |||
|---|---|---|---|---|---|---|---|---|---|---|---|
| Commitments growth | Rate changes | ||||||||||
| Mortgage type: | Investor | Occupier | Investor | Occupier | |||||||
| Treatment function: | Linear | Binary | Linear | Binary | Linear | Binary | Linear | Binary | |||
| 𝕀(Q2–17) ×Treatment | −0.154 (0.165) |
−0.152** (0.071) |
−0.152 (0.180) |
−0.113* (0.061) |
−0.506* (0.251) |
−0.081** (0.034) |
−0.340* (0.183) |
−0.049 (0.029) |
|||
| 𝕀(Q3–17) ×Treatment | 0.243 (0.304) |
0.063 (0.076) |
0.455* (0.249) |
0.078 (0.075) |
0.044 (0.135) |
0.052* (0.026) |
−0.280** (0.113) |
−0.023 (0.028) |
|||
| 𝕀(Q4–17) ×Treatment | −0.245 (0.167) |
0.017 (0.084) |
−0.424** (0.154) |
−0.010 (0.079) |
0.291 (0.219) |
0.145*** (0.035) |
0.366*** (0.073) |
0.108*** (0.024) |
|||
| 𝕀(Q1–18) ×Treatment | −0.212 (0.189) |
−0.047 (0.112) |
0.157 (0.103) |
0.054 (0.064) |
0.226** (0.107) |
0.036 (0.024) |
0.476*** (0.077) |
0.065*** (0.022) |
|||
| Fixed effects | Bank & quarter | Bank & quarter | Bank & quarter | Bank & quarter | Bank & quarter | Bank & quarter | Bank & quarter | Bank & quarter | |||
| Bank controls | yes | yes | yes | yes | yes | yes | yes | yes | |||
| R squared | 0.464 | 0.464 | 0.427 | 0.425 | 0.731 | 0.733 | 0.653 | 0.652 | |||
| Sample | 720 | 720 | 720 | 720 | 705 | 705 | 719 | 719 | |||
|
Notes: Coefficients from regressing commitments growth, or change in advertised rates, on 4 lags of the bank-invariant policy indicator variable, each interacted with a ‘treatment’ measure of the bank's distance from the policy limit 2 quarters earlier. The 2 alternative treatment measures are ‘Linear’, equal to the bank's year-ended investor mortgage growth rate (as a decimal) minus 0.1, and ‘Binary’, an indicator for if the bank was exceeding the limit. The regressions include bank and quarter fixed effects. Bank-level controls (capital and deposits) are also included. Standard errors are clustered at the bank and quarter levels. ***, ** and * denote statistical significance at the 1, 5 and 10 per cent levels, respectively. |
|||||||||||
Note: Fitted lines are from OLS on plotted observations
Sources: APRA; Authors' calculations
5.4 Assessing identification in the average effect analysis
Given that the heterogeneous effect analysis – which applies a more robust identification strategy than the average effect analysis – does not provide causal evidence of a policy effect, this section further explores whether the average policy effect regressions are identifying true policy effects. First, we run the placebo tests described in Section 4.1. Second, we assess potentially confounding trends at the time the policy was implemented. We conclude that the average effect regressions are identifying a true policy effect.
5.4.1 Placebo regressions
The placebo regressions (described in Section 4.1) assess whether the estimated average policy effects could be driven by credit trends that coincide with the policy, but are not caused by the policy. A general interpretation of the results in Sections 5.1 and 5.2 is that, in 2015:Q3 and Q4, mortgage commitments and rates deviate from their typical patterns – as predicted by the regression controls – by a statistically significant degree. The placebo regressions apply the logic that, if these deviations are not caused by the policy, there is a high probability that similar deviations would occur in other periods.
Deviations comparable to the estimated policy effects are absent from other periods. In Figure 6, a deviation is statistically significant at 95 per cent if its grey confidence interval shading does not overlap with the horizontal zero line. There are some statistically significant deviations outside the policy periods, but, excluding those that align with the IO policy (shown in lightest shading), none are the size and statistical significance of the effects during the policy periods. For mid-sized banks, spreads significantly rise between the 2 polices. This is likely a further investor policy reaction, to quell the 2016 pick-up in investor commitments visible in the left panels. The smaller significant deviations in other periods justify caution in relying precisely on the specific coefficient values in Sections 5.1 and 5.2. Overall, however, the placebo results provide confidence that the regressions in Sections 5.1 and 5.2 identify policy effects.
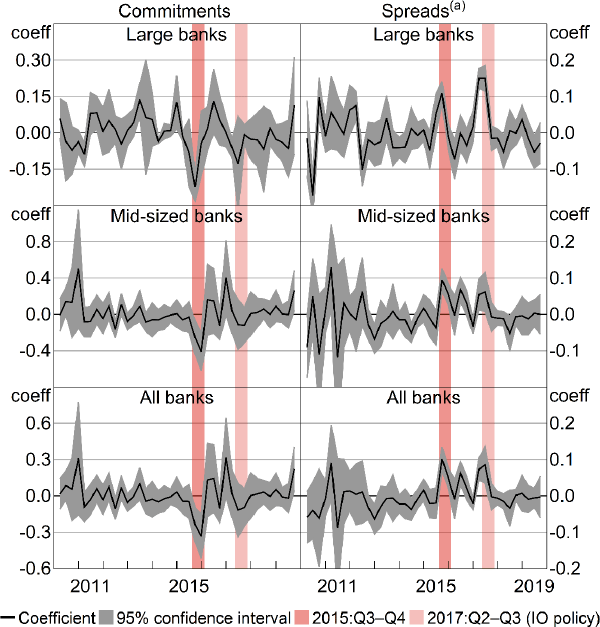
Note: (a) Spreads are between investor rates and occupier rates for P&I mortgages
5.4.2 The potential for coincidental credit trends
Confounding trends could still be driving the estimated average policy effects, if the placebo results are simply a strong coincidence. Any such confounding trends must affect housing investors and housing occupiers differently, because the estimated policy effects show a divergence between investor and occupier mortgages in commitments and spreads. The most plausible driver is therefore housing market conditions. Most other drivers of credit trend deviations, such as factors related to household income, should affect both types of mortgages. This is indeed the identification benefit from using non-treated loan types as a quasi control group.
Housing price growth does decline from mid 2015 for around 6 months (e.g. see Figure 1), but the evidence suggests that, rather than being fully exogenous, this is at least partly caused by banks' policy reactions. Internal RBA work, summarised in RBA (2018), compares regions' housing price behaviour with their proportion of investor ownership.[17] Up to mid 2015, housing price growth is similar in regions with high and low investor ownership. However, from 2015:Q3, once banks begin tightening investor credit, regions with higher proportions of investors experience significantly lower housing price growth than regions with fewer investors.[18] Furthermore, if reverse causality was confounding our analysis – that is, if the housing price growth declines caused a decline in investor demand – then investor rates should experience downward pressure with the downward shift in demand. The fact that investor rates rise is further evidence supporting our identification.
Footnotes
The calculation for the cumulative effect on growth is 1 – (1 – 0.235) × (1 – 0.337). [12]
Specifically, for an individual bank the counterfactual values are its observed values minus the estimated policy effect. The estimated policy effect is calculated from the 4 policy effect coefficients and the 2 lagged dependent variables, using the regressions that separate large and mid-sized banks. The aggregate counterfactuals sum these across all banks within either the large or mid-sized category. [13]
After demonstrating in Section 5.1 that the full sample results are not representative, we usually leave them out. [14]
Table 3 also displays some significant changes that affect both targeted and non-targeted mortgages, but that do not significantly affect the spread, and that we do not attribute to the policy. There is a significant decline in most rates in 2015:Q1. This could be driven by banks passing on more of the 2015:Q1 cash rate decline than usual, and therefore not being captured by the cash rate control variables. There is also a significant pick-up in occupier rates in 2015:Q4 alongside an investor rate rise. Banks attributed these to higher costs of capital due to the rising regulatory capital requirements for mortgages for IRB banks. [15]
Also in 2015:Q4, large banks' occupier commitments growth significantly picks up, while mid-sized banks' growth remains flat, despite large banks raising advertised occupier rates by more. [16]
Thanks to Paul Ryan for contributing this analysis. [17]
It is also possible that investors subsequently reacted to declining housing price growth by withdrawing further from the market (see Debelle (2019)). The housing price control in our regressions helps to prevent this from being picked up by the policy effect coefficients. [18]