RDP 2020-06: Consumer Payment Behaviour in Australia: Evidence from the 2019 Consumer Payments Survey 6. Online and Automated Payments
September 2020
- Download the Paper 1,620KB
6.1 Online
The 2019 CPS showed that the share of consumer payments made online – rather than in-person at the point of sale – was little changed from previous years, at 13 per cent of the number of payments (Table 6). By value, online payments accounted for 35 per cent of all consumer payments in 2019. Consumers are, however, increasingly making these online payments via mobile devices and apps: in 2019, 40 per cent of online payments were initiated via mobile apps.[27] App-based payments were relatively common for household bills and for transport-related payments, with the latter consistent with the growth in popularity of ride-sharing apps. Since the CPS was conducted late last year, there has been increased use of online shopping as consumers changed their purchasing behaviour and merchants increased their online capabilities in response to the COVID-19 situation. This may have led to a more permanent shift in purchasing patterns for some consumers and it would not be surprising if the online share of consumer payments is higher in future surveys.
It is also worth noting that the figures for online payments shown in the top panel of Table 6 do not include participants' automatic payment arrangements (e.g. direct debits), which are recorded separately in a post-diary questionnaire (see Section 6.2). When combined, the share of total weekly spending accounted for by automated and online payments has increased by 6 percentage points since 2013 (Table 6, bottom panel).
| 2007 | 2010 | 2013 | 2016 | 2019 | |
|---|---|---|---|---|---|
| Online payments as a share of consumer payments(a) | |||||
| Number | 3 | 7 | 13 | 13 | 13 |
| Value | 13 | 26 | 36 | 39 | 35 |
| Mobile/app as a share of online payments(b) | na | na | 6 | 20 | 40 |
| Online and automatic payments as a share of total spending(c) | |||||
| Number | na | na | 17 | 20 | 23 |
| Value | na | na | 43 | 48 | 49 |
|
Notes: (a) Excludes payments over $9,999, transfers (payments to family and friends), transport cards and automatic payments Source: RBA calculations, based on data from Colmar Brunton, Ipsos and Roy Morgan Research |
|||||
Card payments accounted for 48 per cent of the number of online payments (and 39 per cent by value). Within the figures for cards, the share of online payments made using a debit card increased by 9 percentage points between 2016 and 2019 (to 29 per cent) while the credit card share declined over this period. PayPal was used for a further 14 per cent of online transactions, while BPAY and bank transfers accounted for much of the remaining online payments.[28] Buy now, pay later (BNPL) services were identified as a distinct ‘payment method’ for the first time in the latest CPS (BNPL is discussed further in Section 8). Despite strong growth in transaction volumes in recent years, BNPL accounted for just 3 per cent of the total number of online payments in the 2019 survey (and 1 per cent by value). The share was higher for certain merchants, with BNPL accounting for 10 per cent of the number of online goods purchases, for example.
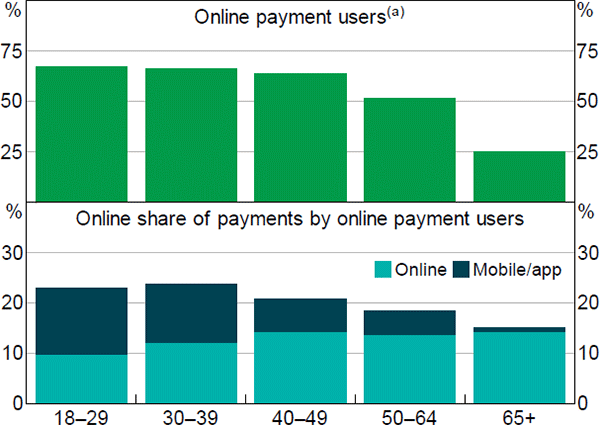
The share of respondents that made at least one online payment in 2019 was 55 per cent, which was about the same as in the 2013 and 2016 surveys but double the share of people surveyed in 2007. Online payments continue to be made most frequently by younger respondents, with two-thirds of people aged under 40 having made at least one online payment during the 2019 diary week (Figure 25, top panel). The online payment users in this age group made nearly one-quarter of their weekly purchases online on average, more than half of the time via mobile apps (Figure 25, bottom panel). When respondents in older age groups made online purchases, they tended to use apps less frequently.
Note: (a) Share of respondents who made at least one online payment in the diary week
Source: RBA calculations, based on data from Roy Morgan Research
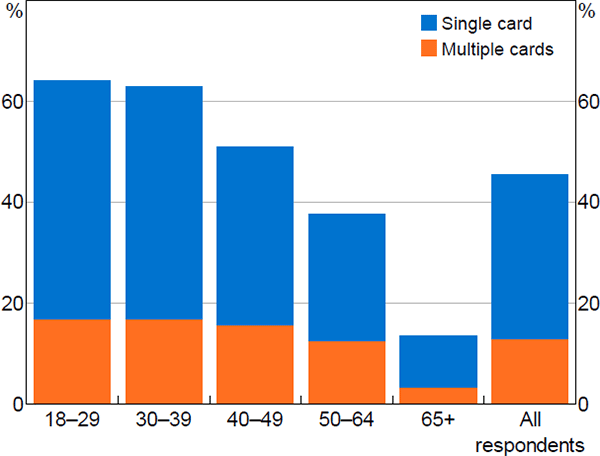
As noted above, many CPS respondents also reported that they had used debit or credit card details that had previously been stored on a computer, device or within an app to make an online payment (as opposed to filling in their card details at the checkout stage of the transaction). This includes, among other things, choosing to autofill stored payment credentials when shopping online, and payments made via apps in which the payment is embedded and occurs in the background at the time of a transaction (e.g. transport ride-sharing apps). Around 45 per cent of survey participants had used stored payment details for an online payment in the previous year (Figure 26). This is consistent with a trend towards payments becoming more seamless from the perspective of consumers. Most consumers using stored card details reported that they had only one card stored online, while 29 per cent had multiple stored cards. The propensity to store only one card could be an indication that consumers may be inclined to ‘set and forget’ their payment method as transactions become more seamless. To the extent that this results in consumers being less responsive to the relative costs of different payment methods, there could be implications for competition and efficiency in the retail payments market.
Note: Respondents who made at least one payment using stored card details in the previous 12 months
Source: RBA calculations, based on data from Roy Morgan Research
6.2 Automatic Payments
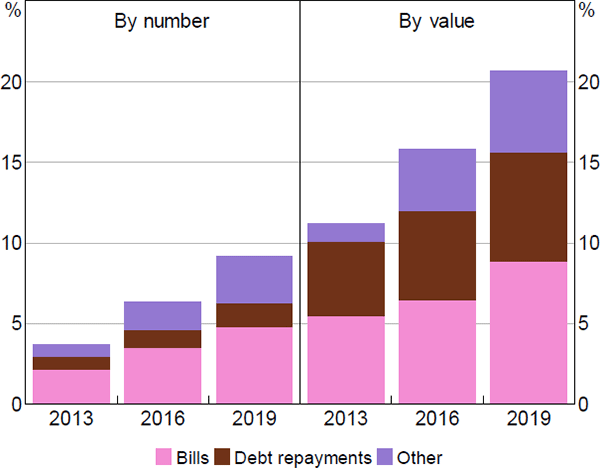
In addition to recording payments that they initiated during the diary week, respondents were asked details about automatic payments that occurred during the week as part of a post-diary questionnaire. These automatic payments include pre-authorised direct debit payments for bills (e.g. rent, phone and utility bills or digital service subscriptions), regular debt repayments (mortgage or credit card repayments) and recurring ‘pay anyone’ transactions set up via internet banking.
Automatic payment arrangements are becoming more common, with 81 per cent of respondents in 2019 reporting that they had at least one automatic payment arrangement, compared with 65 per cent in 2016. Automatic payments in the diary week accounted for 21 per cent of the value of respondents' weekly expenditure in 2019, compared to 16 per cent in 2016 and 11 per cent in 2013 (Figure 27). Alongside increased use, the median value of automatic payments fell to $60 in 2019 from around $75 in 2013.[29] Around 50 per cent of household bills are now paid automatically, compared to 40 per cent in 2016.
Source: RBA calculations, based on data from Colmar Brunton, Ipsos and Roy Morgan Research
Footnotes
The 2019 CPS, for the first time, separately identified mobile apps as a means of initiating a payment.[27]
Bank transfers were defined as logging into internet banking or a bank ‘app’ or using telephone banking and using a BSB and account number or PayID to make a pay-anyone transaction.[28]
The median value of payments recorded in the diary was $25.[29]