RDP 2020-06: Consumer Payment Behaviour in Australia: Evidence from the 2019 Consumer Payments Survey 3. Key Trends in Consumer Payments
September 2020
- Download the Paper 1,620KB
The 2019 CPS showed that Australians are continuing to switch to electronic payment methods in preference to cash for their day-to-day transactions. Debit cards were the most frequently used means of payment in 2019, overtaking cash as the single most commonly used payment method for the first time.[3] Overall, payment cards – debit and credit cards combined – were used for 63 per cent of the number of consumer payments in 2019, compared with 52 per cent three years earlier (Table 1). More recently, the switch to electronic payment methods is likely to have accelerated as a result of consumer and merchant responses to COVID-19.[4]
One of the most notable developments in recent surveys has been the strong growth in contactless card payments as a result of widespread adoption of this functionality by consumers and merchants. The share of in-person payments made by tapping a debit or credit card on a card terminal increased to 50 per cent in 2019, from 10 per cent in 2013. Consumers are using cards more frequently for payments of all sizes and the adoption of contactless functionality has facilitated particularly strong growth in the use of cards for low-value transactions in recent years. For example, the share of in-person payments of $10 or less that were made with cards rose by 20 percentage points relative to three years earlier, to 51 per cent in 2019. The 2019 CPS also showed that Australian consumers used mobile phones or other payment-enabled devices to make ‘tap and go’ payments more often than they did three years ago, although such mobile payments still accounted for a relatively small share (around 5 per cent) of in-person payments. Other means of electronic payment such as BPAY and internet banking applications account for relatively small shares of the number of consumer payments (but a higher share when measured by the value of transactions).
| 2007 | 2010 | 2013 | 2016 | 2019 | |
|---|---|---|---|---|---|
| Number of payments | |||||
| Cash | 69 | 62 | 47 | 37 | 27 |
| Cards | 26 | 31 | 43 | 52 | 63 |
| Debit cards | 15 | 22 | 24 | 30 | 44 |
| Credit and charge cards | 11 | 9 | 19 | 22 | 19 |
| BPAY | 2 | 3 | 3 | 2 | 2 |
| Internet/phone banking(a) | na | 2 | 2 | 1 | 3 |
| PayPal | na | 1 | 3 | 3 | 2 |
| Cheque | 1 | 1 | 0.4 | 0.2 | 0.2 |
| Other(b) | 1 | 1 | 2 | 4 | 2 |
| Value of payments | |||||
| Cash | 38 | 29 | 18 | 18 | 11 |
| Cards | 43 | 43 | 53 | 54 | 61 |
| Debit cards | 21 | 27 | 22 | 26 | 36 |
| Credit and charge cards | 23 | 16 | 31 | 28 | 25 |
| BPAY | 10 | 10 | 11 | 8 | 9 |
| Internet/phone banking(a) | na | 12 | 10 | 10 | 14 |
| PayPal | na | 1 | 2 | 4 | 2 |
| Cheque | 6 | 3 | 2 | 2 | 2 |
| Other(b) | 3 | 3 | 5 | 3 | 2 |
|
Notes: Excludes payments over $9,999, transfers (payments to family and friends), transport cards and automatic payments Source: RBA calculations, based on data from Colmar Brunton, Ipsos and Roy Morgan Research |
|||||
With Australian consumers increasingly preferring to make their payments electronically, the trend decline in transactional use of cash continued. Cash was used for 27 per cent of consumer payments (by number) in 2019, whereas almost 70 per cent of payments were made in cash in 2007. While the decline in the relative use of cash has been widespread throughout the economy, cash was still used for a material share of certain transactions (e.g. at businesses such as cafes that have predominantly low-value payments). Consumers in all broad demographic groups are using cash less frequently than they used to, though the shift to electronic payments has not been as pronounced among older Australians and lower-income groups (Figure 1).
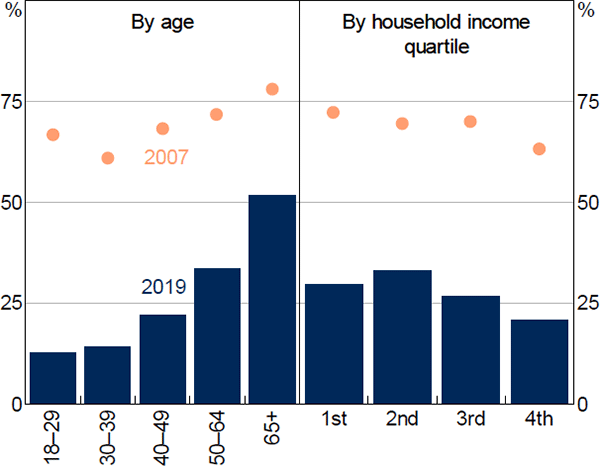
Note: Because of the overlap between age and income groups, the figures for income quartiles are adjusted for respondents' age
Source: RBA calculations, based on data from Roy Morgan Research
Similar trends in consumer payments have been apparent in a number of other economies. Data from broadly similar surveys conducted in a number of other advanced economies show that consumers globally are shifting away from cash to cards, although there are also some notable differences across economies (Figure 2).[5] Sweden and Norway are prominent examples of jurisdictions where cash is used for a relatively small proportion of consumer payments, whereas cash is more commonly used in some euro area countries.[6] China is another example of a country in which there has been a marked increase in the relative use of electronic payment methods, facilitated by the widespread adoption of digital wallet services.
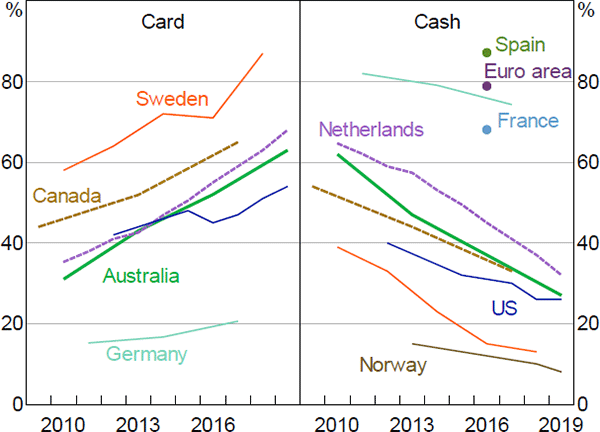
Notes: Cash and card do not sum to 100; observations are not directly comparable due to differing survey methods and inclusions across economies
Sources: Bank of Canada; Colmar Brunton; De Nederlandsche Bank; Deutsche Bundesbank; European Central Bank; Federal Reserve Bank of San Francisco; Ipsos; Norges Bank; RBA; Roy Morgan Research; Sveriges Riksbank
Footnotes
In the 2016 CPS, debit and credit cards combined were used more frequently than cash. [3]
See Bullock (2020) for more information. [4]
Differences in survey design and coverage mean that the results of these surveys are not fully comparable. See Bagnall et al (2011) for an earlier discussion of the results of harmonised payments survey data. [5]
Governments and central banks in some countries where the transition away from cash has been particularly pronounced, such as Sweden, have implemented or are considering a range of policy measures designed to ensure ongoing access to cash distribution services. [6]