RDP 2020-05: How Risky is Australian Household Debt? 2. Why is Australian Household Debt High Relative to History and Other Countries?
August 2020
- Download the Paper 1,881KB
Household indebtdness, as measured by DTI ratios, has risen considerably over the past 40 years, both in Australia and elsewhere (Figure 1). The increase in the Australian household DTI ratio has been more pronounced than in most other countries, rising from the bottom half of the distribution across advanced economies in the late 1980s to the top quartile by 2018. Data available for a subset of countries over a longer period of time show that the rise in global household DTI ratios accelerated around the mid 1980s.[5]
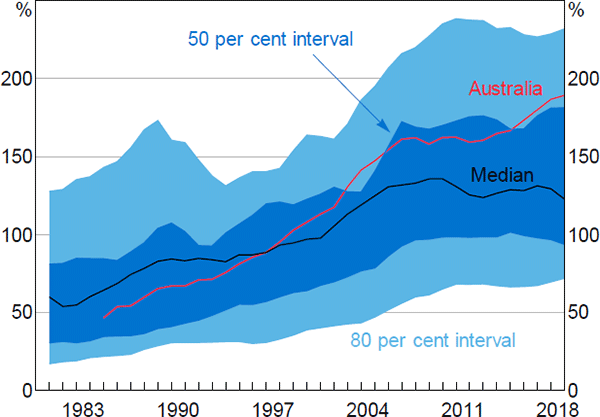
Notes: Sample of 22 advanced economies (see Appendix A for list); ratios backcasted to account for changes in sample over time
Sources: Authors' calculations; National agencies; OECD
The significant rise in indebtedness in most countries over recent decades naturally raises the question of how much risk this creates. This is particularly the case for Australia, where the DTI ratio has increased at a faster rate and to a higher level than in most countries. One way of approaching this question is to consider the factors that have contributed to the rise in countries' DTI ratios and why the DTI ratio is higher in some countries than in others. This approach is relevant because different explanations for the rise in household DTI ratios have different implications for vulnerabilities. For example, rising incomes or structurally lower nominal interest rates both allow households to borrow at higher DTI ratios without reducing their expenditure on other goods and services. Reflecting this, Kirkham and Burgess (2019) argue that current levels of UK household debt are ‘sustainable’ at prevailing rates of interest. Similarly, DTI ratios can be sustainably higher in countries that have structural features that either reduce the volatility of economic activity or the costs to the economy of borrower defaults, or if a larger portion of the housing stock (and associated debt) is held by households. However, if the rise in the DTI ratio over time has been driven by excessively optimistic expectations about the future returns on housing then this development has contributed to additional risks to financial stability. Other possible explanations for the rise in DTI ratios may create more nuanced implications for vulnerabilities. For example, financial deregulation in the 1980s and 1990s removed an inefficient impediment to borrowing, improving the access of creditworthy households to debt. To the extent that this allowed households to fund valuable investment in the housing stock, it is unlikely to have increased household vulnerability. But the history of financial deregulation shows that such changes have regularly triggered excessive growth in debt, often to fund higher spending on consumables, which subsequently ends badly (Mishkin 2007).
Given these considerations, this section addresses the question of how risky the Australian DTI ratio is by examining the factors that have contributed to the increase in global DTI ratios over recent decades and that explain why some countries have structurally higher DTI ratios than others. We do this using an (unbalanced) panel of 22 advanced economies covering the period from 1980 to 2018. This paper is not the first to empirically examine the factors underpinning household DTI ratios.[6] However, it is the first (to the best of our knowledge) that jointly addresses the time series and cross-sectional dimensions.
2.1 Data and Modelling Approach
A household's DTI ratio is the result of both the price of (housing and other) assets, relative to income, and the extent to which these assets are leveraged. However, asset prices and leverage are jointly determined at an economy-wide level – the house price level is both influenced by the availability of finance and has an influence on how much the household sector borrows. Given this, we choose to directly model the DTI ratio rather than separately modelling the determinants of asset prices and leverage.[7] It is also not possible to clearly separate variables into those that influence asset values and those that influence leverage. For example, lower interest rates will boost the equilibrium value of assets in a discounted cash flow model without leverage, but lower interest rates also allow households to take on more debt for a given level of repayments. Similarly, higher income will directly increase households' willingness to take on debt (since their ability to service that debt increases) and may indirectly increase the value of housing if there are limits to its supply. Over recent decades, both leverage and asset prices have risen in Australia and the United States, suggesting that our results will not be driven by just one of these (Figure 2).
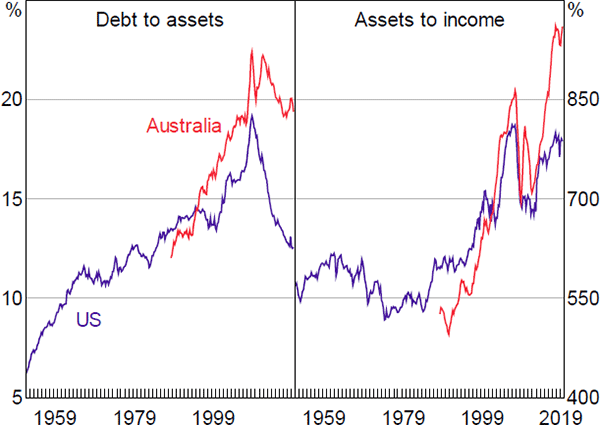
Sources: ABS; Board of Governors of the Federal Reserve System
Taking account of theoretical models of household borrowing and the extant literature, we consider a range of potential explanators for household DTI ratios across time and countries. For the purposes of illustration, we consider these in six (not entirely exclusive) categories, relating to:[8]
- The cost of debt – including the real interest rate, the spread between BBB and AAA US corporate bonds (as a proxy for the pricing of risk),[9] and how (mortgage) debt is taxed (since that affects the after-tax cost of borrowing).
-
Households' borrowing capacity – this includes variables that affect banks' willingness and ability to lend, such as financial liberalisation and the strength of legal rights. For example, banks can be more willing to lend at higher loan-to-valuation ratios (LVRs) in countries where they are confident of their legal ability to seize collateral (Jappelli et al 2013). Ideally we would include maximum permissible LVRs as a more direct measure of banks' willingness to lend, but we unfortunately do not have any robust measures of this across countries or over time.
This category also includes variables that affect households' ability to service a loan, such as the inflation rate, (aggregate) real disposable income per capita, unemployment and inequality. Inflation is included under this category (rather than under cost of debt) on the basis that, in theory, its primary effect should be on the ability of a borrower to service a given-sized loan in the initial years after it is written (as argued by Debelle (2004), Ellis (2005) and Mishkin (2007)).[10] We include inequality on the basis that increased dispersion in household income reduces the ability of many households to borrow (Barba and Pivetti 2009), though inequality has also been argued to have boosted indebtedness in the United States (Mian, Straub and Sufi 2020b). We unfortunately do not have any robust indicators of permissable LVRs across countries or over time.
- Current demand for debt (at a given price) – including expectations of future income growth (which, if elevated, will encourage households to borrow to smooth income over their life) and the age structure of the population (motivated by life-cycle model predictions that young households are most likely to borrow).
- The current rental value of housing – this includes factors that influence household demand for housing, such as housing stock per capita, the elasticity of housing supply and growth in the urban population. It also includes factors that may restrict the responsiveness of housing supply, such as the share of the national population living in cities and the population-weighted density of those cities. These supply variables are the best available cross-country indicators of the sorts of supply constraints identified by Kendall and Tulip (2018) and others.
- Measures of the expected future value of housing (and hence capital gains) – including recent growth in real housing prices (as a possible proxy for expectations of future capital gains) and the largest peak–trough housing price fall experienced over the prior 10 years (as a proxy for perceived riskiness of housing).
- Ownership of the dwelling stock, including rental properties – this is included to capture the extent to which debt associated with housing investment is accounted for in the household or the corporate sectors.
Our variables of interest include both variables that change over time and some that are ‘time invariant’ (but do vary across countries). Some of our time-invariant variables in practice would vary over time, but they do so only slowly and we do not have data for them at different points in time. Given that, we require a random effects model to estimate coefficients on these time-invariant variables.[11] We also have some variables that are likely to be ‘weakly endogenous’ (in that they are correlated with unobserved factors influencing debt, and hence with the random effect), such as urban density, real disposable income, the real interest rate and financial liberalisation. To account for these things, we use the Hausman-Taylor (1981) estimator with the following basic structure:
where i indexes countries, t indexes time, the dependent variable is household debt relative to income and captures the vector of random effects. The matrix contains time-varying variables that are uncorrelated with , while contains time-varying variables that are possibly correlated with . The Z matrices contain variables that change very little (if at all) over time; any variables in are assumed to be uncorrelated with while variables in are assumed to be possibly correlated with .[12] All variables are assumed to be uncorrelated with the error, . Most variables enter in log form, with the exception of real interest rates, inflation, recent housing price growth and dummy variables.
We estimate the regression using the level of the DTI ratio, consistent with our motivation being to understand the risks arising from any given level of the DTI ratio. To test for stationarity, we use the Phillips-Perron panel unit root test. We are able to (weakly) reject the null hypothesis that all panels are non-stationary.[13]
While the Hausman-Taylor estimator corrects for potential endogeneity arising from correlation with the random effects, it cannot correct for any ‘strict’ endogeneity arising from correlation between our variables and the error term, . There are several variables that may possibly be endogenous. Most obviously this includes measures of housing prices, but could also include real interest rates, real income and financial liberalisation. (In contrast, other variables such as ownership of the housing stock, urbanisation, the strength of legal rights and housing supply are very likely determined by deep structural characteristics of each economy.) In Section 2.3 we conduct tests to try to identify any endogeneity and assess the potential bias arising. In some cases these tests leave us confident that we have identified unbiased, causal relationships, but in other cases we cannot be so sure. As a result, we cannot always confidently assert that the relationships we identify are strictly causal, and in our discussion we try to not overstate these results. It is also important to note that, while we have a long list of potential explanators, we still cannot rule out omitted variables. As a result, we cannot definitively claim to have identified the main explanators of the DTI ratio.
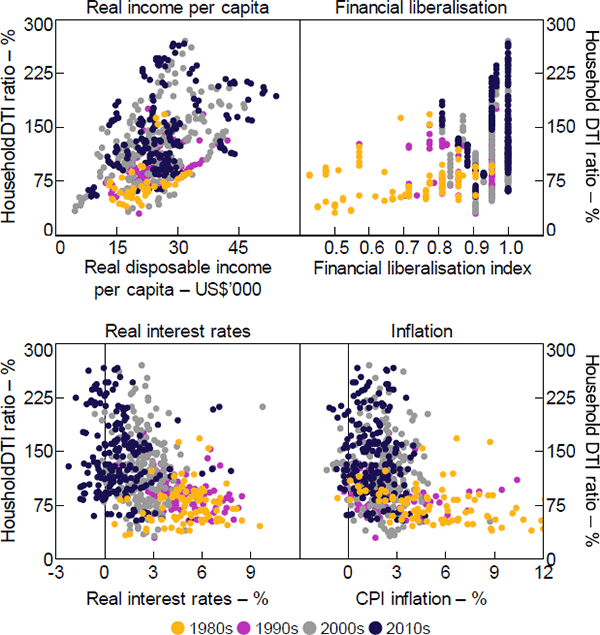
Descriptive statistics for our final list of variables are shown in Table 1, while a detailed discussion of their definitions can be found in Appendix A. Figures 3 and 4 show the relationship between the DTI ratio and a selection of these, using our cross-country panel.
| Variables | Mean | Standard deviation | Min | Max | |
|---|---|---|---|---|---|
| Debt-to-income ratio | 120.6 | 48.1 | 30.0 | 269.8 | |
| Time-varying | |||||
| Real income per capita (US$'000) | 25.4 | 8.7 | 4.7 | 53.3 | |
| Real interest rate (%) | 2.7 | 2.3 | −3.5 | 10.6 | |
| Inflation (%) | 2.3 | 2.3 | −5.8 | 29.0 | |
| Housing price growth (real, %) | 2.4 | 6.7 | −24.5 | 26.9 | |
| Max price fall (%) | 12.4 | 11.8 | 0.0 | 54.5 | |
| Urban population growth (%) | 1.0 | 0.6 | −0.5 | 4.0 | |
| Urbanisation (%) | 0.29 | 0.15 | 0.09 | 0.64 | |
| Housing stock per person (ratio) | 0.45 | 0.05 | 0.29 | 0.59 | |
| Financial liberalisation (index) | 0.92 | 0.10 | 0.43 | 1.00 | |
| ‘Time-invariant’ | |||||
| Ownership of housing (%) | 83.0 | 10.7 | 65.9 | 97.4 | |
| Strength of legal rights (index) | 6.0 | 2.8 | 2.0 | 12.0 | |
| Urban density (person/ha) | 74.6 | 41.7 | 26.6 | 192.4 | |
| Notes: Sample includes 22 advanced economies, with data collected since 1980 where possible; further details on the sample of countries and the construction and source of each variable can be found in Appendix A | |||||
Note: Circles represent countries where owner-occupier mortgage payments are tax deductible
Sources: Authors' calculations; National agencies
Sources: Authors' calculations; IMF; National agencies; OECD; World Bank
2.2 Results
Our preferred specification includes fewer variables than are discussed above, based on the fit of the model, the robustness of the coefficient and the need to limit the number of time-invariant metrics to obtain reliable coefficient estimates. (We discuss the coefficients on excluded variables below.) The results of our preferred specifications are shown in Table 2. This table has two closely related regressions. The first we term the ‘narrow’ regression as it includes only the 10 countries for which we have the variable measuring the share of the housing stock owned by households (‘ownership’). The second we term the ‘wide’ regression as it drops this variable and so expands the number of countries to 19. An additional regression excludes the urban density and housing stock variables, which are not available for three countries in our sample. The results of this (‘All countries’) are very similar to those for the wide regression.
| Variable | Narrow regression | Wide regression(a) | All countries(a) |
|---|---|---|---|
| Time-varying | |||
| Real income per capita(b) | 0.424*** (0.042) |
0.337*** (0.033) |
0.363*** (0.032) |
| Real interest rate(b) | −0.077*** (0.007) |
−0.034*** (0.004) |
−0.028*** (0.004) |
| Inflation | −0.047*** (0.007) |
−0.024*** (0.005) |
−0.020*** (0.005) |
| Housing price growth | 0.002 (0.001) |
0.000 (0.001) |
−0.002** (0.001) |
| Max price fall | −0.033*** (0.007) |
−0.031*** (0.006) |
−0.036*** (0.005) |
| Urban population growth | −0.031 (0.024) |
−0.026 (0.020) |
0.022 (0.019) |
| Urbanisation | −0.236 (0.192) |
0.095 (0.171) |
0.014 (0.123) |
| Housing stock per person(b) | 0.338 (0.498) |
1.944*** (0.243) |
|
| Younger population | 0.029** (0.012) |
−0.033*** (0.008) |
−0.049*** (0.006) |
| Older population | −0.014* (0.008) |
−0.024*** (0.007) |
−0.013** (0.005) |
| Financial liberalisation(b) | 0.892*** (0.153) |
0.274*** (0.100) |
0.639*** (0.087) |
| ‘Time-invariant’ | |||
| Ownership of housing | 1.491* (0.769) |
||
| Strength of legal rights | −0.031 (0.227) |
0.183 (0.237) |
0.275* (0.162) |
| Urban density(b) | 0.169 (0.250) |
−0.486 (0.347) |
|
| Number of observations | 262 | 427 | 525 |
| Number of groups | 10 | 19 | 22 |
| F-statistic | 103.4 | 154.3 | 186.9 |
|
Notes: *, ** and *** denote statistical significance at the 10, 5 and 1 per cent levels, respectively; standard errors are in parentheses |
|||
The coefficients on income per capita, the real interest rate, inflation and financial liberalisation are all significant and of the expected sign: higher real incomes and lower real interest rates or inflation are all associated with increased indebtedness of households, as is the deregulation of the financial sector since the 1980s. In addition, countries that have experienced a very large fall in housing prices at some point in their history have lower DTI ratios, consistent with agents in those countries being more cautious about the riskiness of borrowing to invest in housing. And countries in which more of the housing stock is owned by households (either as owner-occupiers or investors) naturally have higher household DTI ratios.
Our two proxies for the age structure of populations are also significant, but not consistent across regressions. According to the narrow regression, countries with a large share of their population aged 25 or less tend to have higher DTI ratios, consistent with people borrowing when young to bring forward future consumption from their peak earnings years. In addition, that regression shows that countries with a larger share of people aged over 65, who tend to have repaid their loans ahead of ceasing work, have lower DTI ratios. However, the coefficient on the share of the population that is younger switches sign in the wide and all countries regressions. More generally, we are cautious about overemphasising these results as the coefficients and conclusions to be drawn on the influence of age structure on DTI ratios are sensitive to which age ranges are included in the regression.[14]
In contrast, the number of dwellings per capita (‘housing stock per person’) has a positive coefficient in the wide regression (but is insignificant in the narrow regression). We would expect this variable to have a negative coefficient on the basis that additional supply of dwellings (relative to the population) would put downward pressure on dwelling prices and, in turn, debt.[15] But it is possible that the true relationship is positive if this supply effect is dominated by a choice among residents of a country to live in households with fewer people (specifically, income earners), which would lower household income by more than it lowers debt. This coefficient is only significant in the wide regression because of the broader sample of countries; it is not sensitive to just the exclusion of the ownership variable. We also investigated the relationship between DTI ratios and estimates of the elasticity of housing supply in each country as an alternative measure, but found no relationship.
Other variables – including growth in housing prices and/or population over recent years, urban density and urbanisation, and the strength of legal rights – are generally insignificant. (The strength of legal rights is, however, positive and significant in the all countries regression.) In some cases, the lack of significance could reflect poor proxies. For example, it may be that high but expected population growth can be met with additional housing supply, without inflating dwelling prices, or that it is the interaction between population growth and zoning restrictions that matter. (We tested for this first possibility by including the acceleration in population growth as a proxy for higher-than-expected population growth, but without success.) Similarly, growth in housing prices over the prior three years may be a poor proxy for households' expectations of future capital gains on housing, or it may be that the relationship between the DTI ratio and expectations takes a different functional form to what we specify (i.e. it may be related to the pace of growth in the DTI ratio, not its level). However, the insignificance of the density terms – both the extent of urbanisation and the density of major cities – is surprising, given previous work (e.g. Ellis and Andrews 2001). This result does not seem to be particularly sensitive to the inclusion of related variables. In particular, neither variable is significant when we exclude the other, housing stock per person and/or population growth.
2.3 Robustness Tests
Attempting to investigate the determinants of the levels of household DTI ratios across time and country is an ambitious task. Our choice of regressors is founded on a large body of theoretical and empirical literature but is not tightly linked to a micro-founded economic model. Moreover, our cross-country panel approach does not definitively address issues of the direction of causality, nor can it conclusively dismiss a range of potential econometric concerns.
In light of this, we conducted a range of robustness tests. The results of these tests are shown in Table 3. These tests do no overturn the main results discussed above:
- Column (1) of Table 3 shows results for when we allow for the possibility that real disposable income and real interest rates are not ‘strictly exogeneous’.[16] It does this by instrumenting for these variables using GDP per hour worked and the average interest rate in the United States, Germany and Japan.[17] We find the coefficients in our regression are qualitatively unaffected by using instruments for these two variables. In the small number of cases where there are notable changes, this results in a coefficient that was not significant becoming significant (i.e. recent housing price growth, housing stock per capita).
- Columns (2) and (3) test for omitted variable bias by adding country-specific time trends or time fixed effects.[18] The size of various coefficients are sensitive to these, but the only qualitative change is that the real interest rate and inflation become insignificant when including time trends, but not time fixed effects. Given the very strong theoretical basis to expect a negative coefficient on the real interest rate, in particular, we do not see this result indicating omitted variable bias.
- Columns (4) to (6) include a range of additional variables that are potentially determinants of the DTI ratio. In some cases (income growth expectations and taxation laws) these variables are excluded from our main regression due to concerns about the quality of our proxies, not because we believe they are unimportant. The results when these are included lend support to that prior. The coefficient of income growth expectations (which are proxied using Consensus Economics forecasts of real GDP growth about 18 months earlier) has a sign that is contrary to theory, perhaps driven by the structural decline in GDP growth over recent decades.[19] Similarly, our crude proxies for whether countries allow owner-occupier mortgage costs to be deducted from tax or capital gains on housing to be concessionally taxed are not significant influences of the DTI ratio. However, we do find that offering capital gains tax concessions for housing is associated with a greater responsiveness of the DTI ratio to falling nominal interest rates. (That is, the interaction between our tax dummy variable and nominal interest rates is significant.) These results are consistent with such arrangements raising the incentives to increase leverage in an environment of falling interest rates and rising house prices.
| Variable | Baseline | (1)(a) | (2) | (3) | (4) | (5) | (6) |
|---|---|---|---|---|---|---|---|
| Time-varying | |||||||
| Real income per capita(b) | 0.424*** | [0.785]*** | 0.075*** | 0.269*** | 0.430*** | 0.324*** | 0.389*** |
| Real interest rate(b) | −0.077*** | [−0.097]*** | −0.006 | −0.053*** | −0.079*** | −0.064*** | −0.077*** |
| Inflation | −0.047*** | −0.062*** | 0.002 | −0.039*** | −0.049*** | −0.032*** | −0.041*** |
| Housing price growth | 0.002 | 0.004** | 0.001* | −0.001 | 0.001 | 0.003** | 0.003*** |
| Max price fall | −0.033*** | −0.019** | −0.025*** | −0.034*** | −0.034*** | −0.034*** | −0.042*** |
| Urban population growth | −0.031 | −0.122*** | 0.009 | −0.002 | −0.002 | 0.005 | −0.008 |
| Urbanisation | −0.236 | −0.580 | −1.845*** | −0.304 | −0.277 | 0.251 | −0.021 |
| Housing stock per person(b) | 0.338 | 1.327** | 3.178*** | −0.100 | 0.421 | 1.538*** | 0.338 |
| Younger population | 0.029** | 0.087*** | 0.070*** | 0.021* | 0.015 | 0.017 | 0.003 |
| Older population | −0.014* | −0.015 | −0.052*** | −0.026* | −0.029*** | 0.001 | −0.025*** |
| Financial liberalisation(b) | 0.892*** | 0.693*** | 0.232** | 1.155*** | 0.960*** | 0.729*** | 0.838*** |
| Income growth expectations | −0.042* | ||||||
| Unemployment rate | 0.005 | 0.022*** | |||||
| Baa-Aaa spread(b) | 0.001 | 0.013 | |||||
| ‘Time-invariant’ | |||||||
| Ownership of housing | 1.491* | 2.198** | 4.800** | 1.300* | 1.535** | 0.813 | 1.264 |
| Strength of legal rights | −0.031 | 0.030 | 0.952* | 0.044 | −0.003 | −0.927** | −0.129 |
| Urban density(b) | 0.169 | −0.065 | 0.437 | 0.263 | 0.102 | −0.501 | 0.237 |
| Inequality | −1.525*** | ||||||
| Interest tax deductible | −0.084 | ||||||
| Capital gains taxation | 0.824* | ||||||
| Time variables | Country trends | Fixed effects | |||||
| No of obs | 262 | 262 | 262 | 262 | 241 | 236 | 260 |
| F-statistic | 103.4 | 62.7 | 319.2 | 43.0 | 66.2 | 127.2 | 94.8 |
|
Notes: *, ** and *** denote statistical significance at the 10, 5 and 1 per cent levels, respectively; shaded cells highlight differences between regressions (a) Income per capita and real interest rate are instrumented in this regression, this is shown by including square brackets around their coefficients |
|||||||
2.4 Implications for Debt Levels across Countries and Time
Our baseline coefficients can be used to imply something about the factors that account for the rise in DTI ratios over time. What follows uses coefficients from the narrow regression, but the results do not materially differ using the wide coefficients.
For Australia, almost all of the 125 percentage point rise in the DTI ratio between 1988 and 2018 can be attributed to the effect of lower real interest rates and inflation, financial liberalisation and higher real incomes (Figure 5). These same factors also account for the rise in DTI ratios in other countries, but the apparent contribution of lower real interest rates is significantly larger than for Australia, while the contribution of the other three (especially real incomes) is materially lower.
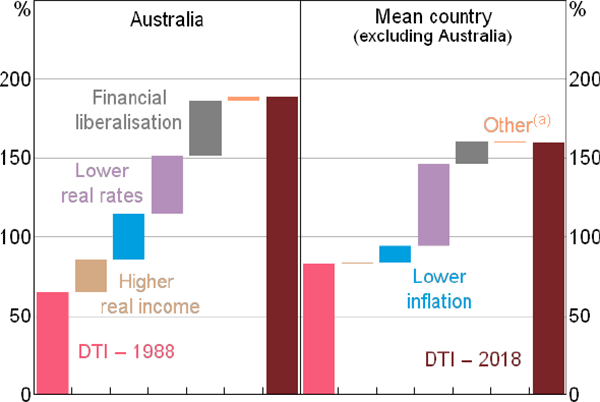
Note: (a) Includes small contributions from other variables and error term
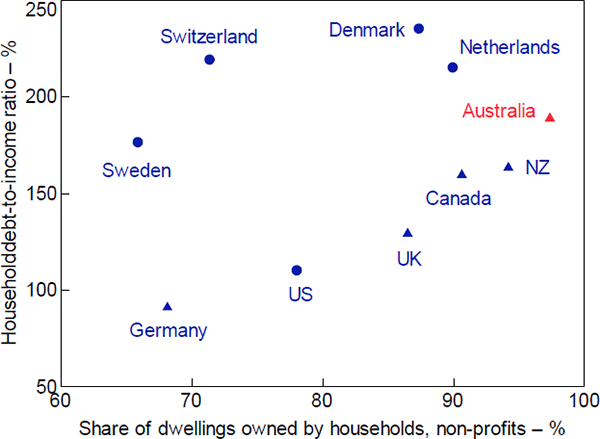
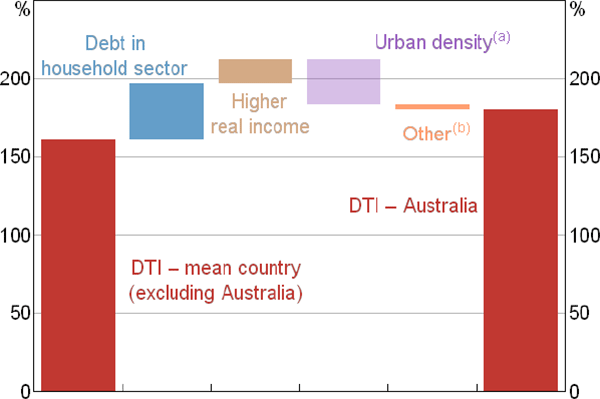
The coefficients can also be used to imply what factors account for the higher level of the DTI ratio in Australia than elsewhere. (We compare debt levels in 2016 because our sample of countries declines in 2017 and 2018.) The most influential of these is who owns the housing stock (Figure 6). In Australia, almost all of the housing stock is owned by households while, at the other extreme, this share is less than two-thirds in Sweden. These differences mostly reflect the ownership of the rental stock, which in Australia is owned directly by households but in many European countries is owned by the government, co-operatives or corporations. (It does not reflect differences in the owner-occupier home ownership rate, which in our sample are relatively small.) As a result of this, almost all of the debt used to finance housing in Australia is owed by the household sector, while the share is much lower in a number of other countries. Another factor that contributes to Australia having a higher DTI ratio is its higher real incomes. In contrast, the coefficients on urban density implies that Australia's urban structure materially reduces the DTI ratio in Australia compared with other countries (though the coefficient on this is insignificant).[20]
Notes:
(a) Coefficients on this variable are insignificant
(b) Includes random effect and error term
The factors included in our regression explain most of the rise in the DTI ratio over time and the differences across countries. For Australia, this is particularly true over the period from 1985 to around 2014 (Figure 7). However, the rise in Australian household DTI ratios since 2014 has been larger than is explained by our regression.
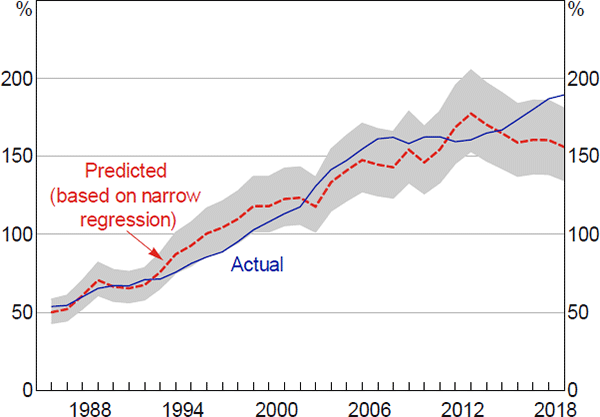
Note: Range reflects 95 per cent confidence interval for fitted values
Sources: ABS; Authors' calculations
What do these results imply for the riskiness of Australian household debt?
To some extent the results suggest that the rise in household debt has not created additional risk. For one, structural changes that increase the ability of households to afford more debt (specifically, higher incomes and lower inflation) can account for around one-third of the increase in the DTI ratio in Australia. Lower real interest rates and financial liberalisation can account for much of the remaining increase. It is possible that these last two factors have contributed to excessive borrowing that may be disruptively unwound in the future (either because the decline in real rates is partly cyclical or because the history of financial liberalisation is littered with examples of subsequent busts). However, the ability of the Reserve Bank to limit the pace of future increases in real rates and the considerable time elapsed since the pace of financial liberalisation slowed suggest these risks are small. On the other hand, our regression cannot explain the extent of increase in the DTI ratio over the past five years, suggesting that this additional borrowing may have brought some additional risk.
Our results also caution against drawing strong conclusions about Australian households being more at risk based on differences in DTI ratios across countries. In particular, the ownership structure of housing in Australia is not obviously associated with additional risk but has an important bearing on the level of the DTI ratio compared with other countries,[21] while higher incomes in Australia than elsewhere allow households to afford more debt relative to their incomes.
In light of these mixed results, we turn to a more direct assessment of the risks posed in Australia by current levels of indebtedness.
Footnotes
For example, in the United States, debt grew by around ¼ of a percentage point faster per annum than income in the 15 years from 1970 to 1985, and then by 2½ percentage points faster per annum in the subsequent 15 years. Estimates of total household debt are not available for Australia prior to 1984, but estimates of household debt owed to banks grew 6 percentage points faster per annum than income in the 15 years priors to 1985 and by 9 percentage points per annum faster in the subsequent 15 years. [5]
Examples include Meng, Hoang and Siriwardana (2013) for Australia and Aron and Muellbauer (2000) for South Africa, while Jappelli, Pagano and Di Maggio (2013) look at institutional factors that give rise to cross-country differences in indebtedness. [6]
It is of course possible to econometrically model joint decisions like this, but it adds unnecessary complexity. [7]
Details of how these variables are measured can be found in Appendix A. [8]
This spread is not directly related to households. However, it has been shown to be highly correlated with many interest rate spreads in the global economy. [9]
Inflation should not impact perceptions of the cost of debt unless households suffer money illusion. [10]
The use of a random effects estimator is supported by the results of a Hausman test. [11]
The Hausman-Taylor estimator deals with the potential endogeneity of variables using various transformations of the variables (within transformation of the X matrices, the time average of X1, and Z1) as instruments. Further details of the estimator can be found in Cameron and Trivedi (2005) or Wooldridge (2010). [12]
We choose the Phillips-Perron panel unit root test because we have an unbalanced panel and want to test whether all panels contain a unit root. Choi (2001) recommends using the inverse normal statistic produced by this test, which rejects the null hypothesis of non-stationarity at the 10 per cent level. Given the result is only weak, we also run a Pedroni test for panel cointegration of DTI ratio, real household income, financial liberalisation and nominal interest rates. We are able to reject the null hypothesis of this test at the 10 per cent level, implying that either each series is stationary or their combination is. [13]
In particular, there is an unusual pattern of coefficients when we include various combinations of age ranges within the prime working years, and including some of these makes the coefficient on the younger population insignificant. [14]
This assumes that the supply elasticity of housing is less than unity, so that prices fall by more than the increase in quantity of housing. A supply elasticity of less than 1 is often found, but not always (Caldera and Johansson 2013). [15]
The Hausman-Taylor estimator ensures our regressors are ‘weakly exogenous’ (that is, uncorrelated with the random effect), but not ‘strictly exogenous’ (that is, uncorrelated with the error term). Using a test for strict exogeneity suggested by Wooldridge (2010, p 325), which looks at the significance of the coefficient of the first lead (i.e. t + 1), we find that these two variables may be endogenous. [16]
The choice of GDP as an instrument for income rests on the observation that while the two are correlated (as is required), GDP is not in the denominator of the DTI ratio like household income is. Global interest rates will be an appropriate instrument for each country's rate to the extent that country's economy does not drive global financial conditions. [17]
As mentioned earlier, conventional tests suggest we do not have a problem with non-stationarity. [18]
The cross-sectional correlation between the DTI ratio and growth expectations is sizeable (0.45) and of the expected sign. [19]
Figure 6 uses coefficients from the narrow regression, after re-estimating without housing stock and urban density, both of which are insignificant and yet exert a large, counterintuitive effect on the results. Dropping these variables has little effect on the other coefficients, though that on ownership declines by about one-third in size. [20]
It is possible that households owning the rental stock is more risky than corporations doing so, given individual households are likely to be less diversified. [21]