Research Discussion Paper – RDP 2020-05 How Risky is Australian Household Debt?
1. Introduction
Household debt levels have increased considerably over the past 30 years, both in Australia and elsewhere. In Australia, and other countries with relatively high household indebtedness, this is consistently cited as a key risk to financial and macroeconomic stability. Concerns about the risks posed by household debt appear regularly in the press, and in reports from financial analysts and global institutions (such as the Bank for International Settlements and International Monetary Fund). These concerns have been heightened by the deep global contraction induced by COVID-19. As households across the world experience a significant drop in income, the extent of risk posed by the current levels of household debt will become more apparent.
These concerns are based on very clear evidence that ‘excessive’ levels of household debt give rise to serious financial stability concerns. For example, Mian and Sufi (2012) argue that almost 4 million of the 6 million jobs lost in the United States between 2007 and 2009 were because of an aggregate demand shock driven by weakening household balance sheets. Using a broader set of countries and a very long time series, Schularick and Taylor (2012) argue that accelerating growth in aggregate debt-to-GDP is the best predictor of future financial crises, especially when the starting level of indebtedness is high.[1] Similarly, Jordà, Schularick and Taylor (2013) and Mian, Sufi and Verner (2017) conclude that recessions preceded by rapid credit growth tend to be deeper than others, even when the financial sector remains solvent. Moreover, these outcomes appear to be primarily driven by high levels of household, not business, debt (Jordà et al 2013).
Measures of aggregate household indebtedness, however, are imperfect predictors of future stress. The most commonly used measure of household indebtedness is the debt-to-income (DTI) ratio.[2] At the onset of the 2008 global financial crisis, the DTI ratio had risen very rapidly and was at historically high levels in some countries that subsequently experienced significant financial stress (such as Ireland). But other countries that are now viewed as having had ‘too much’ household debt (e.g. Spain and the United States) did not stand out from others based on a comparison of DTI ratios, and some that had comparatively high levels of DTI ratios emerged from the crisis relatively unscathed (including Australia, the Netherlands, Norway and Switzerland).[3] This simple observation suggests that while an accelerating, or high, household DTI ratio can be a useful signal of rising risks to financial stability, the household DTI ratio is not a perfect measure of the risk of household debt. In particular, it does not capture other factors that indicate the riskiness of household debt. These factors likely include the distribution of debt, the quality of lending, institutional structures and the resilience of the financial system. This paper seeks to look more closely at the economic and financial stability risks posed by current levels of household indebtedness in Australia.
We address this in three ways. First, we look at what factors can account for the rise in household debt over time and its relative level across countries (Section 2 of the paper). The aim of this investigation is both to shed light on developments in indebtedness and to consider whether debt levels in particular countries at particular times can be attributed to fundamentally sound considerations or not. The advantages of this approach are that it uses a very broad scope of information to place current Australian household indebtedness in an international and historical context, and that it provides results that are intuitive to understand. However, it is not always clear which factors should be considered as ‘risky’ and which should be considered as ‘safe’ explanators of indebtedness. Moreover, our empirical approach does not allow us to be confident about exogeneity, so we cannot be certain that our results are causal.
Our second way of approaching this question is to examine the risks that Australia's current pattern of household indebtedness poses to the banking system (Section 3.1). We do this by simulating a period of severe economic stress and modelling the effect this has on the capacity of indebted households to service their debt (using household-level data). Households that are found to be unable to service their debt without falling below what is commonly considered to be minimum living standards are assumed to default on their loans, thereby eroding bank capital. This analysis allows us to move beyond aggregate measures of indebtedness and so take account of how the distribution of debt across households influences systemic risk. However, it still requires assumptions to be made about the capacity (and willingness) of households to service their debt. (A caveat is that we take a partial equilibrium approach in this work by largely abstracting from stress that would likely be present in banks' business loan books.)
The third way we consider this question is by examining how much current patterns of debt could amplify the effect of a large economic shock on consumer spending (Section 3.2). Our approach builds on Price, Beckers and La Cava (2019), who find that Australian households curtail their spending in normal times when they have relatively high levels of debt. We extend their work by simulating the effect that debt levels may have during periods of extreme stress. We do this by applying a stress scenario to household-level data and assessing how plausible variation across households in marginal propensities to consume (MPC) out of income (MPCy) and wealth (MPCw) would affect the resulting fall in consumer spending. We calibrate these MPCs from the large international literature estimated from the global financial crisis period, given that the absence of historical data on extreme financial stress in Australia makes it difficult to accurately estimate MPCs during periods of stress for Australia. This approach enables us to broaden the existing discussion of how household debt might pose risks to the economy, while still considering the effect of its distribution. It also allows us to apply the burgeoning international literature to the Australian context and learn from periods of stress elsewhere. The results we generate are not predictions of the likely path of consumption during a period of stress, but rather a means to understanding how the level and distribution of household debt in Australia might influence the vulnerability of the economy.
The results of these three approaches suggest that the risk posed by Australian household debt is material, but the household DTI ratio is a poor measure of the extent of risk. We find that the potential decline in consumption in response to a severe downturn in the Australian economy could be large, and possibly larger than commonly assumed in past bank stress tests. This is especially true if the consumption response of households to changes in their wealth is nonlinear (that is, larger when wealth is declining than when it is rising). Moreover, the sensitivity of consumption to severe shocks appears to have increased over the past decade or two, as indebtedness has risen. However, our analysis finds that the banks would likely be resilient to such a scenario because of the significant amount of collateral backing their mortgage lending (that is, the moderate loan-to-valuation ratios on most outstanding mortgages). Furthermore, the high level of household debt in Australia compared with other countries can be accounted for by the rental stock being almost fully owned by the household sector in Australia (unlike in many other countries where the debt underpinning rental properties is owed by businesses or government) and by Australia's relatively high average income. We also find that higher levels of income and lower nominal interest rates, as well as the deregulation of the financial sector, can account for most of the rise in Australian household indebtedness over the past three decades, with only a small portion of the rise in indebtedness being either unaccounted for or related to potentially more speculative factors.
A key focus of our results is on the distribution of debt across households, and how that influences its riskiness. Consistent with previous research (particularly Bilston, Johnson and Read (2015)), we find that debt is held by those that are well placed to service it. Highly indebted households tend to be well educated, thereby reducing their risk of experiencing unemployment, and have significantly higher-than-average income. They also seem to have only modest wealth as they tend to be younger-than-average, with less time to have accumulated wealth. These latter two observations have important implications for the sensitivity of consumer spending to adverse shocks to wealth. In particular, when we assume that the spending of highly indebted households is proportionately more sensitive to shocks to wealth we actually reduce the estimated decline in aggregate consumption during stress, because the absolute size of the loss of wealth held by highly indebted households is relatively small. Rather, the risks to consumer spending from a decline in wealth are greatest when we assume that older households (including self-funded retirees or those near retirement) are more sensitive to shocks to their wealth, given that older households hold a disproportionate share of total wealth. Such a calibration is consistent with both theory and the empirical literature, but is only incidentally related to rising indebtedness.[4] Working against this, we also show that the effect of wealth shocks on consumption is substantially increased if we assume that precautionary savings motives mean MPCs are larger for falls in wealth than for rises. Such an assumption is arguably most relevant for younger, highly indebted households who are more at risk of negative equity than others.
Our final result relates to how changes in the level and distribution of debt and wealth over time have influenced the sensitivity of aggregate consumer spending to wealth shocks. We find that a severe stress scenario would have a somewhat larger effect on consumer spending today than it would have had a decade or two earlier. This increased sensitivity of consumption to shocks arises because of a combination of increased household leverage, a shift in the composition of household assets towards more risky investments and distributional changes in consumer spending across households.
2. Why is Australian Household Debt High Relative to History and Other Countries?
Household indebtdness, as measured by DTI ratios, has risen considerably over the past 40 years, both in Australia and elsewhere (Figure 1). The increase in the Australian household DTI ratio has been more pronounced than in most other countries, rising from the bottom half of the distribution across advanced economies in the late 1980s to the top quartile by 2018. Data available for a subset of countries over a longer period of time show that the rise in global household DTI ratios accelerated around the mid 1980s.[5]
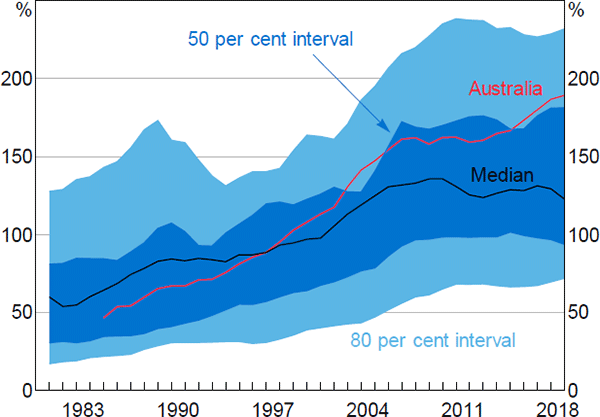
Notes: Sample of 22 advanced economies (see Appendix A for list); ratios backcasted to account for changes in sample over time
Sources: Authors' calculations; National agencies; OECD
The significant rise in indebtedness in most countries over recent decades naturally raises the question of how much risk this creates. This is particularly the case for Australia, where the DTI ratio has increased at a faster rate and to a higher level than in most countries. One way of approaching this question is to consider the factors that have contributed to the rise in countries' DTI ratios and why the DTI ratio is higher in some countries than in others. This approach is relevant because different explanations for the rise in household DTI ratios have different implications for vulnerabilities. For example, rising incomes or structurally lower nominal interest rates both allow households to borrow at higher DTI ratios without reducing their expenditure on other goods and services. Reflecting this, Kirkham and Burgess (2019) argue that current levels of UK household debt are ‘sustainable’ at prevailing rates of interest. Similarly, DTI ratios can be sustainably higher in countries that have structural features that either reduce the volatility of economic activity or the costs to the economy of borrower defaults, or if a larger portion of the housing stock (and associated debt) is held by households. However, if the rise in the DTI ratio over time has been driven by excessively optimistic expectations about the future returns on housing then this development has contributed to additional risks to financial stability. Other possible explanations for the rise in DTI ratios may create more nuanced implications for vulnerabilities. For example, financial deregulation in the 1980s and 1990s removed an inefficient impediment to borrowing, improving the access of creditworthy households to debt. To the extent that this allowed households to fund valuable investment in the housing stock, it is unlikely to have increased household vulnerability. But the history of financial deregulation shows that such changes have regularly triggered excessive growth in debt, often to fund higher spending on consumables, which subsequently ends badly (Mishkin 2007).
Given these considerations, this section addresses the question of how risky the Australian DTI ratio is by examining the factors that have contributed to the increase in global DTI ratios over recent decades and that explain why some countries have structurally higher DTI ratios than others. We do this using an (unbalanced) panel of 22 advanced economies covering the period from 1980 to 2018. This paper is not the first to empirically examine the factors underpinning household DTI ratios.[6] However, it is the first (to the best of our knowledge) that jointly addresses the time series and cross-sectional dimensions.
2.1 Data and Modelling Approach
A household's DTI ratio is the result of both the price of (housing and other) assets, relative to income, and the extent to which these assets are leveraged. However, asset prices and leverage are jointly determined at an economy-wide level – the house price level is both influenced by the availability of finance and has an influence on how much the household sector borrows. Given this, we choose to directly model the DTI ratio rather than separately modelling the determinants of asset prices and leverage.[7] It is also not possible to clearly separate variables into those that influence asset values and those that influence leverage. For example, lower interest rates will boost the equilibrium value of assets in a discounted cash flow model without leverage, but lower interest rates also allow households to take on more debt for a given level of repayments. Similarly, higher income will directly increase households' willingness to take on debt (since their ability to service that debt increases) and may indirectly increase the value of housing if there are limits to its supply. Over recent decades, both leverage and asset prices have risen in Australia and the United States, suggesting that our results will not be driven by just one of these (Figure 2).
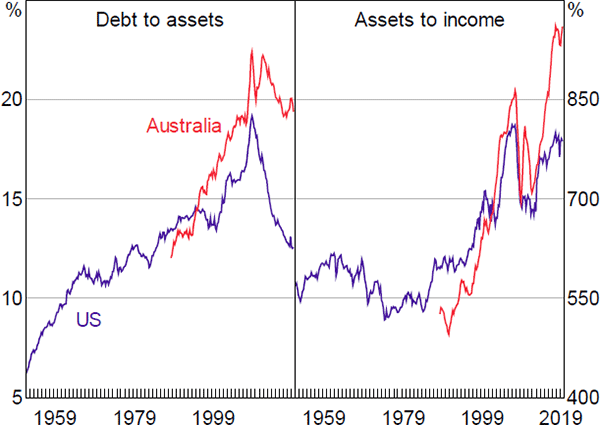
Sources: ABS; Board of Governors of the Federal Reserve System
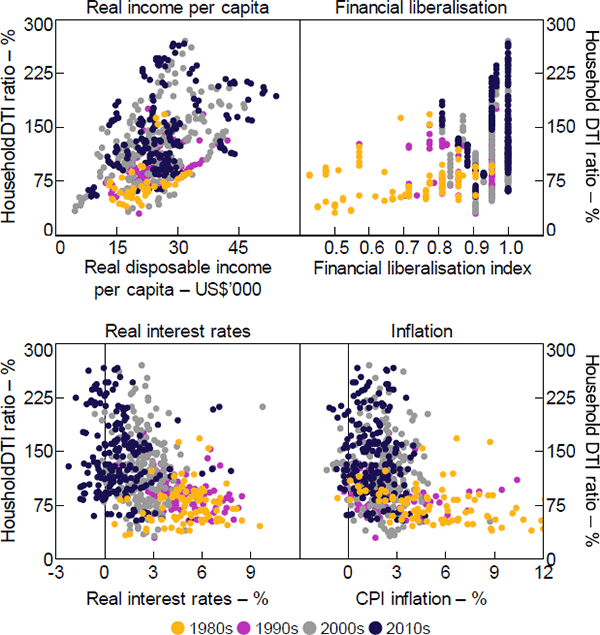
Taking account of theoretical models of household borrowing and the extant literature, we consider a range of potential explanators for household DTI ratios across time and countries. For the purposes of illustration, we consider these in six (not entirely exclusive) categories, relating to:[8]
- The cost of debt – including the real interest rate, the spread between BBB and AAA US corporate bonds (as a proxy for the pricing of risk),[9] and how (mortgage) debt is taxed (since that affects the after-tax cost of borrowing).
-
Households' borrowing capacity – this includes variables that affect banks' willingness and ability to lend, such as financial liberalisation and the strength of legal rights. For example, banks can be more willing to lend at higher loan-to-valuation ratios (LVRs) in countries where they are confident of their legal ability to seize collateral (Jappelli et al 2013). Ideally we would include maximum permissible LVRs as a more direct measure of banks' willingness to lend, but we unfortunately do not have any robust measures of this across countries or over time.
This category also includes variables that affect households' ability to service a loan, such as the inflation rate, (aggregate) real disposable income per capita, unemployment and inequality. Inflation is included under this category (rather than under cost of debt) on the basis that, in theory, its primary effect should be on the ability of a borrower to service a given-sized loan in the initial years after it is written (as argued by Debelle (2004), Ellis (2005) and Mishkin (2007)).[10] We include inequality on the basis that increased dispersion in household income reduces the ability of many households to borrow (Barba and Pivetti 2009), though inequality has also been argued to have boosted indebtedness in the United States (Mian, Straub and Sufi 2020b). We unfortunately do not have any robust indicators of permissable LVRs across countries or over time.
- Current demand for debt (at a given price) – including expectations of future income growth (which, if elevated, will encourage households to borrow to smooth income over their life) and the age structure of the population (motivated by life-cycle model predictions that young households are most likely to borrow).
- The current rental value of housing – this includes factors that influence household demand for housing, such as housing stock per capita, the elasticity of housing supply and growth in the urban population. It also includes factors that may restrict the responsiveness of housing supply, such as the share of the national population living in cities and the population-weighted density of those cities. These supply variables are the best available cross-country indicators of the sorts of supply constraints identified by Kendall and Tulip (2018) and others.
- Measures of the expected future value of housing (and hence capital gains) – including recent growth in real housing prices (as a possible proxy for expectations of future capital gains) and the largest peak–trough housing price fall experienced over the prior 10 years (as a proxy for perceived riskiness of housing).
- Ownership of the dwelling stock, including rental properties – this is included to capture the extent to which debt associated with housing investment is accounted for in the household or the corporate sectors.
Our variables of interest include both variables that change over time and some that are ‘time invariant’ (but do vary across countries). Some of our time-invariant variables in practice would vary over time, but they do so only slowly and we do not have data for them at different points in time. Given that, we require a random effects model to estimate coefficients on these time-invariant variables.[11] We also have some variables that are likely to be ‘weakly endogenous’ (in that they are correlated with unobserved factors influencing debt, and hence with the random effect), such as urban density, real disposable income, the real interest rate and financial liberalisation. To account for these things, we use the Hausman-Taylor (1981) estimator with the following basic structure:
where i indexes countries, t indexes time, the dependent variable is household debt relative to income and captures the vector of random effects. The matrix contains time-varying variables that are uncorrelated with , while contains time-varying variables that are possibly correlated with . The Z matrices contain variables that change very little (if at all) over time; any variables in are assumed to be uncorrelated with while variables in are assumed to be possibly correlated with .[12] All variables are assumed to be uncorrelated with the error, . Most variables enter in log form, with the exception of real interest rates, inflation, recent housing price growth and dummy variables.
We estimate the regression using the level of the DTI ratio, consistent with our motivation being to understand the risks arising from any given level of the DTI ratio. To test for stationarity, we use the Phillips-Perron panel unit root test. We are able to (weakly) reject the null hypothesis that all panels are non-stationary.[13]
While the Hausman-Taylor estimator corrects for potential endogeneity arising from correlation with the random effects, it cannot correct for any ‘strict’ endogeneity arising from correlation between our variables and the error term, . There are several variables that may possibly be endogenous. Most obviously this includes measures of housing prices, but could also include real interest rates, real income and financial liberalisation. (In contrast, other variables such as ownership of the housing stock, urbanisation, the strength of legal rights and housing supply are very likely determined by deep structural characteristics of each economy.) In Section 2.3 we conduct tests to try to identify any endogeneity and assess the potential bias arising. In some cases these tests leave us confident that we have identified unbiased, causal relationships, but in other cases we cannot be so sure. As a result, we cannot always confidently assert that the relationships we identify are strictly causal, and in our discussion we try to not overstate these results. It is also important to note that, while we have a long list of potential explanators, we still cannot rule out omitted variables. As a result, we cannot definitively claim to have identified the main explanators of the DTI ratio.
Descriptive statistics for our final list of variables are shown in Table 1, while a detailed discussion of their definitions can be found in Appendix A. Figures 3 and 4 show the relationship between the DTI ratio and a selection of these, using our cross-country panel.
| Variables | Mean | Standard deviation | Min | Max | |
|---|---|---|---|---|---|
| Debt-to-income ratio | 120.6 | 48.1 | 30.0 | 269.8 | |
| Time-varying | |||||
| Real income per capita (US$'000) | 25.4 | 8.7 | 4.7 | 53.3 | |
| Real interest rate (%) | 2.7 | 2.3 | −3.5 | 10.6 | |
| Inflation (%) | 2.3 | 2.3 | −5.8 | 29.0 | |
| Housing price growth (real, %) | 2.4 | 6.7 | −24.5 | 26.9 | |
| Max price fall (%) | 12.4 | 11.8 | 0.0 | 54.5 | |
| Urban population growth (%) | 1.0 | 0.6 | −0.5 | 4.0 | |
| Urbanisation (%) | 0.29 | 0.15 | 0.09 | 0.64 | |
| Housing stock per person (ratio) | 0.45 | 0.05 | 0.29 | 0.59 | |
| Financial liberalisation (index) | 0.92 | 0.10 | 0.43 | 1.00 | |
| ‘Time-invariant’ | |||||
| Ownership of housing (%) | 83.0 | 10.7 | 65.9 | 97.4 | |
| Strength of legal rights (index) | 6.0 | 2.8 | 2.0 | 12.0 | |
| Urban density (person/ha) | 74.6 | 41.7 | 26.6 | 192.4 | |
| Notes: Sample includes 22 advanced economies, with data collected since 1980 where possible; further details on the sample of countries and the construction and source of each variable can be found in Appendix A | |||||
Note: Circles represent countries where owner-occupier mortgage payments are tax deductible
Sources: Authors' calculations; National agencies
Sources: Authors' calculations; IMF; National agencies; OECD; World Bank
2.2 Results
Our preferred specification includes fewer variables than are discussed above, based on the fit of the model, the robustness of the coefficient and the need to limit the number of time-invariant metrics to obtain reliable coefficient estimates. (We discuss the coefficients on excluded variables below.) The results of our preferred specifications are shown in Table 2. This table has two closely related regressions. The first we term the ‘narrow’ regression as it includes only the 10 countries for which we have the variable measuring the share of the housing stock owned by households (‘ownership’). The second we term the ‘wide’ regression as it drops this variable and so expands the number of countries to 19. An additional regression excludes the urban density and housing stock variables, which are not available for three countries in our sample. The results of this (‘All countries’) are very similar to those for the wide regression.
| Variable | Narrow regression | Wide regression(a) | All countries(a) |
|---|---|---|---|
| Time-varying | |||
| Real income per capita(b) | 0.424*** (0.042) |
0.337*** (0.033) |
0.363*** (0.032) |
| Real interest rate(b) | −0.077*** (0.007) |
−0.034*** (0.004) |
−0.028*** (0.004) |
| Inflation | −0.047*** (0.007) |
−0.024*** (0.005) |
−0.020*** (0.005) |
| Housing price growth | 0.002 (0.001) |
0.000 (0.001) |
−0.002** (0.001) |
| Max price fall | −0.033*** (0.007) |
−0.031*** (0.006) |
−0.036*** (0.005) |
| Urban population growth | −0.031 (0.024) |
−0.026 (0.020) |
0.022 (0.019) |
| Urbanisation | −0.236 (0.192) |
0.095 (0.171) |
0.014 (0.123) |
| Housing stock per person(b) | 0.338 (0.498) |
1.944*** (0.243) |
|
| Younger population | 0.029** (0.012) |
−0.033*** (0.008) |
−0.049*** (0.006) |
| Older population | −0.014* (0.008) |
−0.024*** (0.007) |
−0.013** (0.005) |
| Financial liberalisation(b) | 0.892*** (0.153) |
0.274*** (0.100) |
0.639*** (0.087) |
| ‘Time-invariant’ | |||
| Ownership of housing | 1.491* (0.769) |
||
| Strength of legal rights | −0.031 (0.227) |
0.183 (0.237) |
0.275* (0.162) |
| Urban density(b) | 0.169 (0.250) |
−0.486 (0.347) |
|
| Number of observations | 262 | 427 | 525 |
| Number of groups | 10 | 19 | 22 |
| F-statistic | 103.4 | 154.3 | 186.9 |
|
Notes: *, ** and *** denote statistical significance at the 10, 5 and 1 per cent levels, respectively; standard errors are in parentheses |
|||
The coefficients on income per capita, the real interest rate, inflation and financial liberalisation are all significant and of the expected sign: higher real incomes and lower real interest rates or inflation are all associated with increased indebtedness of households, as is the deregulation of the financial sector since the 1980s. In addition, countries that have experienced a very large fall in housing prices at some point in their history have lower DTI ratios, consistent with agents in those countries being more cautious about the riskiness of borrowing to invest in housing. And countries in which more of the housing stock is owned by households (either as owner-occupiers or investors) naturally have higher household DTI ratios.
Our two proxies for the age structure of populations are also significant, but not consistent across regressions. According to the narrow regression, countries with a large share of their population aged 25 or less tend to have higher DTI ratios, consistent with people borrowing when young to bring forward future consumption from their peak earnings years. In addition, that regression shows that countries with a larger share of people aged over 65, who tend to have repaid their loans ahead of ceasing work, have lower DTI ratios. However, the coefficient on the share of the population that is younger switches sign in the wide and all countries regressions. More generally, we are cautious about overemphasising these results as the coefficients and conclusions to be drawn on the influence of age structure on DTI ratios are sensitive to which age ranges are included in the regression.[14]
In contrast, the number of dwellings per capita (‘housing stock per person’) has a positive coefficient in the wide regression (but is insignificant in the narrow regression). We would expect this variable to have a negative coefficient on the basis that additional supply of dwellings (relative to the population) would put downward pressure on dwelling prices and, in turn, debt.[15] But it is possible that the true relationship is positive if this supply effect is dominated by a choice among residents of a country to live in households with fewer people (specifically, income earners), which would lower household income by more than it lowers debt. This coefficient is only significant in the wide regression because of the broader sample of countries; it is not sensitive to just the exclusion of the ownership variable. We also investigated the relationship between DTI ratios and estimates of the elasticity of housing supply in each country as an alternative measure, but found no relationship.
Other variables – including growth in housing prices and/or population over recent years, urban density and urbanisation, and the strength of legal rights – are generally insignificant. (The strength of legal rights is, however, positive and significant in the all countries regression.) In some cases, the lack of significance could reflect poor proxies. For example, it may be that high but expected population growth can be met with additional housing supply, without inflating dwelling prices, or that it is the interaction between population growth and zoning restrictions that matter. (We tested for this first possibility by including the acceleration in population growth as a proxy for higher-than-expected population growth, but without success.) Similarly, growth in housing prices over the prior three years may be a poor proxy for households' expectations of future capital gains on housing, or it may be that the relationship between the DTI ratio and expectations takes a different functional form to what we specify (i.e. it may be related to the pace of growth in the DTI ratio, not its level). However, the insignificance of the density terms – both the extent of urbanisation and the density of major cities – is surprising, given previous work (e.g. Ellis and Andrews 2001). This result does not seem to be particularly sensitive to the inclusion of related variables. In particular, neither variable is significant when we exclude the other, housing stock per person and/or population growth.
2.3 Robustness Tests
Attempting to investigate the determinants of the levels of household DTI ratios across time and country is an ambitious task. Our choice of regressors is founded on a large body of theoretical and empirical literature but is not tightly linked to a micro-founded economic model. Moreover, our cross-country panel approach does not definitively address issues of the direction of causality, nor can it conclusively dismiss a range of potential econometric concerns.
In light of this, we conducted a range of robustness tests. The results of these tests are shown in Table 3. These tests do no overturn the main results discussed above:
- Column (1) of Table 3 shows results for when we allow for the possibility that real disposable income and real interest rates are not ‘strictly exogeneous’.[16] It does this by instrumenting for these variables using GDP per hour worked and the average interest rate in the United States, Germany and Japan.[17] We find the coefficients in our regression are qualitatively unaffected by using instruments for these two variables. In the small number of cases where there are notable changes, this results in a coefficient that was not significant becoming significant (i.e. recent housing price growth, housing stock per capita).
- Columns (2) and (3) test for omitted variable bias by adding country-specific time trends or time fixed effects.[18] The size of various coefficients are sensitive to these, but the only qualitative change is that the real interest rate and inflation become insignificant when including time trends, but not time fixed effects. Given the very strong theoretical basis to expect a negative coefficient on the real interest rate, in particular, we do not see this result indicating omitted variable bias.
- Columns (4) to (6) include a range of additional variables that are potentially determinants of the DTI ratio. In some cases (income growth expectations and taxation laws) these variables are excluded from our main regression due to concerns about the quality of our proxies, not because we believe they are unimportant. The results when these are included lend support to that prior. The coefficient of income growth expectations (which are proxied using Consensus Economics forecasts of real GDP growth about 18 months earlier) has a sign that is contrary to theory, perhaps driven by the structural decline in GDP growth over recent decades.[19] Similarly, our crude proxies for whether countries allow owner-occupier mortgage costs to be deducted from tax or capital gains on housing to be concessionally taxed are not significant influences of the DTI ratio. However, we do find that offering capital gains tax concessions for housing is associated with a greater responsiveness of the DTI ratio to falling nominal interest rates. (That is, the interaction between our tax dummy variable and nominal interest rates is significant.) These results are consistent with such arrangements raising the incentives to increase leverage in an environment of falling interest rates and rising house prices.
| Variable | Baseline | (1)(a) | (2) | (3) | (4) | (5) | (6) |
|---|---|---|---|---|---|---|---|
| Time-varying | |||||||
| Real income per capita(b) | 0.424*** | [0.785]*** | 0.075*** | 0.269*** | 0.430*** | 0.324*** | 0.389*** |
| Real interest rate(b) | −0.077*** | [−0.097]*** | −0.006 | −0.053*** | −0.079*** | −0.064*** | −0.077*** |
| Inflation | −0.047*** | −0.062*** | 0.002 | −0.039*** | −0.049*** | −0.032*** | −0.041*** |
| Housing price growth | 0.002 | 0.004** | 0.001* | −0.001 | 0.001 | 0.003** | 0.003*** |
| Max price fall | −0.033*** | −0.019** | −0.025*** | −0.034*** | −0.034*** | −0.034*** | −0.042*** |
| Urban population growth | −0.031 | −0.122*** | 0.009 | −0.002 | −0.002 | 0.005 | −0.008 |
| Urbanisation | −0.236 | −0.580 | −1.845*** | −0.304 | −0.277 | 0.251 | −0.021 |
| Housing stock per person(b) | 0.338 | 1.327** | 3.178*** | −0.100 | 0.421 | 1.538*** | 0.338 |
| Younger population | 0.029** | 0.087*** | 0.070*** | 0.021* | 0.015 | 0.017 | 0.003 |
| Older population | −0.014* | −0.015 | −0.052*** | −0.026* | −0.029*** | 0.001 | −0.025*** |
| Financial liberalisation(b) | 0.892*** | 0.693*** | 0.232** | 1.155*** | 0.960*** | 0.729*** | 0.838*** |
| Income growth expectations | −0.042* | ||||||
| Unemployment rate | 0.005 | 0.022*** | |||||
| Baa-Aaa spread(b) | 0.001 | 0.013 | |||||
| ‘Time-invariant’ | |||||||
| Ownership of housing | 1.491* | 2.198** | 4.800** | 1.300* | 1.535** | 0.813 | 1.264 |
| Strength of legal rights | −0.031 | 0.030 | 0.952* | 0.044 | −0.003 | −0.927** | −0.129 |
| Urban density(b) | 0.169 | −0.065 | 0.437 | 0.263 | 0.102 | −0.501 | 0.237 |
| Inequality | −1.525*** | ||||||
| Interest tax deductible | −0.084 | ||||||
| Capital gains taxation | 0.824* | ||||||
| Time variables | Country trends | Fixed effects | |||||
| No of obs | 262 | 262 | 262 | 262 | 241 | 236 | 260 |
| F-statistic | 103.4 | 62.7 | 319.2 | 43.0 | 66.2 | 127.2 | 94.8 |
|
Notes: *, ** and *** denote statistical significance at the 10, 5 and 1 per cent levels, respectively; shaded cells highlight differences between regressions (a) Income per capita and real interest rate are instrumented in this regression, this is shown by including square brackets around their coefficients |
|||||||
2.4 Implications for Debt Levels across Countries and Time
Our baseline coefficients can be used to imply something about the factors that account for the rise in DTI ratios over time. What follows uses coefficients from the narrow regression, but the results do not materially differ using the wide coefficients.
For Australia, almost all of the 125 percentage point rise in the DTI ratio between 1988 and 2018 can be attributed to the effect of lower real interest rates and inflation, financial liberalisation and higher real incomes (Figure 5). These same factors also account for the rise in DTI ratios in other countries, but the apparent contribution of lower real interest rates is significantly larger than for Australia, while the contribution of the other three (especially real incomes) is materially lower.
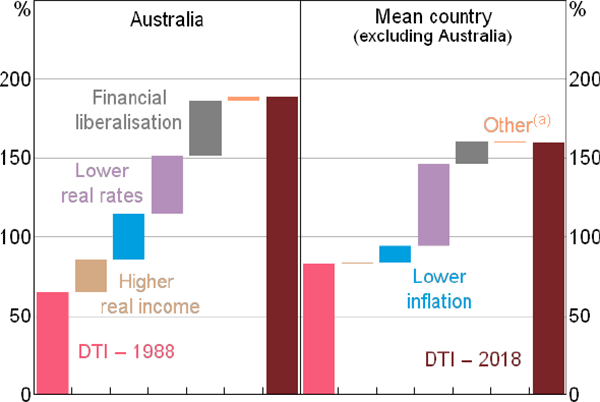
Note: (a) Includes small contributions from other variables and error term
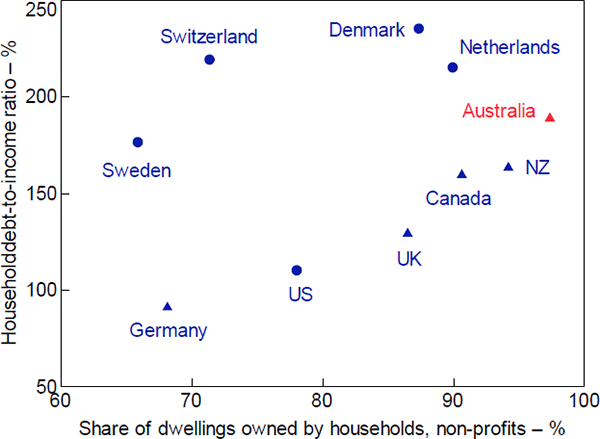
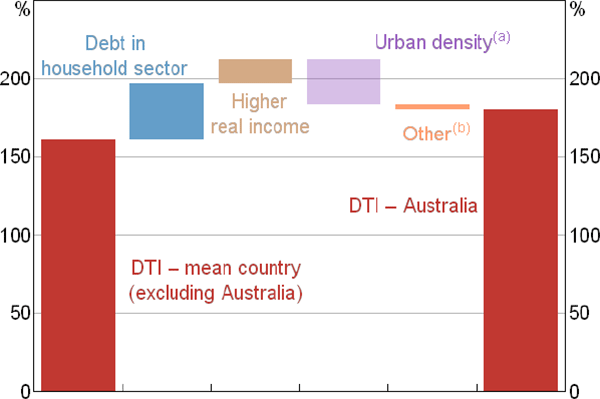
The coefficients can also be used to imply what factors account for the higher level of the DTI ratio in Australia than elsewhere. (We compare debt levels in 2016 because our sample of countries declines in 2017 and 2018.) The most influential of these is who owns the housing stock (Figure 6). In Australia, almost all of the housing stock is owned by households while, at the other extreme, this share is less than two-thirds in Sweden. These differences mostly reflect the ownership of the rental stock, which in Australia is owned directly by households but in many European countries is owned by the government, co-operatives or corporations. (It does not reflect differences in the owner-occupier home ownership rate, which in our sample are relatively small.) As a result of this, almost all of the debt used to finance housing in Australia is owed by the household sector, while the share is much lower in a number of other countries. Another factor that contributes to Australia having a higher DTI ratio is its higher real incomes. In contrast, the coefficients on urban density implies that Australia's urban structure materially reduces the DTI ratio in Australia compared with other countries (though the coefficient on this is insignificant).[20]
Notes:
(a) Coefficients on this variable are insignificant
(b) Includes random effect and error term
The factors included in our regression explain most of the rise in the DTI ratio over time and the differences across countries. For Australia, this is particularly true over the period from 1985 to around 2014 (Figure 7). However, the rise in Australian household DTI ratios since 2014 has been larger than is explained by our regression.
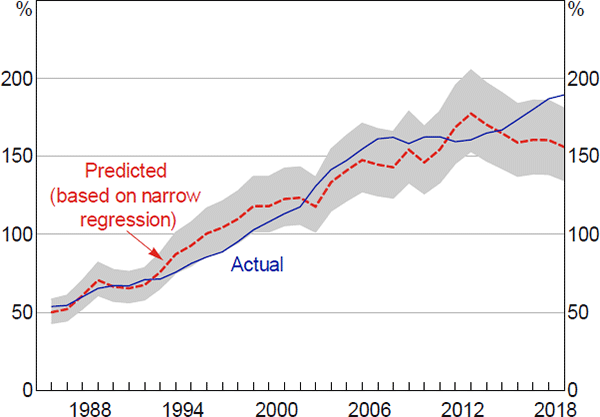
Note: Range reflects 95 per cent confidence interval for fitted values
Sources: ABS; Authors' calculations
What do these results imply for the riskiness of Australian household debt?
To some extent the results suggest that the rise in household debt has not created additional risk. For one, structural changes that increase the ability of households to afford more debt (specifically, higher incomes and lower inflation) can account for around one-third of the increase in the DTI ratio in Australia. Lower real interest rates and financial liberalisation can account for much of the remaining increase. It is possible that these last two factors have contributed to excessive borrowing that may be disruptively unwound in the future (either because the decline in real rates is partly cyclical or because the history of financial liberalisation is littered with examples of subsequent busts). However, the ability of the Reserve Bank to limit the pace of future increases in real rates and the considerable time elapsed since the pace of financial liberalisation slowed suggest these risks are small. On the other hand, our regression cannot explain the extent of increase in the DTI ratio over the past five years, suggesting that this additional borrowing may have brought some additional risk.
Our results also caution against drawing strong conclusions about Australian households being more at risk based on differences in DTI ratios across countries. In particular, the ownership structure of housing in Australia is not obviously associated with additional risk but has an important bearing on the level of the DTI ratio compared with other countries,[21] while higher incomes in Australia than elsewhere allow households to afford more debt relative to their incomes.
In light of these mixed results, we turn to a more direct assessment of the risks posed in Australia by current levels of indebtedness.
3. Stress Testing Household Debt
In assessing the risks posed by debt, it is important to consider the distribution of debt, not just the aggregate level. For example, banks are more vulnerable to losses if debt is held by borrowers who are financially constrained, more prone to shocks or have fewer assets. Many studies have also argued that the distribution of debt can affect the sensitivity of consumption to shocks to income and wealth (Mian, Rao and Sufi (2013), among others). Thus, in this second part of the paper, we use household-level stress tests to assess to what extent Australia's current distribution of debt affects its sensitivity to shocks. We examine the impact of a severe hypothetical macroeconomic shock in two ways, first on the banking sector and second on the Australian economy more broadly.
The first approach estimates the losses that the banking sector would suffer on their exposures to households, by stressing household balance sheets and income (Section 3.1). This approach updates the Bilston et al (2015) household-level model for Australia and is similar to other models used in Canada (Peterson and Roberts 2016), the euro area (Gross and Población 2017) and Austria (Albacete and Fessler 2010).
The second approach is more novel and assesses how the presence of (and increase in) debt may affect households' consumption in a period of stress (Section 3.2). This is motivated by a recognition that, while much has been done over the past decade to make the banking sector more resilient, it could still be the case that the household sector has simultaneously become more susceptible to shocks as household debt has increased.
Both approaches use the same severe hypothetical stress scenario that is similar in magnitude to previous bank stress tests in Australia. (In particular, those conducted by the Australian Prudential Regulation Authority (APRA) in 2014 and 2017 (Byres 2018), and by the International Monetary Fund for Australia's 2018 Financial Stability Assessment Program (IMF 2019).) The scenario involves employment falling by 8 per cent and housing prices falling by 40 per cent (Table 4). We believe this is an extreme but plausible scenario, which is broadly in line with the shock experienced by some countries during the global financial crisis.[22] The employment fall is similar to the fall Australia experienced during the 1990s (7 per cent fall in employment-to-population ratio) and during the COVID-19 pandemic (7 per cent fall as of June 2020), but is significantly more extreme than during the global financial crisis. The housing price fall considered is more extreme than the 1990s (20 per cent fall in real housing prices) and during the global financial crisis, but is comparable to falls experienced in countries that were heavily affected by the crisis, including the United States (32 per cent fall), Spain (37 per cent fall) and Ireland (55 per cent fall).
| Change | |
|---|---|
| Income related | |
| Employment (%) | –8 |
| Investment income (%) | –30 |
| Bonus and overtime income (%) | –50 |
| Lending rates (ppt) | 0 |
| Wealth related | |
| Asset prices (%) | |
| Housing | –40 |
| Equities | –40 |
| Superannuation(a) and trust funds | –30 |
| Other | 0 |
|
Note: (a) Average change, change depends on household age profile given different returns on different asset classes |
|
Our framework is partial equilibrium and thus does not directly capture potential effects of monetary and fiscal stimulus (except for higher unemployment benefits when an individual loses their job). This approach is appropriate for two reasons. First, the economic outcomes in the scenario already implicitly incorporate historical policy responses because we benchmark to episodes where stimulus was implemented (for example, US policy rates fell by 5 percentage points in the global financial crisis, and Australian policy rates fell 10 percentage points in the 1990s recession). Second, our main focus is in comparing how the distribution of debt affects the outcomes for a given scenario rather than in the magnitude of stress per se. Third, the ability of banks to lower lending rates with the policy rate could be compromised in this scenario if declining capital ratios result in increased funding costs stemming from greater perceived riskiness.
Shocks are applied in a single-period framework with changes occurring instantaneously. The impact of the shock can then be estimated by comparing pre- and post-shock default rates, loan losses and consumption. This simplifies the exercise and is appropriate since temporal dynamics should not alter the fundamental question of whether debt influences the extent of stress for banks and households. However, it is sensible to interpret this shock over a horizon of 2–3 years given that this is when stress test scenarios normally reach their peak intensity (Borio et al 2014).
We use household-level data for 2015–16 from the Survey of Income and Housing (SIH), which is collected by the Australian Bureau of Statistics and covers 17,768 households. This differs from Bilston et al (2015), who used the Household, Income and Labour Dynamics in Australia (HILDA) Survey. We use the SIH because it contains more granular loan data and can be matched with the Household Expenditure Survey (HES) for more accurate consumption data. It also contains additional person- and loan-level data. Furthermore, the longitudinal features of the HILDA Survey are not relevant for this work. Our results are little different when we use the 2017–18 SIH data, but we do not use these as our default data because the lack of concurrent HES data makes it infeasible for many of the questions we ask.
The magnitude of the fall in the value of each household's assets depends on their allocation among the different types of assets and the change in asset prices in Table 4. Similarly, each household's income fall is based on shocks to their variable income (from investments, bonuses and overtime) and whether members of the household lose their job, in which case their income falls to an estimate of the unemployment benefits for which they qualify.[23]
To determine which individuals lose their job, we first use a person-level probit model to regress unemployment propensity on a range of variables (see Appendix B). These include demographic factors (such as age, education, income, location of residence and ethnicity), whether the person was previously unemployed and whether the person has a mortgage (as a proxy for characteristics which may reduce their chance of unemployment and which are observable to the bank, but which are not recorded in the survey). The regression uses 33,913 person-level observations from the SIH (though only 20,785 are in the labour force). Crucially, this is a reduced-form predictive model and is not designed to draw causal inferences. The unemployment probabilities are then scaled to match the pre-specified aggregate fall in employment in our scenario, with post-stress results presented as the average of 1,000 Monte Carlo simulations using these probabilities. Income shocks at the person level can then be aggregated up to the household to calculate the change in household income.
3.1 Banking Sector Resilience
To assess the impact of the macroeconomic stress event on household defaults and so on the banking sector, we use the approach of Bilston et al (2015). This firstly involves calculating the financial margin (FM) for each household:
where Y is household disposable income, DS is minimum debt-servicing costs (if any), MC is minimum consumption, R is rental payments and j indexes households. We assume that if a household's financial margin becomes negative in the stress scenario, it defaults on its debt obligations within the 2–3 year time horizon (if its LVR at the time of default is above 90 per cent).[24] This may overstate the default rate because some households may have sufficient liquid assets or prepayment buffers to avoid default. We consider these buffers in an extension. We also assume that borrowers with a current LVR less than 90 per cent are able to self-cure by selling the property and so do not default causing losses for the lender.[25]
Minimum debt-servicing costs (DS) include a household's minimum required mortgage repayments based on applying a credit foncier model to the loan balance, reported interest rate and term of each household's housing loans.[26] We use a measure of minimum required repayments, rather than actual repayments, because many Australian households pay more principal than required in normal times and can stop making these additional repayments if they experience financial stress. Debt-servicing costs also include interest payments on personal and credit card debt, and we assume households also repay 2 per cent of the principal on these additional loans each year.
Minimum consumption (MC) is based on the Household Expenditure Measure (HEM), which is the minimum living expenses measure used by the Australian banks in assessing loan serviceability metrics.[27] The measure increases with family size and income and is based on a household's spending equalling the median household's expenditure on ‘absolute basics’ and the 25th percentile of spending on ‘discretionary basics’. We use a measure of minimum consumption, rather than actual consumption, as when faced with income loss households could meet their debt obligations by reducing their discretionary spending.[28]
Our ultimate aim is to calculate the share of household debt that is at risk, as a proxy for loan losses at banks. To do this, we calculate the value of debt held by defaulted households and subtract the collateral value from housing (after applying the asset price shocks from the macroeconomic scenario). We also assume banks suffer foreclosure costs of 10 per cent of the loan (such as legal fees, broker fees and property taxes), consistent with past studies (Qi and Yang 2009; IMF 2019).
3.1.1 Results
The macroeconomic scenario leads to household debt-at-risk as a share of housing debt increasing by only a small amount, from 0.8 per cent to 2.1 per cent (Figure 8).[29] Foreclosure costs account for about ½ percentage point of that increase. These estimates are low because housing loans account for the majority of household debt in Australia and these tend to be very well collateralised. Many high LVR loans in Australia are also covered by lenders mortgage insurance (LMI), which also reduces bank losses. Without LMI protection losses would be about 1 percentage point higher.[30] The debt-at-risk estimate is a little lower in magnitude to mortgages loss rates in recent stress tests by regulators in Australia, Canada, the United Kingdom and the United States. However, the estimate is substantially lower than actual loss rates in Ireland and the United States during the global financial crisis. This is mainly because Australian mortgages have low LVRs by international and historical standards. For example, less than 10 per cent of new Australian loans are written at LVRs above 90 per cent compared to close to 50 per cent of new loans in countries that experienced a boom-bust cycle during the financial crisis (Kelly, Le Blanc and Lydon 2019).
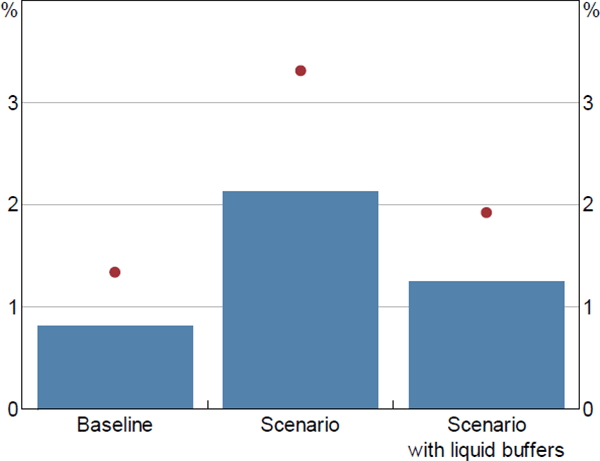
Note: Dot excludes protection from lenders mortgage insurance
Sources: ABS; Authors' calculations; Melbourne Institute
The losses are also low because debt tends to be held by households who are well placed to service it, consistent with previous research (particularly Bilston et al (2015)). Highly indebted households tend to have lower estimated probabilities of unemployment and higher incomes. This means they are less likely to experience income shocks that will reduce their ability to meet mortgage repayments.
It is possible that our results overstate the extent of debt-at-risk because of some simplifications in our approach. For example, debt-at-risk is considerably reduced if we assume households can draw down on their pool of liquid financial assets (such as offset accounts, deposits and equities) to avoid default.[31] Stress would also be further alleviated if lending rates fell.
When we incorporate these loan loss estimates into the RBA bank stress testing model (see RBA (2017) for more details of the model) banks remain above their capital conservation buffer of 8 per cent, even when assuming loans are not protected by LMI. Of course, household loans only comprise 40 per cent of banks' total assets. If we assume banks are also exposed to losses on banks' other portfolios (such as business loans, securities and other assets), equivalent in magnitude to recent APRA stress tests, banks' capital ratios fall to around the top of their capital conservation buffer. This suggests that the Australian banking system remains robust to losses stemming from rising household debt, largely because they participate in very little high LVR lending and are well capitalised. This result is consistent with past Australian stress tests and academic work (Bilston et al 2015; Rodgers 2015; Byres 2018; IMF 2019).
3.2 The Resilience of Household Consumption
Even when the banking system remains sound, high debt may still affect the sensitivity of the broader economy to shocks through its effect on the resilience of household consumption. There are two shocks that can cause consumption to decline: reduced income and reduced wealth.
The mechanics of the income channel are well established and understood: if a recession causes household income to fall, this reduces households' lifetime income and they curtail their consumption in response (Friedman 1957). This effect will be amplified if the fall in income is permanent, there is increased uncertainty about the future (Carroll 1992) or if a proportion of households are liquidity constrained (Kaplan and Violante 2014).
The wealth channel has considerable empirical support, but its theoretical foundation is still debated. Sinai and Souleles (2005) argue that there should be no (or limited) effect on consumption from changes in housing wealth because households are perfectly hedged against future housing price changes through their consumption of housing services. Others account for the empirical evidence of wealth effects by suggesting that this relationship is instead capturing the effect of changing expectations for future income or cycles in housing transaction volumes, both of which are correlated with wealth. However, Campbell and Cocco (2007) present evidence that is consistent with these wealth effects being due to more than just an omitted variable. In particular, they show that the positive consumption response to wealth from older home owners is not offset by a negative response from young renters, whose consumption seems to be impervious to changes in housing prices.
A growing body of research also shows that debt amplifies wealth effects, starting with Gertler and Bernanke's (1989) observation that collateral constraints are relaxed when house prices rise.[32] More recently, Guerrieri and Lorenzoni (2017) and Berger et al (2018) show theoretically that even households who are able to refinance might increase their precautionary savings in recognition of the risk that their borrowing constraint could bind in future. Consistent with this, Dynan and Edelberg (2013) show that indebted households in the United States reported a greater reduction in risk tolerance and a more pronounced jump in concerns about their ability to sustain spending than other households during the global financial crisis. And a large body of work, across a wide range of countries, has shown that the decline in consumption relative to wealth (that is, the MPCw) during the financial crisis of 2008–09 was larger for households that had higher initial leverage.[33] Baker (2018) and Athreya et al (2019) argue that at least some portion of this reflects that more highly indebted households tend to also be liquidity constrained, though this finding may be US-specific given the larger role that refinancing plays in the United States.[34]
Our approach differs from these papers in that we simulate a hypothetical stress test using a scenario that is more severe than that experienced by Australia during global financial crisis. To our knowledge, no other paper has taken such an approach. We do this because of our belief that the absence of very large shocks to Australian households in recent decades, combined with possible nonlinearities in the response of households to shocks, means that we cannot use empirical estimates of the potential pullback in consumption during severe stress. Because of this, we take estimates from past international research where large shocks have occurred (such as Mian et al (2013)) and use these to calibrate a model of consumption, rather than attempting to estimate the debt amplifier effect using Australian data. This helps us understand whether high and increasing debt could amplify aggregate falls in consumption during severe downturns.
Our stress test uses the same household-level database as in the preceding section and the same macroeconomic scenario as used in that section (Table 4). In order to estimate the effect on consumption, we need data on each household's income, debt, wealth and consumption. The SIH data, which were used in the preceding section, can be matched with the HES – the key survey of household consumption used to determine weights in the consumer price index – to allow a matching of income and wealth with spending. Combining these datasets results in a smaller sample of 10,046 households, but the sample remains representative of national aggregates (for income, wealth and expenditure) and there is no obvious selection bias as to which households from the SIH do not fill in the HES.[35]
An important consideration is whether households' consumption is affected by their superannuation (pension) assets. In calculating the change in wealth from the scenario, we assume that younger households are not sensitive to changes in their superannuation, given that it is many years before they will be able to access this wealth. Specifically, we assume that wealth sourced from superannuation is only included in households' assets if the household head is over 40 years old, and it is vested linearly until they are 60 years old.[36]
Our approach then involves calculating the change in consumption for each household, j:
where and are the respective changes in income and wealth from the stress scenario, and MPCY and MPCW are the marginal propensities to consume from income and wealth. This is then aggregated to get the change in economy-wide consumption. We also assume that households consume at least the amount given by the HEM used by banks when assessing loan serviceability, which accounts for the fact that some basic level of consumption is required for living. This acts to constrain the fall in consumption for a given household.
A central element of our stress test is the MPCs we assume for various households. As a baseline, we firstly consider a uniform scenario where all households have the same MPCs.
We benchmark the average MPCw of the population to 3 cents to the dollar based on past Australian studies. In particular, May, Nodari and Rees (2019) review the literature and find that elasticities are more stable through time than MPCs, and thus we construct our benchmark based on elasticities. We consider a housing wealth elasticity of approximately 0.16 and financial wealth of 0.12, consistent with the most recent estimates.[37] This leads to an MPC from housing wealth of 2.5 cents, an MPC from financial wealth of 5 cents and an overall MPCw of 3 cents. These are long-run estimates and are therefore consistent with a 2–3 year horizon.[38]
We benchmark the average MPCy to 55 cents to the dollar, based on May et al (2019). Estimates of MPCy in Australia vary widely, depending on methodology and whether it is based on macro or micro data. Our calibration is a little lower than Berger-Thomson, Chung and McKibbin (2009) which estimated MPCs of 0.6 to 1.0, but higher than other studies (Leigh 2012; Carroll et al 2017).
Having established a baseline, we then consider a scenario where we allow a correlation between MPCs and debt across households, while ensuring that the average MPC of the population is the same as in the baseline scenario. For this scenario, we calibrate the correlation between MPCs and debt based on previous research. For wealth, we assume a 100 basis point increase in leverage (debt relative to assets) leads to a 2 cent increase in the MPCw, based on Mian et al (2013). For income, we rely on Baker (2018) which finds a 100 basis point increase in the DTI ratio leads to a 6.2 cent increase in the MPCy.[39]
We consider other calibrations and extensions later on.
3.2.1 Uniform MPCs
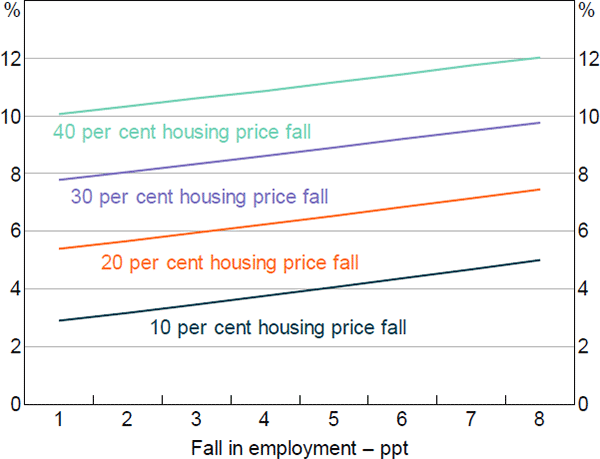
In the baseline stress scenario with uniform MPCs, there is a substantial fall in consumption of 12 per cent. Given the one-period nature of the framework, the change in consumption is best thought of as a 12 per cent peak-to-trough fall in real consumption per capita. Furthermore, the share of households consuming at the subsistence level increases from 13 per cent to 24 per cent when the shock is applied.[40] The scale of the shock in the scenario is somewhat arbitrary and so we also show the fall in consumption for a range of falls in employment and housing prices (Figure 9). This highlights that for the range of outcomes chosen, consumption is more sensitive to the fall in housing prices than the increase in unemployment.
The fall in consumption is much larger than those embodied in previous stress tests by APRA and the IMF in Australia which also involved severe recessions. It is also moderately larger than Ballantyne et al (2019), even when controlling for monetary stimulus. It is difficult to reconcile the differences, though it may reflect the uncertainty around modelling stress scenarios that are well out of the range of observed historical outcomes (including the presence of nonlinearities). We take comfort that these baseline results are not sensitive to the micro-simulation approach, since the wealth effects are a similar magnitude to those from back-of-the-envelope calculations using aggregate data from the ABS's Household Income and Wealth publication (ABS Cat No 6523.0).
Note: Other asset shocks adjusted commensurately to housing price adjustments
Sources: ABS; Authors' calculations; Melbourne Institute
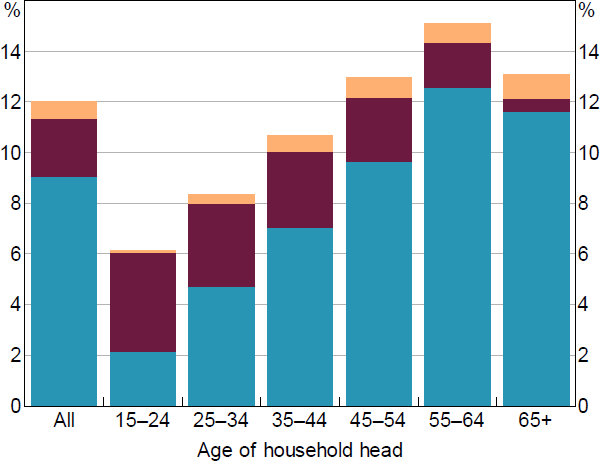
Roughly three-quarters of the consumption fall can be attributed to wealth effects, with the vast majority of this resulting from housing wealth (Figure 10). For households over 40 years old, about 20 per cent of the wealth effect is attributed to changes in superannuation assets. The rest of the fall in consumption is driven by income shocks. The fall in investment income, bonuses/overtime income and wage income are all of roughly equal magnitude.
It is interesting that the wealth effect in this model is larger than the income effect for any fall in housing prices greater than 10 per cent. This partly reflects that wealth shocks affect a larger share of the population (that is, any household with assets, compared to the income shocks which only affect workers who lose their job or receive variable income).[41] Thus, while unemployment, which is concentrated among a small subset of the population, tends to be a key driver of bank losses, it appears to be a less important driver for consumption in our stress scenario (at least in terms of its direct effect).
The model exhibits the expected effects across household types. For example, younger households are more sensitive to changes in income than in wealth, and this pattern reverses as households accumulate wealth. In the model, younger households are also more likely to become unemployed than older households, as expected.
Note: For uniform scenario where housing prices fall by 40 per cent and employment falls by 8 per cent
Sources: ABS; Authors' calculations; Melbourne Institute
3.2.2 MPCs correlated with debt
The focus of our consumption stress test is to see how different the estimated fall in consumption would be with MPCs that are positively correlated with household leverage or indebtedness. By design, this means that more leveraged households experience a larger fall in consumption than the baseline, and conversely that less leveraged households have a smaller fall (as seen in Mian et al (2013)). Critically, we ensure that the weighted average MPC stays the same as in the baseline scenario in order to focus on distributional effects rather than a general rise in MPCs.
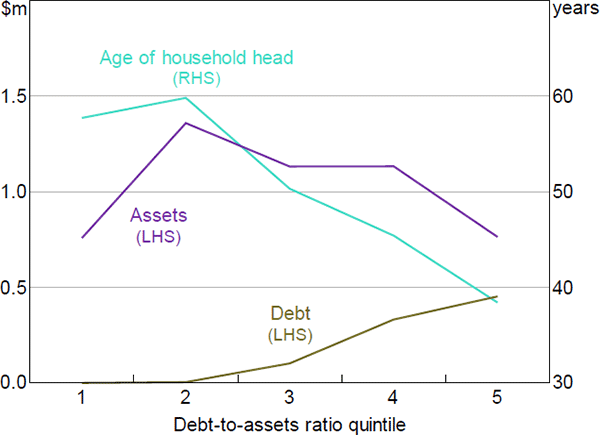
We find that aggregate wealth effects are slightly (but not meaningfully) smaller when MPCs are correlated with debt. The larger fall in consumption for highly leveraged households is more than offset by the smaller fall in consumption for lower leveraged households. A key reason for the overall result is that highly leveraged households tend to be less wealthy (have fewer assets) and younger (Figure 11). In contrast, lower leveraged households tend to be older households who have more assets and have been able to accumulate wealth and repay their debt over their lifetime.[42] The implication is that with MPCs increasing with leverage, the households that are most responsive to wealth shocks have little wealth to lose, while those experiencing the largest absolute falls in wealth are relatively insensitive to it.
Sources: ABS; Authors' calculations
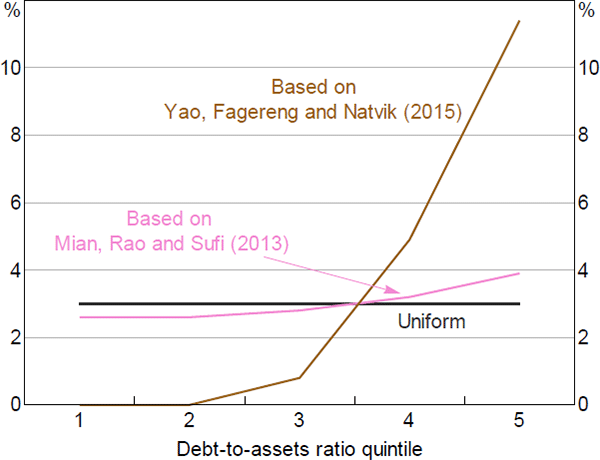
This point is illustrated more starkly when we increase the sensitivity of MPCs to leverage. Here we calibrate based on estimates from Yao, Fagereng and Natvik (2015) rather than Mian et al (2013). Using Norwegian data, they estimate that a 100 basis point increase in leverage leads to a 20 cent increase in the MPC from wealth, (compared to 2 cents in our original case). The MPCs calibrated from their results are shown in Figure 12. When we adopt this greater heterogeneity in our model, we find that wealth effects are smaller.[43] The overall fall in consumption is 11 per cent, compared to 12 per cent in the baseline. This is because the effect of the age dynamic outlined in Figure 11 becomes more pronounced in this specification – less leveraged households that tend to have higher assets see a smaller fall in consumption that more than offsets the larger falls by more leveraged households. This highlights that concentrating risks to a subset of the population tends to reduce the economy-wide effects on consumption.
The remainder of this section considers three extensions to reconcile our findings with other work. We consider how our results change if MPCs vary with age, if households respond asymmetrically to negative shocks and if households are liquidity constrained. The results are shown in Figure 13. We then consider how the evolution of debt has changed the sensitivity over time.
Sources: ABS; Authors' calculations
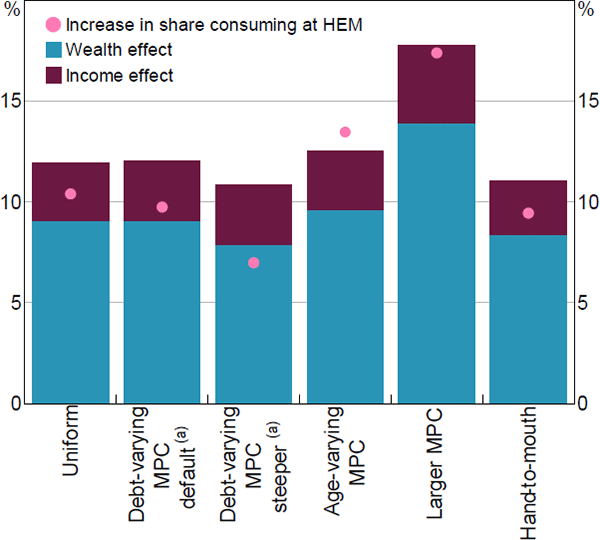
Note: (a) ‘default’ based on Mian, Rao and Sufi (2013) and ‘steeper’ based on Yao, Fagereng and Natvik (2015)
Sources: ABS; Authors' calculations; Melbourne Institute
3.2.3 MPCw correlated with age
One key reason why assuming MPCs rise with leverage does not lead to a larger fall in aggregate consumption is because less leveraged households (who we assume have lower MPCs) tend to be older (i.e. retirees), with a larger stock of assets than highly leveraged households. However, several studies have found that the MPCw is typically higher for older households (Campbell and Cocco 2007; Calomiris, Longhofer and Miles 2012). To assess the implications of this, we allow MPCs to rise with household age and estimate the effect on consumption. It may be that older households (and, in particular, self-funded retirees) respond differently to changes in wealth than employed households, since their wealth is also their key source of income generation. In other words, self-funded retirees typically finance their spending through asset returns or by drawing down on their assets over time, rather than employment income. This may mean their consumption may be more sensitive to changes in their wealth, that is older households may actually have higher MPCs than those based on indebtedness from Mian et al (2013).
As before, we anchor the average MPC but vary the distribution of MPCs such that older households have higher MPCs. In this specification, the consumption fall is 12.5 per cent, which is moderately larger than the baseline scenario (‘Age-varying MPC’ column in Figure 13). Furthermore, the stress is potentially more pronounced than implied by the fall in consumption, because the share of households consuming at the subsistence level increases more markedly.
3.2.4 MPCs higher in downturns
Our estimates up to this point have been benchmarked to the economy-wide MPCs which are mostly estimated in periods of rising income and wealth. This may understate the effects if households are precautionary savers, households are constrained in taking on additional debt to smooth their consumption when the value of their collateral has fallen or if households exhibit loss aversion.[44] Indeed, there is evidence that households are more sensitive to falls in their wealth or income than to rises. Hviid and Kuchler (2017) and de Roiste et al (2019) find that the MPC from wealth is larger when wealth is falling than when it is rising, while Bunn et al (2018) and Christelis et al (2019) find the MPC from income is larger when income is falling.
With this in mind, we consider the effect of raising the average MPC from wealth from 3 cents to 5 cents and the MPC from income from 55 cents to 80 cents. This has a very large effect on our estimated fall in consumption, which rises to 17.8 per cent. The share of households consuming at the subsistence level also rises sharply (see ‘Larger MPC’ column in Figure 13).
3.2.5 Liquidity constraints
Other literature suggests that liquidity constraints (Kaplan, Violante and Weidner 2014; Baker 2018) or broader financial distress (Athreya et al 2019), rather than indebtedness per se, are what amplify consumption sensitivity to negative income shocks. We also find that indebtedness is positively correlated with measures of financial distress (such as ability to pay bills and seeking financial help), and, thus, our specification also partly captures the financial distress channel. However, to more directly investigate the importance of liquidity constraints, we consider the effect of assuming liquidity-constrained households have higher MPCy than unconstrained households. While the literature tends to focus on income shocks, we also consider the case where liquidity-constrained households have higher MPCw as well.
In particular, we follow the framework set out in Kaplan et al (2014) and extended by Price et al (2019). We firstly define hand-to-mouth households as households whose liquid wealth is less than half their income each pay period.[45] We then assume that hand-to-mouth households have an MPCy of 1 (or about twice as large as non-hand-to-mouth households), consistent with the findings in the United States.[46] We also assume the MPCw is twice as large for hand-to-mouth households, but this is more speculative given that these are not calibrated from past studies. As before, we ensure that the average MPCy and MPCw are anchored at 55 cents and 3 cents, respectively. In this specification, the fall in consumption is about ½ percentage point lower than in the baseline case (see ‘Hand-to-mouth’ column in Figure 13). This implies that liquidity constraints are not an important source of vulnerability in stress events like the one we consider.
3.2.6 Changes in sensitivity over the past decade or two
To investigate how the rise in indebtedness has affected the sensitivity of consumption to shocks, we compare results using data for 2003–04, 2009–10 and 2015–16. From 2003–04 to 2015–16, the aggregate household sector DTI ratio has increased by 30 percentage points, potentially signalling an increased vulnerability of the household sector to economic shocks. But an important factor contributing to some part of this rise has been lower interest rates, meaning that debt-servicing costs (the ratio of scheduled payments to total income) have remained relatively stable (at least between 2009–10 and 2015–16) as household indebtedness has risen (Figure 14). Moreover, household leverage has not risen noticeably due to strong growth in housing prices. It is therefore not clear that households have become more vulnerable (ignoring the potential for interest rates to rise from current levels).
The comparison uses data from the same surveys, the SIH and HES, at three points in time. We hold the elasticities of wealth and income constant, based on the assumption that these tend to be persistent through time. However, the MPCs will differ across time periods based on the underlying household data at the each point in time, in particular changes in consumption relative to wealth and income. Due to data limitations in the 2003–04 sample, we assume that bonuses and overtime income do not fall in the scenarios, and that the minimum consumption of households is the HPL (rather than the HEM).
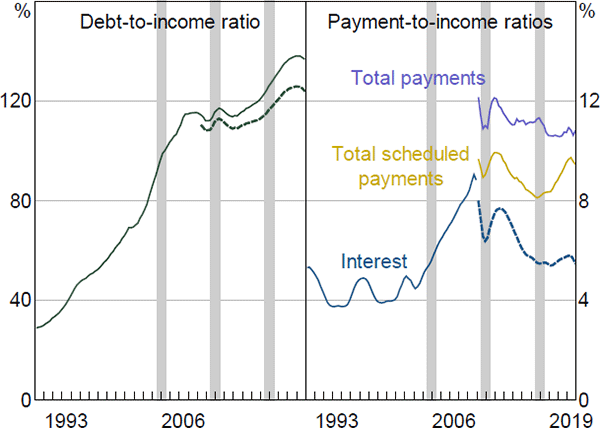
Notes: Shaded areas indicate the sample periods for the 2003–04, 2009–10 and 2015–16 SIH data; dotted lines show net of offset balances
Sources: ABS; APRA; Authors' calculations
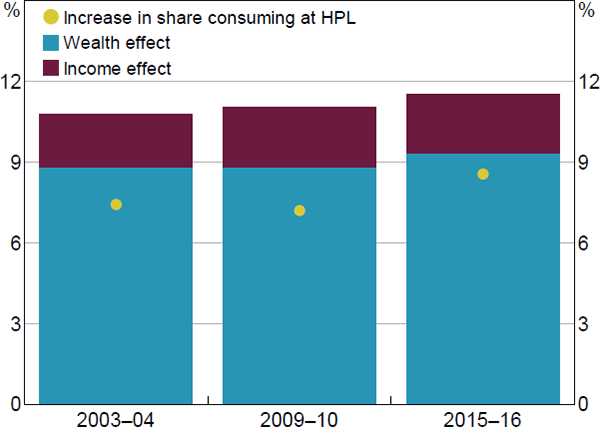
We find evidence that the vulnerability of household consumption has risen slightly over time. In particular, for the same macroeconomic shock, the fall in consumption is larger in 2015–16 (11.5 per cent) than in 2009–10 (11.0 per cent) and 2003–04 (10.8 per cent) (Figure 15).[47] The share of households consuming at subsistence levels after the shock increases more substantially over time. A bit less than half of the increased vulnerability from 2003–04 to 2015–16 can be attributed to greater household leverage. This increased leverage makes a given asset shock larger for the same household net wealth position. A similar-sized effect comes from a combination of households holding riskier assets and being more reliant on investment income over time. There is also a small effect from changes in the distribution of consumption spending. In particular, an increased share of total consumption now comes from higher-income households whose spending is less constrained by our assumption that minimum consumption will not fall below the poverty line.
Sources: ABS; Authors' calculations; Melbourne Institute
4. Conclusion
The long-run rise in household indebtedness has increased concerns about the risks this poses globally to banking sectors and economies more broadly. Given the current level of household debt relative to income in Australia is high compared to many other countries, and its own history, these risks are often highlighted for Australia. Our exploration of these risks shows three implications.
First, we find that the high level and strong growth over recent decades of Australian household debt relates to a measurement issue and the strength of the Australian economy. In Australia the housing rental stock is mostly owned directly by the household sector and so debt financing is owed directly by households, while in many other countries rental housing is owned by corporations, the government or not-for-profits and so debt financing is owed by other sectors. Falls in nominal interest rates and the deregulation of the financial system (mostly in the 1980s) can account for much of the rise in household debt in Australia and globally. Further, stronger real income growth in Australia compared with many other countries accounts for at least part of the stronger growth, and so higher level, of household indebtedness in Australia.
Second, the distribution of debt across households has contrasting implications for risks to the banking sector and household consumption. We show that aggregate bank losses are higher when risks are concentrated among a small group of borrowers (for example, if households in a particular region simultaneously experience larger falls in employment and housing prices). In contrast, falls in consumption are larger if aggregate wealth effects are dispersed over a large number of highly indebted households. A key driver of this result is that highly indebted households tend to have fewer assets than those without debt (particularly wealthy retirees). An additional factor underpinning this result is that there is a limit to how much households can cut back on consumption in response to wealth shocks.
Third, the consequences of household indebtedness seem more likely to manifest through weaker economic growth than large bank losses. Bank stress tests highlight the resilience of the banking sector to severe scenarios, in large part because debt is not concentrated among households with high loan-to-valuation ratios. In fact, most of this debt is held by households whose risk of unemployment is relatively low, while households that are most at risk of experiencing very large changes in asset values (relative to income) tend to have little leverage. However, we simulate some fairly sizeable contractions in consumer spending when households are faced with extreme but plausible shocks. This is especially so if precautionary savings motives or loss aversion mean that households are more sensitive to falling housing prices than they have historically been to rising prices.
Overall, these findings confirm that Australian household indebtedness has important implications but they are sometimes misconstrued. The level and growth of household debt reflects high incomes and direct ownership of rental housing, not evidence of widespread excessive leverage. Household borrowing is a large share of banks' assets and so is important for their performance, but overall high lending standards, low loan-to-valuation ratios and banks' high level of capital mean they are highly resilient to adverse shocks to households. Rather, the implications for consumption of household indebtedness are an important mechanism to take into account when targeting macroeconomic policy to respond to economic shocks.
Appendix A: Regression Data
| Variable | Source | Unit | Measurement |
|---|---|---|---|
| Household debt-to-income | ABS; Jordà et al (2013); Thomson Reuters; authors' calculations | ratio | Disposable income is measured after tax but before deduction of interest payments for most countries, includes non-profit sector; Australian DTI ratio extrapolated three years earlier than ABS data using the Jordà et al (2013) database |
| Time-varying | |||
| Real income per capita | OECD; World Bank; authors' calculations | US$ | Real disposable income per capita; in 2017 dollars, converted to US$ using year-average exchange rate |
| Real interest rate | Bloomberg; IMF; RBA; central banks | % | Calculated as 10-year nominal sovereign bond yield minus past year's CPI inflation |
| Inflation | IMF | % | CPI inflation over the prior year |
| Housing pricing growth | BIS; IMF; authors' calculations | % pa | Growth in BIS long-run housing price series, minus CPI inflation over a three-year period |
| Max price fall | BIS; authors' calculations | % | Absolute peak-to-trough fall in the BIS long-run housing price series over the prior period; weight on price outcomes is given full weight for the most recent five years, and then gradually declines according to the following formula: , if prices have not fallen during that time, the value is set to 0 |
| Urban population growth | United Nations | % pa | Two-year annualised rate of change in population for cities with at least 300,000 people in 2018 |
| Urbanisation | United Nations authors' calculations | % | Share of national population living in cities that had at least 300,000 people in 2018 |
| Housing stock per person | United Nations; authors' calculations; national agencies | ratio | Total dwellings divided by population |
| Younger population | United Nations; authors' calculations | % | Share of total population aged 25 years or less |
| Older population | United Nations; authors' calculations | % | Share of total population aged 65 years or older |
| Financial liberalisation | Abiad, Detragiache and Tressel (2008); authors' calculations | index | Based on seven metrics of deregulation (credit controls, interest rate controls, entry barriers, state ownership, capital account restrictions, prudential regulation and securities market policy); we update this to 2018 using various sources of information on these metrics |
| Income growth expectations | Consensus Economics | % | Forecasts for GDP growth in the year t + 1, made in March of year t |
| Unemployment rate | IMF | % | Unemployed persons as a per cent of the labour force |
| Baa-Aaa spread | Federal Reserve Bank of St. Louis | ppt | Difference between yield on Baa-rated bonds and equivalent tenor Aaa-rated bond |
| ‘Time-variant’ | |||
| Ownership of housing | authors' calculations; national agencies | % | Share of all housing owned by households; generally collected from financial accounts data, where that is unavailable then census data are used |
| Strength of legal rights | World Bank | index | Ranges from 0 to 12, with 12 being the strongest creditor rights |
| Urban density | Charting Transport | person/ha | Population-weighted density of main cities in each country, calculated using square km grids |
| Inequality | OECD | ratio | Gini coefficient |
| Interest tax deductible | Ellis (2005); authors' calculations | dummy | 1 = interest payments are tax deductible |
| Capital gains taxation | Ellis (2005); authors' calculations | dummy | 1 = capital gains on housing are taxed at full rate |
| Country | Sample starts | Country | Sample starts |
|---|---|---|---|
| Australia | 1985(c) | Japan(b) | 1980 |
| Austria(a) | 1999 | Netherlands | 1980 |
| Belgium(a) | 1999 | New Zealand | 1980 |
| Canada | 1980 | Norway(a) | 1987 |
| Chile(b) | 2003 | Portugal(a) | 1999 |
| Denmark | 1999 | South Korea(b) | 2008 |
| Finland(a) | 1999 | Spain(a) | 1980 |
| France(a) | 1980 | Sweden | 1980 |
| Germany | 1991 | Switzerland | 1999 |
| Ireland(a) | 2001 | United Kingdom | 1980 |
| Italy(a) | 1999 | United States | 1980 |
|
Notes: (a) Not included in narrow regression |
|||
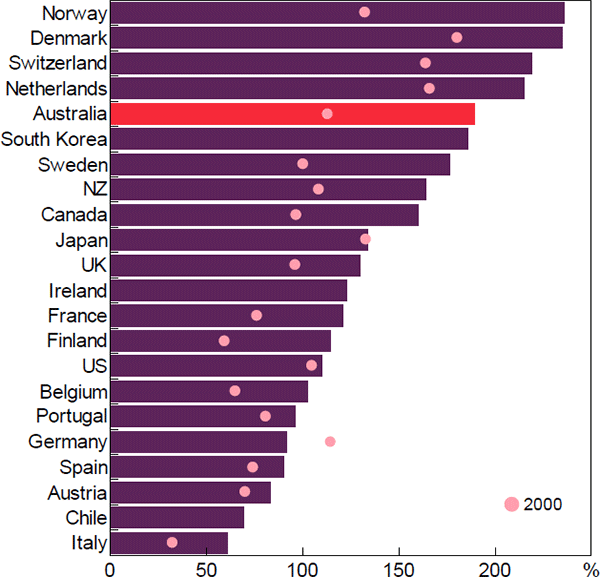
Sources: European Central Bank; National agencies; OECD; RBA; Thomson Reuters
Appendix B: Fit of Predictive Unemployment Model
| SIH | SIH | HES | |
|---|---|---|---|
| Previously unemployed | 44.5*** | 46.2*** | |
| Earns rental income | −4.3** | −7.8*** | −5.2** |
| Has housing debt | −4.7*** | −8.9*** | −4.1*** |
| Married | −6.1*** | −11.9*** | −6.7*** |
| Long-term health condition | 6.7*** | 12.0*** | 6.5*** |
| Age | −0.3*** | −0.4*** | −0.3*** |
| Born in English-speaking country | −6.0*** | −9.3*** | −5.3*** |
| Lives in capital city | 1.1 | 0.8 | 2.2** |
| Educational attainment | |||
| Completed Year 12 | −3.9*** | 0.0*** | −2.9** |
| Diploma | −2.2*** | −4.9*** | −1.9*** |
| University | −5.7*** | −10.8*** | −4.5*** |
| Family structure | |||
| Couple with dependent children | 4.0** | 4.3** | 5.7** |
| Couple without dependent children | 2.5 | 3.5 | 4.9*** |
| Single with dependent children | 2.4*** | 4.1** | 5.0*** |
| Number of observations | 20,785 | 20,785 | 11,367 |
| Pseudo R2 | 0.18 | 0.11 | 0.19 |
| Area under ROC curve | 0.80 | 0.76 | 0.80 |
|
Note: *, ** and *** denote statistical significance at the 10, 5 and 1 per cent levels, respectively |
|||
References
Abiad A, E Detragiache and T Tressel (2008), ‘A New Database of Financial Reforms’, IMF Working Paper No WP/08/266.
Albacete N and P Fessler (2010), ‘Stress Testing Austrian Households’, Oesterreichische Nationalbank Financial Stability Report, 19, pp 72–91.
Andersen AL, C Duus and TL Jensen (2016), ‘Household Debt and Spending During the Financial Crisis: Evidence from Danish Micro Data’, European Economic Review, 89, pp 96–115.
Aron J and J Muellbauer (2000), ‘Financial Liberalization, Consumption and Debt in South Africa’, University of Oxford, Department of Economics, Centre for the Study of African Economies, CSAE Working Paper WPS/2000-22.
Athreya K, R Mather, J Mustre-del-Río and JM Sanchez (2019), ‘Consumption in the Great Recession: The Financial Distress Channel’, Federal Reserve Bank of Richmond Working Paper No 19-13.
Baker SR (2018), ‘Debt and the Response to Household Income Shocks: Validation and Application of Linked Financial Account Data’, Journal of Political Economy, 126(4), pp 1504–1557.
Ballantyne A, T Cusbert, R Evans, R Guttman, J Hambur, A Hamilton, E Kendall, R McCririck, G Nodari and D Rees (2019), ‘MARTIN Has Its Place: A Macroeconometric Model of the Australian Economy’, RBA Research Discussion Paper No 2019-07.
Barba A and M Pivetti (2009), ‘Rising Household Debt: Its Causes and Macroeconomic Implications—A Long-Period Analysis’, Cambridge Journal of Economics, 33(1), pp 113–137.
Berger D, V Guerrieri, G Lorenzoni and J Vavra (2018), ‘House Prices and Consumer Spending’, The Review of Economic Studies, 85(3), pp 1502–1542.
Berger-Thomson L, E Chung and R McKibbin (2009), ‘Estimating Marginal Propensities to Consume in Australia Using Micro Data’, RBA Research Discussion Paper No 2009-07.
Bergmann M (2020), ‘The Determinants of Mortgage Defaults in Australia – Evidence for the Double-Trigger Hypothesis’, RBA Research Discussion Paper No 2020-03.
Bilston T, R Johnson and M Read (2015), ‘Stress Testing the Australian Household Sector Using the HILDA Survey’, RBA Research Discussion Paper No 2015-01.
Borio C, M Drehmann and K Tsatsaronis (2014), ‘Stress-Testing Macro Stress Testing: Does it Live up to Expectations?’, Journal of Financial Stability, 12, pp 3–15.
Borio C and P Lowe (2002), ‘Asset Prices, Financial and Monetary Stability: Exploring the Nexus’, BIS Working Papers No 114.
Bunn P, J Le Roux, K Reinold and P Surico (2018), ‘The Consumption Response to Positive and Negative Income Shocks’, Journal of Monetary Economics, 96, pp 1–15.
Byres W (2018), ‘Preparing for a Rainy Day’, Lunchtime Briefing to the Australian Business Economists, Sydney, 11 July.
Caldera A and Å Johansson (2013), ‘The Price Responsiveness of Housing Supply in OECD Countries’, Journal of Housing Economics, 22(3), pp 231–249.
Calomiris CW, SD Longhofer and W Miles (2012), ‘The Housing Wealth Effect: The Crucial Roles of Demographics, Wealth Distribution and Wealth Shares’, NBER Working Paper No 17740.
Cameron AC and PK Trivedi (2005), Microeconometrics: Methods and Applications, Cambridge University Press, Cambridge.
Campbell JY and JF Cocco (2007), ‘How Do House Prices Affect Consumption? Evidence from Micro Data’, Journal of Monetary Economics, 54(3), pp 591–621.
Carroll CD (1992), ‘The Buffer-Stock Theory of Saving: Some Macroeconomic Evidence’, Brookings Papers on Economic Activity, 1992(2), pp 61–135, 153–156.
Carroll CD, J Slacalek, K Tokuoka and MN White (2017), ‘The Distribution of Wealth and the Marginal Propensity to Consume’, Quantitative Economics, 8(3), pp 977–1020.
Choi I (2001), ‘Unit Root Tests for Panel Data’, Journal of International Money and Finance, 20(2), pp 249–272.
Christelis D, D Georgarakos, T Jappelli, L Pistaferri and M van Rooij (2019), ‘Asymmetric Consumption Effects of Transitory Income Shocks’, The Economic Journal, 129(622), pp 2322–2341.
Davidson P, B Bradbury, T Hill and M Wong (2020), Poverty in Australia 2020: Part 1: Overview, ACOSS/UNSW Poverty and Inequality Partnership Report No 3, Australian Council of Social Service in partnership with UNSW Sydney, Sydney.
de Roiste M, A Fasianos, R Kirkby and F Yao (2019), ‘Household Leverage and Asymmetric Housing Wealth Effects – Evidence from New Zealand’, Reserve Bank of New Zealand Discussion Paper DP 2019/01.
Debelle G (2004), ‘Household Debt and the Macroeconomy’, BIS Quarterly Review, March, pp 51–64.
Dvornak N and M Kohler (2003), ‘Housing Wealth, Stock Market Wealth and Consumption: A Panel Analysis for Australia’, RBA Research Discussion Paper No 2003-07.
Dynan K and W Edelberg (2013), ‘The Relationship between Leverage and Household Spending Behavior: Evidence from the 2007-2009 Survey of Consumer Finances’, Federal Reserve Bank of St. Louis Review, 95(5), pp 425–448.
Ellis L (2005), ‘Disinflation and the Dynamics of Mortgage Debt’, in Investigating the Relationship between the Financial and Real Economy, BIS Papers No 22, Bank for International Settlements, Basel, pp 5–20.
Ellis L and D Andrews (2001), ‘City Sizes, Housing Costs, and Wealth’, RBA Research Discussion Paper No 2001-08.
Fagereng A and E Halvorsen (2016), ‘Debt and Household Consumption Response’, Norges Bank Staff Memo No 1|2016.
Friedman M (1957), A Theory of the Consumption Function, National Bureau of Economic Research General Series No 63, Princeton University Press, Princeton.
Gertler M and B Bernanke (1989), ‘Agency Costs, Net Worth, and Business Fluctuations’, The American Economic Review, 79(1), pp 14–31.
Gross M and J Población (2017), ‘Assessing the Efficacy of Borrower-Based Macroprudential Policy Using an Integrated Micro-Macro Model for European Households’, Economic Modelling, 61, pp 510–528.
Guerrieri V and G Lorenzoni (2017), ‘Credit Crises, Precautionary Savings, and the Liquidity Trap’, The Quarterly Journal of Economics, 132(3), pp 1427–1467.
Hausman JA and WE Taylor (1981), ‘Panel Data and Unobservable Individual Effects’, Econometrica, 49(6), pp 1377–1398.
Hviid SJ and A Kuchler (2017), ‘Consumption and Savings in a Low Interest-Rate Environment’, Danmarks Nationalbank Working Paper No 116.
IMF (International Monetary Fund) (2019), ‘Australia: Financial Sector Assessment Program: Technical Note—Stress Testing the Banking Sector and Systemic Risk Analysis’, IMF Country Report No 19/51.
Jappelli T, M Pagano and M Di Maggio (2013), ‘Households' Indebtedness and Financial Fragility’, Journal of Financial Management, Markets and Institutions, 1/2013, pp 23–46.
Jordà Ò, M Schularick and AM Taylor (2013), ‘When Credit Bites Back’, Journal of Money, Credit and Banking, 45(s2), pp 3–28.
Kaplan G and GL Violante (2014), ‘A Model of the Consumption Response to Fiscal Stimulus Payments’, Econometrica, 82(4), pp 1199–1239.
Kaplan G, GL Violante and J Weidner (2014), ‘The Wealthy Hand-to-Mouth’, Brookings Papers on Economic Activity, Spring, pp 77–138.
Kelly J, J Le Blanc and R Lydon (2019), ‘Pockets of Risk in European Housing Markets: Then and Now’, European Systemic Risk Board Working Paper No 87.
Kendall R and P Tulip (2018), ‘The Effect of Zoning on Housing Prices’, RBA Research Discussion Paper No 2018-03.
Kirkham L and S Burgess (2019), ‘A Question of Interest: Is UK Household Debt Unsustainable?’, Bank of England Bank Underground blog, 17 January, viewed 18 January 2019. Available at <https://bankunderground.co.uk/2019/01/17/a-question-of-interest-is-uk-household-debt-unsustainable/>.
Kukk M (2016), ‘How Did Household Indebtedness Hamper Consumption during the Recession? Evidence from Micro Data’, Journal of Comparative Economics, 44(3), pp 764–786.
La Cava G, H Hughson and G Kaplan (2016), ‘The Household Cash Flow Channel of Monetary Policy’, RBA Research Discussion Paper No 2016-12.
Leigh A (2012), ‘How Much Did the 2009 Australian Fiscal Stimulus Boost Demand? Evidence from Household-Reported Spending Effects’, The B.E. Journal of Macroeconomics, 12(1), Contributions, Article 4.
May D, G Nodari and D Rees (2019), ‘Wealth and Consumption’, RBA Bulletin, March, viewed 11 August 2020. Available at <https://www.rba.gov.au/publications/bulletin/2019/mar/wealth-and-consumption.html>.
Meng X, NT Hoang and M Siriwardana (2013), ‘The Determinants of Australian Household Debt: A Macro Level Study’, Journal of Asian Economics, 29, pp 80–90.
Mian A, K Rao and A Sufi (2013), ‘Household Balance Sheets, Consumption, and the Economic Slump’, The Quarterly Journal of Economics, 128(4), pp 1687–1726.
Mian A, L Straub and A Sufi (2020a), ‘Indebted Demand’, NBER Working Paper No 26940.
Mian A, L Straub and A Sufi (2020b), ‘The Saving Glut of the Rich and the Rise in Household Debt’, NBER Working Paper No 26941.
Mian A and A Sufi (2012), ‘What Explains High Unemployment? The Aggregate Demand Channel’, NBER Working Paper No 17830.
Mian A, A Sufi and E Verner (2017), ‘Household Debt and Business Cycles Worldwide’, The Quarterly Journal of Economics, 132(4), pp 1755–1817.
Mishkin FS (2007), ‘Housing and the Monetary Transmission Mechanism’, in Housing, Housing Finance, and Monetary Policy, A Symposium Sponsored by the Federal Reserve Bank of Kansas City, Kansas City, pp 359–413.
Peterson B and T Roberts (2016), ‘Household Risk Assessment Model’, Bank of Canada Technical Report No 106.
Price F, B Beckers and G La Cava (2019), ‘The Effect of Mortgage Debt on Consumer Spending: Evidence from Household-Level Data’, RBA Research Discussion Paper No 2019-06.
Qi M and X Yang (2009), ‘Loss Given Default of High Loan-to-Value Residential Mortgages’, Journal of Banking & Finance, 33(5), pp 788–799.
RBA (Reserve Bank of Australia) (2017), ‘Box D: Stress Testing at the Reserve Bank’, Financial Stability Review, October, pp 46–49.
Rodgers D (2015), ‘Credit Losses at Australian Banks: 1980–2013’, RBA Research Discussion Paper No 2015-06.
Schularick M and AM Taylor (2012), ‘Credit Booms Gone Bust: Monetary Policy, Leverage Cycles, and Financial Crises, 1870–2008’, The American Economic Review, 102(2), pp 1029–1061.
Sinai T and NS Souleles (2005), ‘Owner-Occupied Housing as a Hedge against Rent Risk’, The Quarterly Journal of Economics, 120(2), pp 763–789.
Tan A and G Voss (2003), ‘Consumption and Wealth in Australia’, Economic Record, 79(244), pp 39–56.
Wooldridge J (2010), Econometric Analysis of Cross Section and Panel Data, 2nd edn, The MIT Press, Cambridge.
Yao J, A Fagereng and G Natvik (2015), ‘Housing, Debt, and the Marginal Propensity to Consume’, Unpublished manuscript, Norges Bank, 6 November. Available at <https://editorialexpress.com/cgi-bin/conference/download.cgi?db_name=IAAE2016&paper_id=171>.
Acknowledgements
The authors would like to thank Benjamin Beckers, Christian Gillitzer, Tom Rosewall, John Simon, Guy Debelle, Luci Ellis, Gianni La Cava, Adam Gorajek, Anthony Brassil, Peter Tulip, Nick Garvin, Callan Windsor and seminar participants at the Bank for International Settlements and the 2019 Sydney Banking and Financial Stability Conference for helpful comments on this paper. The views expressed in this paper are those of the authors and do not necessarily reflect the views of the Reserve Bank of Australia. The authors are solely responsible for any errors.
Footnotes
Above-trend credit-to-GDP ratio (the economy-wide counterpart to household debt-to-income ratio) was also found to be a strong predictor of financial crises in earlier work by Borio and Lowe (2002). A separate arm of the literature contends that high debt can have a persistent effect on the economy, by weighing on consumption growth even in normal times and, for example, contributing to permanent declines in the neutral real interest rate (Mian, Straub and Sufi 2020a).[1]
This is the household counterpart to the debt-to-GDP ratio examined by Schularick and Taylor (2012) and others.[2]
The rank correlation across countries between the level of the DTI ratio in 2007 and the subsequent fall in the output gap, consumption per capita or housing prices does not exceed 0.35 (in absolute terms), though the rank correlation is higher with the change in the DTI ratio (−0.33 for the output gap and −0.77 for the change in consumption per capita).[3]
In particular, rising debt levels among younger households has boosted the wealth of older households over the past few decades.[4]
For example, in the United States, debt grew by around ¼ of a percentage point faster per annum than income in the 15 years from 1970 to 1985, and then by 2½ percentage points faster per annum in the subsequent 15 years. Estimates of total household debt are not available for Australia prior to 1984, but estimates of household debt owed to banks grew 6 percentage points faster per annum than income in the 15 years priors to 1985 and by 9 percentage points per annum faster in the subsequent 15 years. [5]
Examples include Meng, Hoang and Siriwardana (2013) for Australia and Aron and Muellbauer (2000) for South Africa, while Jappelli, Pagano and Di Maggio (2013) look at institutional factors that give rise to cross-country differences in indebtedness. [6]
It is of course possible to econometrically model joint decisions like this, but it adds unnecessary complexity. [7]
Details of how these variables are measured can be found in Appendix A. [8]
This spread is not directly related to households. However, it has been shown to be highly correlated with many interest rate spreads in the global economy. [9]
Inflation should not impact perceptions of the cost of debt unless households suffer money illusion. [10]
The use of a random effects estimator is supported by the results of a Hausman test. [11]
The Hausman-Taylor estimator deals with the potential endogeneity of variables using various transformations of the variables (within transformation of the X matrices, the time average of X1, and Z1) as instruments. Further details of the estimator can be found in Cameron and Trivedi (2005) or Wooldridge (2010). [12]
We choose the Phillips-Perron panel unit root test because we have an unbalanced panel and want to test whether all panels contain a unit root. Choi (2001) recommends using the inverse normal statistic produced by this test, which rejects the null hypothesis of non-stationarity at the 10 per cent level. Given the result is only weak, we also run a Pedroni test for panel cointegration of DTI ratio, real household income, financial liberalisation and nominal interest rates. We are able to reject the null hypothesis of this test at the 10 per cent level, implying that either each series is stationary or their combination is. [13]
In particular, there is an unusual pattern of coefficients when we include various combinations of age ranges within the prime working years, and including some of these makes the coefficient on the younger population insignificant. [14]
This assumes that the supply elasticity of housing is less than unity, so that prices fall by more than the increase in quantity of housing. A supply elasticity of less than 1 is often found, but not always (Caldera and Johansson 2013). [15]
The Hausman-Taylor estimator ensures our regressors are ‘weakly exogenous’ (that is, uncorrelated with the random effect), but not ‘strictly exogenous’ (that is, uncorrelated with the error term). Using a test for strict exogeneity suggested by Wooldridge (2010, p 325), which looks at the significance of the coefficient of the first lead (i.e. t + 1), we find that these two variables may be endogenous. [16]
The choice of GDP as an instrument for income rests on the observation that while the two are correlated (as is required), GDP is not in the denominator of the DTI ratio like household income is. Global interest rates will be an appropriate instrument for each country's rate to the extent that country's economy does not drive global financial conditions. [17]
As mentioned earlier, conventional tests suggest we do not have a problem with non-stationarity. [18]
The cross-sectional correlation between the DTI ratio and growth expectations is sizeable (0.45) and of the expected sign. [19]
Figure 6 uses coefficients from the narrow regression, after re-estimating without housing stock and urban density, both of which are insignificant and yet exert a large, counterintuitive effect on the results. Dropping these variables has little effect on the other coefficients, though that on ownership declines by about one-third in size. [20]
It is possible that households owning the rental stock is more risky than corporations doing so, given individual households are likely to be less diversified. [21]
‘Severe but plausible’ scenarios are considered best practice in the stress testing literature (Borio, Drehmann and Tsatsaronis 2014). [22]
If job loss occurs, we assume individuals without children receive Newstart Allowance unemployment benefits (based on marital status), while parents receive the Parenting Payment. We calculate the change in disposable income by applying the shocks to gross income and then subtracting an estimate of income tax based on the relevant income tax tables. [23]
In practice, loans may enter arrears for many years before defaulting (Bergmann 2020); however, banks are required to provision for credit losses in a forward-looking way well before a borrower defaults. [24]
Bergmann (2020) finds that less than 10 per cent of arrears with an LVR below 90 per cent are foreclosed. [25]
If minimum mortgage repayments cannot be estimated because of inadequate data (or they are higher than current repayments), the household's current mortgage repayments are used. [26]
We also replicate our results using the Henderson Poverty Lines (HPL) published by the Melbourne Institute, which estimate the minimum income levels required to avoid a situation of poverty. The results were broadly similar, though the HPL is on average lower than the HEM. [27]
Loan losses may be higher if some households do not cut their consumption to these minimum levels and instead default earlier. [28]
The increase is slightly smaller than estimates in Bilston et al (2015) for earlier periods after accounting for the more severe scenario considered here. The results are smaller when we use the 2017–18 SIH sample. [29]
We assume an LMI payout ratio of 70 per cent, consistent with past APRA stress tests. Mortgage loans with an LVR that is currently above 80 per cent are assumed to have LMI. This likely understates LMI protection as it ignores repayments since origination. It is also possible that LMI providers may default during stress which would reduce this protection, though they tend to be well capitalised. [30]
About one-third of households with a negative financial margin have sufficient liquid assets to avoid default after two years. [31]
As an aside, the magnitude of this effect will vary across countries based on institutional features of credit markets. They are likely stronger in the United States than in Australia and other countries, due to the prevalence of long-term fixed-rate mortgage contracts. [32]
The initial paper in this strand of literature was Mian et al (2013), who used US data. Their results have since been replicated for Australia (Price et al 2019), Denmark (Andersen, Duus and Jensen 2016), Estonia (Kukk 2016), New Zealand (de Roiste et al 2019), Norway (Fagareng and Halvorsen 2016) and the United Kingdom (Bunn et al 2018). The main challenge to this strand of literature is Andersen et al (2016), which argues that the relationships between MPCw and leverage is driven by previous (one-off) purchases of consumer durables raising initial leverage, but then not being repeated in subsequent periods. [33]
For example, Price et al (2019) show that there is a ‘debt overhang’ effect in Australia even after controlling for liquidity constraints. [34]
The results on the banking stress test are robust to this smaller sample. [35]
Consumption effects are slightly larger if we relax this assumption, but the conclusions are unchanged. [36]
These are a little lower than estimates from before the financial crisis (Dvornak and Kohler 2003; Tan and Voss 2003). [37]
In existing Australian models, it typically takes two to three years for the majority of the effects to flow through to consumption (May et al 2019). [38]
Baker (2018) estimates elasticities rather than MPCs, but we adjust these by using the consumption-to-income ratio. [39]
The Poverty in Australia report (Davidson et al 2020) also finds that around 14 per cent of households live below the poverty line. [40]
The income effect may also be larger if individuals experience falls in hours worked or wage freezes, or if they reduce consumption due to uncertainty around their employment (even if they end up keeping their job). [41]
As an aside, while highly leveraged households tend to have lower assets, they tend to have higher incomes from which to service their debt. Thus, higher incomes at least partly offset the potential vulnerability of highly indebted individuals having less security on their loans. [42]
Hviid and Kuchler (2017) find a correlation between MPC and DTI ratios, rather than debt-to-asset ratios. When we assume their specification, the consumption fall (12½ per cent) is larger than the uniform scenario. [43]
Relatedly, several studies have found that in periods where housing prices are rising, the MPCw is higher for low-income households than high-income households because this reduces borrowing collateral constraints and enables them to raise consumption. When we calibrate this in the model, the overall effects tend to be lower because low-income households have less ability to reduce consumption. [44]
An important feature of this household type is that it includes liquidity-constrained households with large illiquid wealth, known as wealthy hand-to-mouth, because they face a trade-off in accessing their illiquid wealth and incurring costs to meet current consumption. We also account for mortgage prepayment buffers where available, though this does not materially affect the results. [45]
Price et al (2019) do not find evidence that hand-to-mouth households are more sensitive to changes in their income or home values than non-hand-to-mouth households, though the estimation period was not during a severe recession. However, La Cava, Hughson and Kaplan (2016) find hand-to-mouth households show a stronger propensity to consume out of cash flows than non-hand-to-mouth households. [46]
The fall in consumption is even smaller in 2009–10 (10.8 per cent) and 2003–04 (9.6 per cent) if we assume the MPCs are constant, rather than the elasticities. [47]