RDP 2020-03: The Determinants of Mortgage Defaults in Australia – Evidence for the Double-trigger Hypothesis 7. Discussion
July 2020
- Download the Paper 1,854KB
7.1 Assessing the Contributions of Ability-to-pay Factors and Negative Equity
To understand the contributions of ability-to-pay factors and negative equity to mortgage defaults, we need to go beyond evaluating the sign of the hazard ratios. The contributions of each variable will depend on both the magnitude of the hazard ratios and the distributions of the observed data. For example, a hazard ratio for a particular characteristic may be very large, but if that characteristic does not exhibit much variation, including among the set of loans that default, then it cannot be considered an economically significant driver of mortgage defaults. However, determining the share of total variation explained by each variable is difficult in multiplicative models such as Cox models.
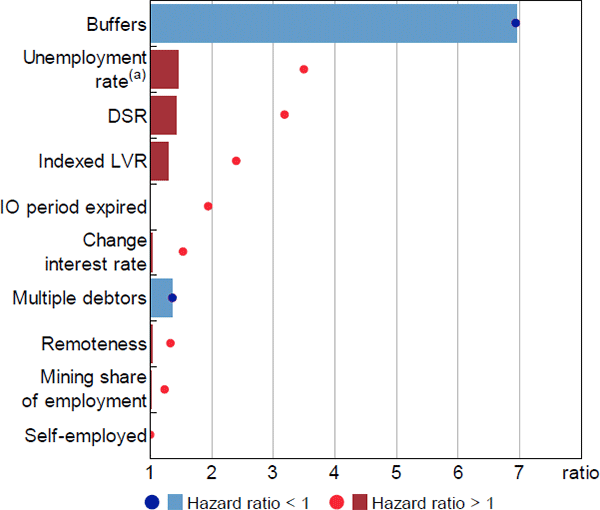
This section evaluates the contributions by considering the change in the estimated hazard ratio for each variable generated by moving across the distribution of the variable (from one percentile to another). The interquartile range provides a useful guide to the role of variables over their typical ranges, while the difference between the 1st and 99th percentile gauges the influence of particularly risky loan characteristics and stressed economic conditions. These results are shown in Figures 15 and 16, where bars represent the relative hazard ratios for the interquartile ranges and dots are the difference between the 1st and 99th percentiles.[28] To assist visual inspection, relative hazard ratios that are less than 1 are inverted to standardise the scales, which can be interpreted as the change in risk involved in moving from the less risky characteristic to the more risky characteristic.
First-stage relative hazard ratios for the interquartile ranges of the data were largest for ability-to-pay factors (Figure 15). The largest relative hazard ratio was for repayment buffers, where mortgages with buffers of less than one month were 7 times more likely to enter arrears than those with buffers greater than six months, and both outcomes were common. Relative hazard ratios for other key ability-to-pay factors (unemployment rate, DSR, multiple debtors) were more moderate at around 1.4 – that is, moving from the 25th to the 75th percentile of the variable led to around a 40 per cent increase in the hazard of entering arrears. While these estimates are individually moderate in magnitude, the model is multiplicative and a combination of risk factors may still generate a large change in the hazard of entering arrears. The relative hazard ratio for indexed LVRs was slightly smaller, at 1.3.
Notes:
Dots represent the relative hazard ratio of the 99th percentile observation to the 1st percentile; bars represent the interquartile range; hazard ratios that are less than 1 are inverted
(a) Estimate from model excluding the SEIFA variable
Sources: ABS; Author's calculations; CoreLogic data; RBA; Securitisation System
Whether ranking effects by the interquartile range or the tails of the distribution, ability-to-pay factors had the largest effects in the first-stage model. This is particularly noteworthy, since many of these variables are only proxies for an ability-to-pay shock or threshold and their effects are likely underestimated. This suggests that ability-to-pay factors can be considered the most important determinants of entries to 90+ day arrears, whether one is concerned about regular economic conditions or stressed economic conditions. Relative hazard ratios for equity were somewhat smaller, including in the comparison of the 1st and 99th percentiles, and therefore may not be considered the main determinants of entries to arrears – consider that only 7 per cent of loans that entered arrears had negative equity of any degree (Table A1).
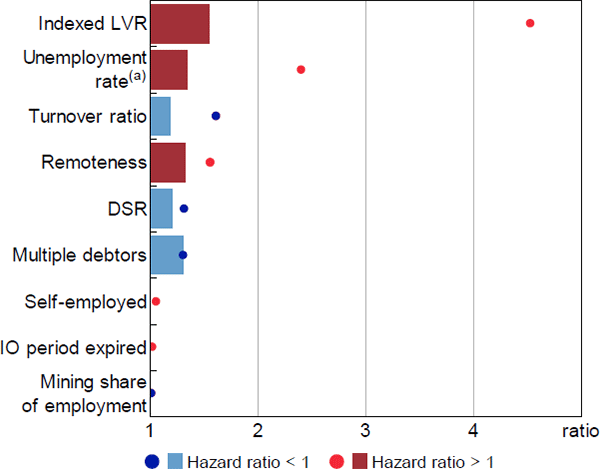
In contrast, equity (indexed LVR) had the largest relative hazard ratio in the second-stage model for foreclosures, whether judged by the interquartile range or the tails of the distribution (Figure 16). This reflects both the larger estimated hazard ratios for indexed LVRs in the second-stage model, as well as the greater prevalence of negative equity among loans in arrears. At the tails of the distribution, the unemployment rate and turnover ratio had the next largest relative hazard ratios, while relative hazard ratios were small for most other variables in this model.
Notes:
Dots represent the relative hazard ratio of the 99th percentile observation to the 1st percentile; bars represent the interquartile range; hazard ratios that are less than 1 are inverted
(a) Estimate from model excluding the SEIFA variable
Sources: ABS; Author's calculations; CoreLogic data; RBA; Securitisation System
Overall, these results are also consistent with the double-trigger hypothesis – ability-to-pay factors appear to be the most important determinants of entries to arrears and negative equity of transitions to foreclosure.
7.2 The Applicability of Regional Shocks
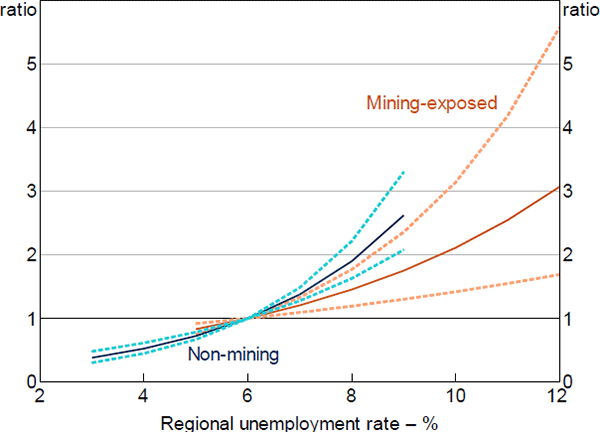
In my analysis, insights regarding the macroeconomic determinants of mortgage defaults largely come from mining-exposed regions, which have experienced both increases in unemployment rates and declines in housing prices. Most of the loans in negative equity, particularly those with substantial degrees of negative equity, are located in mining regions. Any conclusions regarding mortgage defaults in stressed conditions, or the role of negative equity, therefore load heavily on mortgages in mining-exposed regions and the nature of the regional economic shock.
While insights from regional shocks are likely to be applicable to a more widespread shock in many ways, they may vary along several dimensions. Some of these possible dimensions are noted below. Overall, it is difficult to determine ex ante whether a regional shock may have more or less severe consequences for mortgage defaults than a broader shock.
- The response of macroeconomic policy to a broader shock may be stronger than for a regional shock, reducing the overall severity of a broader shock. While this may change the range of macroeconomic outcomes experienced, it is not clear that this would change the estimated model coefficients, unless there are nonlinearities or omitted variables.
- Internal migration may mitigate the severity of a regional shock if displaced workers can move to other regions to find work (albeit possibly at lower wages), but they may not have this option in a severe widespread shock. As a result, unemployment spells may be shorter in regional shocks, increasing the chance that borrowers are able to avoid arrears or subsequently cure. If this is the case, then the estimated coefficients on the labour market variables may underestimate their effect in a broader stress scenario, although this is mitigated by adjusting for internal migration in the unemployment rate measure.
- Regional housing market shocks may be more severe than national shocks and borrowers in remote regions may be less optimistic about a price recovery. Housing prices have fallen by around 70 per cent from their peak in some mining-exposed regions, more than double the nationwide US housing price decline during the financial crisis (although this could be due to the macroeconomic policy response in the United States). In addition, housing turnover rates are typically lower in non-metropolitan regions, which may exacerbate the severity of regional housing market shocks. Hence the probability of foreclosure may be higher at all LVR levels in a regional shock.
- Falls in asset prices may be broader in a widespread stress event than in a regional downturn, with declines across asset types and across housing market regions. This raises the probability that a borrower with negative equity on one asset has negative equity overall, and may mean that the risk of foreclosure for loans with negative equity has been underestimated.[29]
- Borrowers in metropolitan and non-metropolitan regions may vary along characteristics other than those captured in the models. For example, they may have different risk tolerances or variability in income that are not captured in regional aggregates.
To test for the representativeness of the mining region results, we can compare results from models estimated separately for mining and non-mining regions. This provides some surety about the results over the common ranges of the data, but does not guarantee results outside of these bounds (and this is still only a comparison of regional, rather than widespread, shocks).
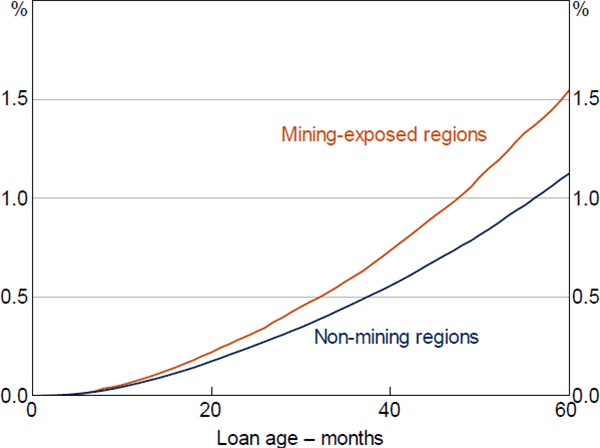
In the first-stage model, estimated hazard ratios were similar for the key variables of interest. To the extent that there were differences, non-mining estimates tended to be slightly larger, although these differences were not statistically significant (Figure 17). In contrast, estimates of the baseline hazard suggest that the probability of the median loan entering arrears is slightly higher in mining regions (Figure 18).[30] This may indicate that unobservable characteristics, whether related to the borrowers or the macroeconomic environment, have increased the riskiness of loans located in mining regions. Notwithstanding this, the similarity of the hazard ratio estimates between the two models across the common data ranges suggests that the regional shock also likely provides plausible estimates and useful identification outside of these ranges.
Notes: Model excluding the SEIFA variable; hazard ratio set to 1 at the median value of x variable; dashed lines denote 95% confidence intervals
Sources: ABS; Author's calculations; CoreLogic data; RBA; Securitisation System
Sources: ABS; Author's calculations; CoreLogic data; RBA; Securitisation System
Footnotes
Figures 15 and 16 include results for key variables only. Figures including controls can be found in Appendix B. [28]
An unexpectedly high share of loans in mining-exposed regions that were deeply in negative equity exited via full repayment, crystallising losses for borrowers. Perhaps these borrowers had other assets with positive equity, and wished to avoid foreclosure due to full recourse. [29]
Estimates use medians of continuous variables for the full subset of loans and categorical variables are set to the base/modal outcome. The baseline hazard is estimated using the Kalbfleisch-Prentice estimator (which reduces to the Kaplan-Meier estimate of the survival curve where coefficients are 0), post the estimation of the Cox model. [30]