RDP 2020-03: The Determinants of Mortgage Defaults in Australia – Evidence for the Double-trigger Hypothesis Appendix B: Full Results
July 2020
- Download the Paper 1,854KB
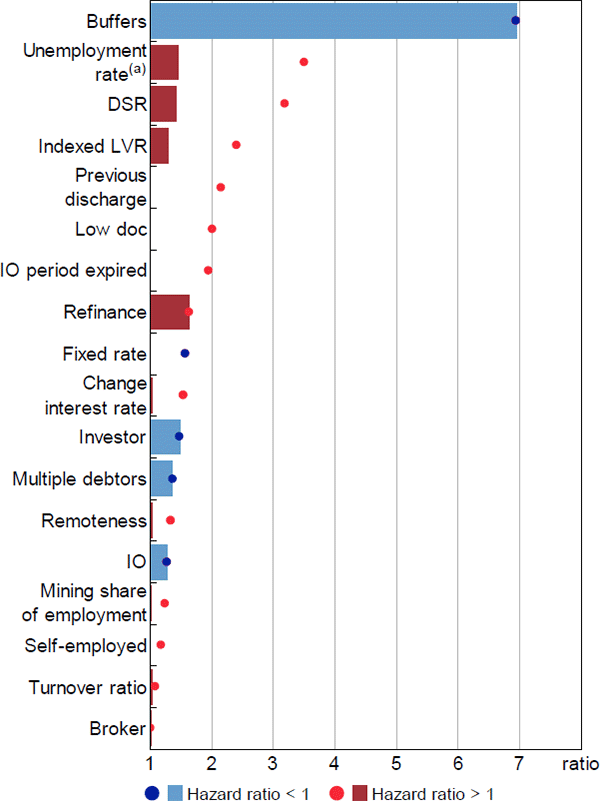
Notes:
Dots represent the relative hazard ratio of the 99th percentile observation to the 1st percentile; bars represent the interquartile range; hazard ratios that are less than 1 are inverted
(a) Estimate from model excluding the SEIFA variable
Sources: Sources: ABS; Author's calculations; CoreLogic data; RBA; Securitisation System
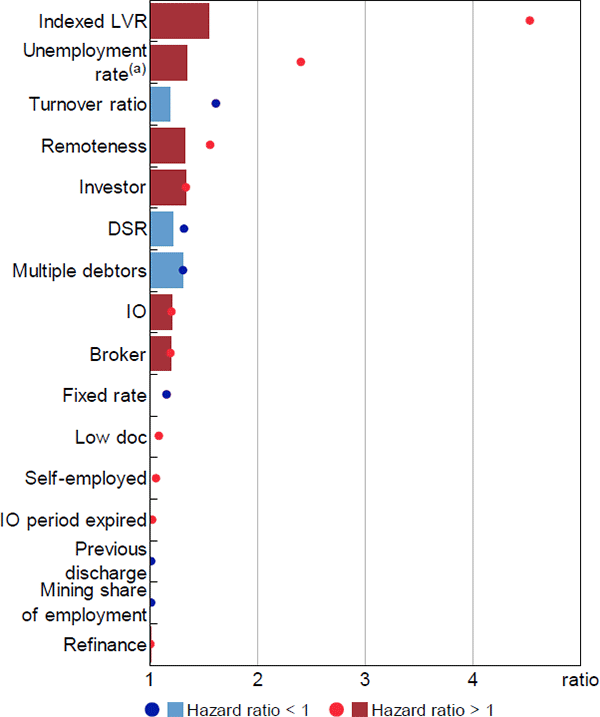
Notes:
Dots represent the relative hazard ratio of the 99th percentile observation to the 1st percentile; bars represent the interquartile range; hazard ratios that are less than 1 are inverted
(a) Estimate from model excluding the SEIFA variable
Sources: ABS; Author's calculations; CoreLogic data; RBA; Securitisation System
| Dependent variable: | Entered 90+ day arrears | Entered 90+ day arrears | Entered 90+ day arrears | Entered 90+ day arrears | Entered 90+ day arrears | Full repayment |
|---|---|---|---|---|---|---|
| Sample: | All loans | All loans | Non-mining | Mining-exposed | Negative equity | All loans |
| Model: | Base | Excl SEIFA | Base | Base | Base | Base |
| Indexed scheduled LVR (base = (60,70]) | ||||||
| (0,30] | 0.900* (0.045) |
0.882* (0.045) |
0.873* (0.050) |
1.068 (0.115) |
n/a | 0.834*** (0.008) |
| (30,40] | 0.779*** (0.045) |
0.769*** (0.045) |
0.763*** (0.049) |
0.854 (0.129) |
n/a | 0.787*** (0.008) |
| (40,50] | 0.827*** (0.035) |
0.820*** (0.035) |
0.813*** (0.037) |
0.926 (0.104) |
n/a | 0.830*** (0.006) |
| (50,60] | 0.885*** (0.027) |
0.881*** (0.027) |
0.885*** (0.029) |
0.906 (0.089) |
n/a | 0.918*** (0.005) |
| (70,80] | 1.142*** (0.023) |
1.145*** (0.023) |
1.167*** (0.025) |
0.954 (0.065) |
n/a | 0.989 (0.005) |
| (80,90] | 1.319*** (0.027) |
1.322*** (0.027) |
1.319*** (0.032) |
1.153* (0.061) |
n/a | 0.816*** (0.007) |
| (90,100] | 1.494*** (0.036) |
1.485*** (0.036) |
1.497*** (0.053) |
1.295*** (0.067) |
n/a | 0.556*** (0.012) |
| (100,110] | 1.872*** (0.046) |
1.841*** (0.046) |
1.745** (0.141) |
1.652*** (0.073) |
Base | 0.398*** (0.024) |
| (110,120] | 2.014*** (0.070) |
1.963*** (0.070) |
2.233** (0.270) |
1.737*** (0.093) |
1.019 (0.076) |
0.410*** (0.048) |
| (120,150] | 2.129*** (0.083) |
2.041*** (0.083) |
2.074* (0.260) |
1.750*** (0.105) |
1.006 (0.094) |
0.605** (0.048) |
| (150,200] | 2.730*** (0.145) |
2.623*** (0.145) |
n/a | 2.530*** (0.161) |
1.294 (0.160) |
0.670* (0.098) |
| 200+ | 3.299*** (0.201) |
3.233*** (0.201) |
n/a | 3.657*** (0.217) |
1.488* (0.230) |
0.652* (0.177) |
| Original LVR (base = (60,80]) | ||||||
| (0,60] | 1.054 (0.028) |
1.051 (0.028) |
1.093* (0.032) |
0.856* (0.062) |
0.767 (0.216) |
1.087*** (0.005) |
| 80+ | 1.286*** (0.019) |
1.307*** (0.019) |
1.312*** (0.023) |
1.241*** (0.038) |
1.415** (0.091) |
1.145*** (0.005) |
| Turnover ratio | 1.014 (0.007) |
1.020 (0.007) |
1.030* (0.007) |
0.934 (0.026) |
1.008 (0.040) |
1.041*** (0.001) |
| Unemployment rate | 1.075** (0.018) |
1.207*** (0.018) |
1.137 (0.042) |
1.150** (0.034) |
1.083 (0.073) |
1.061 (0.007) |
| Unemployment rate^2 | 0.998* (0.001) |
0.994** (0.001) |
0.992 (0.003) |
0.996* (0.002) |
1.000 (0.003) |
0.996 (0.000) |
| Serviceability ratio (base = (10,20]) | ||||||
| (0,10] | 0.605*** (0.030) |
0.618*** (0.030) |
0.586*** (0.036) |
0.659*** (0.055) |
0.550*** (0.112) |
1.016* (0.005) |
| (20,30] | 1.418*** (0.019) |
1.400*** (0.019) |
1.469*** (0.023) |
1.280*** (0.037) |
1.150 (0.075) |
1.008 (0.004) |
| (30,40] | 1.803*** (0.024) |
1.768*** (0.024) |
1.923*** (0.028) |
1.497*** (0.048) |
1.367** (0.101) |
0.988 (0.006) |
| 40+ | 1.926*** (0.033) |
1.883*** (0.033) |
2.015*** (0.039) |
1.731*** (0.064) |
1.550*** (0.145) |
0.934*** (0.009) |
| Lagged change in interest rates (bps; base = (–2,2]) | ||||||
| <–25 | 0.774*** (0.034) |
0.771*** (0.034) |
0.770*** (0.041) |
0.764*** (0.062) |
0.718* (0.125) |
0.801*** (0.008) |
| (–25,–2] | 0.933* (0.032) |
0.931* (0.032) |
0.923* (0.038) |
0.939 (0.059) |
0.782 (0.138) |
0.880*** (0.007) |
| (2,25] | 1.032 (0.021) |
1.032 (0.021) |
1.015 (0.025) |
1.076 (0.042) |
1.121 (0.081) |
0.893*** (0.005) |
| 25+ | 1.188*** (0.035) |
1.189*** (0.035) |
1.179*** (0.042) |
1.196** (0.065) |
1.233 (0.122) |
0.992 (0.007) |
| Repayment buffer (months; base = (1,6]) | ||||||
| <1 | 2.322*** (0.019) |
2.306*** (0.019) |
2.293*** (0.023) |
2.371*** (0.036) |
2.309*** (0.076) |
0.983** (0.004) |
| 6+ | 0.334*** (0.031) |
0.331*** (0.031) |
0.331*** (0.036) |
0.343*** (0.060) |
0.435*** (0.135) |
0.870*** (0.005) |
| Income <$180,000 | 0.931* (0.023) |
0.972 (0.023) |
0.926* (0.028) |
0.949 (0.045) |
0.840 (0.087) |
0.991 (0.004) |
| Loan type (base = principal and interest (P&I)) | ||||||
| IO | 0.786*** (0.020) |
0.771*** (0.020) |
0.760*** (0.024) |
0.869*** (0.039) |
1.033 (0.079) |
1.019*** (0.004) |
| Switched to IO | 2.831*** (0.067) |
2.778*** (0.067) |
2.954*** (0.084) |
2.538*** (0.112) |
2.244** (0.245) |
1.184*** (0.023) |
| Switched to P&I – IO period expired |
1.944*** (0.048) |
1.925*** (0.048) |
1.913*** (0.059) |
2.022*** (0.086) |
2.350*** (0.151) |
1.330*** (0.016) |
| Switched to P&I – voluntary | 0.298*** (0.190) |
0.293*** (0.190) |
0.279*** (0.225) |
0.360** (0.356) |
0.645 (0.508) |
0.880*** (0.025) |
| Investor | 0.674*** (0.019) |
0.681*** (0.019) |
0.653*** (0.022) |
0.739*** (0.037) |
0.728*** (0.075) |
0.915*** (0.004) |
| Self-employed | 1.185*** (0.020) |
1.188*** (0.020) |
1.179*** (0.024) |
1.199*** (0.041) |
1.284 (0.094) |
0.866*** (0.005) |
| Multiple debtors | 0.732*** (0.015) |
0.726*** (0.015) |
0.707*** (0.018) |
0.794*** (0.029) |
0.898 (0.062) |
1.086*** (0.003) |
| SEIFA | 0.998*** (0.000) |
n/a | 0.998*** (0.000) |
0.998*** (0.000) |
0.998 (0.001) |
1.000 (0.000) |
| Mining share of employment | 1.018*** (0.002) |
1.016** (0.002) |
1.046 (0.022) |
1.011 (0.003) |
1.015 (0.004) |
0.983*** (0.001) |
| Previous discharge | 2.149*** (0.036) |
2.165*** (0.036) |
2.181*** (0.041) |
2.039*** (0.075) |
2.481*** (0.172) |
1.250*** (0.012) |
| Low documentation | 2.013*** (0.042) |
2.008*** (0.042) |
2.058*** (0.047) |
1.869*** (0.088) |
2.133 (0.380) |
1.093*** (0.014) |
| Fixed rate | 0.635*** (0.024) |
0.637*** (0.024) |
0.636*** (0.027) |
0.637*** (0.047) |
0.609*** (0.093) |
0.574*** (0.005) |
| Loan purpose (base = purchase) | ||||||
| Construction | 1.070 (0.043) |
1.065 (0.043) |
1.268*** (0.051) |
0.720*** (0.083) |
0.787 (0.127) |
0.999 (0.010) |
| Further advance | 1.478*** (0.104) |
1.480*** (0.104) |
1.324* (0.132) |
1.785*** (0.167) |
2.577* (0.319) |
1.220*** (0.020) |
| Refinance | 1.636*** (0.016) |
1.639*** (0.016) |
1.699*** (0.019) |
1.464*** (0.031) |
1.434*** (0.065) |
1.185*** (0.003) |
| Broker-originated | 1.012 (0.016) |
1.010 (0.016) |
0.999 (0.019) |
1.045 (0.032) |
0.966 (0.067) |
0.992 (0.003) |
| Region (base = capital city) | ||||||
| Major city | 1.029 (0.030) |
1.083 (0.030) |
1.002 (0.034) |
0.910 (0.120) |
0.837 (0.533) |
1.006 (0.006) |
| Regional centre | 1.069 (0.024) |
1.156*** (0.024) |
1.010 (0.032) |
1.077 (0.056) |
1.071 (0.104) |
0.885*** (0.006) |
| Remote | 1.336*** (0.028) |
1.529*** (0.027) |
1.302*** (0.036) |
1.270* (0.064) |
1.279 (0.132) |
0.826*** (0.008) |
| State fixed effects | Yes | Yes | Yes | Yes | Yes | Yes |
| Time fixed effects | Yes | Yes | Yes | Yes | Yes | Yes |
| Deal and issuer type | Yes | Yes | Yes | Yes | Yes | Yes |
| No of observations | 12,370,383 | 12,370,842 | 10,442,510 | 1,927,873 | 216,898 | 12,370,383 |
| No of events | 19,625 | 19,626 | 14,350 | 5,275 | 1,236 | 427,589 |
| Concordance ratio | 0.787 | 0.786 | 0.784 | 0.775 | 0.736 | 0.634 |
|
Notes: ***, ** and * denote statistical significance at the 0.1, 1 and 5 per cent levels, respectively; standard errors are in parentheses Sources: ABS; Author's calculations; CoreLogic data; RBA; Securitisation System |
||||||
| Dependent variable: | Entered foreclosure | Entered foreclosure | Entered foreclosure | Entered foreclosure | Entered foreclosure | Cured | Full repayment |
|---|---|---|---|---|---|---|---|
| Sample: | All loans | All loans | Non-mining | Mining-exposed | Negative equity | All loans | All loans |
| Model: | Base | Excl SEIFA | Base | Base | Base | Base | Base |
| Indexed scheduled LVR (base = (60,70]) | |||||||
| (0,30] | 0.783 (0.127) | 0.785 (0.127) | 0.691* (0.168) | 0.941 (0.215) | n/a | 1.175*** (0.035) | 1.130* (0.048) |
| (30,40] | 0.761 (0.138) | 0.758 (0.138) | 0.554** (0.182) | 1.367 (0.221) | n/a | 1.151*** (0.035) | 1.024 (0.049) |
| (40,50] | 0.756* (0.118) | 0.756* (0.118) | 0.598** (0.149) | 1.204 (0.201) | n/a | 1.106** (0.031) | 1.095 (0.041) |
| (50,60] | 0.902 (0.101) | 0.901 (0.101) | 0.882 (0.118) | 0.921 (0.198) | n/a | 1.101** (0.028) | 1.000 (0.038) |
| (70,80] | 1.170 (0.084) | 1.171 (0.084) | 1.171 (0.103) | 1.198 (0.149) | n/a | 1.001 (0.026) | 0.922 (0.037) |
| (80,90] | 1.688*** (0.085) | 1.690*** (0.085) | 1.850*** (0.112) | 1.514** (0.143) | n/a | 0.967 (0.030) | 0.818*** (0.044) |
| (90,100] | 2.097*** (0.095) | 2.098*** (0.095) | 2.540*** (0.142) | 1.772*** (0.147) | n/a | 0.942 (0.040) | 0.679*** (0.063) |
| (100,110] | 2.515*** (0.107) | 2.509*** (0.107) | 3.919*** (0.196) | 2.068*** (0.156) | n/a | 0.807*** (0.054) | 0.471*** (0.098) |
| (110,120] | 3.261*** (0.130) | 3.248*** (0.130) | 5.011*** (0.326) | 2.698*** (0.174) | 1.321* (0.125) | 0.831* (0.086) | 0.687** (0.132) |
| (120,150] | 3.443*** (0.129) | 3.404*** (0.129) | 8.596*** (0.305) | 2.874*** (0.173) | 1.582** (0.126) | 0.818* (0.088) | 0.581* (0.151) |
| (150,200] | 4.604*** (0.155) | 4.535*** (0.155) | 1.970 (1.011) | 4.025*** (0.193) | 1.988*** (0.167) | 0.434*** (0.178) | 0.927 (0.201) |
| 200+ | 7.542*** (0.189) | 7.515*** (0.189) | n/a | 5.380*** (0.231) | 2.795*** (0.209) | 0.276*** (0.323) | 1.957*** (0.193) |
| Original LVR (base = (60,80]) | |||||||
| (0,60] | 0.923 (0.083) | 0.919 (0.083) | 0.956 (0.123) | 0.847 (0.116) | 0.849 (0.258) | 0.957 (0.025) | 1.048 (0.034) |
| 80+ | 1.000 (0.052) | 1.002 (0.051) | 0.967 (0.078) | 1.045 (0.072) | 0.988 (0.120) | 0.945** (0.020) | 1.053 (0.028) |
| Turnover ratio | 0.921*** (0.019) | 0.924*** (0.019) | 0.902** (0.031) | 0.977 (0.042) | 1.040 (0.047) | 1.007 (0.007) | 1.074*** (0.010) |
| Unemployment rate | 1.104 (0.050) | 1.128* (0.048) | 0.831 (0.142) | 1.183* (0.076) | 1.036 (0.124) | 0.996 (0.019) | 0.927* (0.032) |
| Unemployment rate^2 | 0.998 (0.003) | 0.997 (0.003) | 1.015 (0.009) | 0.994 (0.004) | 1.000 (0.006) | 1.001 (0.001) | 1.003 (0.002) |
| Serviceability ratio (base = (10,20]) | |||||||
| (0,10] | 1.172 (0.085) | 1.179 (0.085) | 1.317 (0.132) | 1.151 (0.112) | 1.042 (0.184) | 1.097* (0.036) | 0.987 (0.051) |
| (20,30] | 0.828* (0.065) | 0.823* (0.065) | 0.786* (0.096) | 0.869 (0.090) | 1.036 (0.140) | 0.985 (0.023) | 1.030 (0.033) |
| (30,40] | 0.817 (0.089) | 0.814* (0.089) | 0.753* (0.128) | 0.887 (0.127) | 1.141 (0.192) | 0.994 (0.031) | 1.100* (0.043) |
| 40+ | 0.891 (0.112) | 0.881 (0.111) | 0.969 (0.172) | 0.912 (0.148) | 1.178 (0.239) | 0.988 (0.043) | 0.962 (0.061) |
| Income <$180,000 | 0.890 (0.075) | 0.901 (0.074) | 0.825 (0.121) | 0.900 (0.097) | 0.675 (0.141) | 1.083* (0.031) | 0.940 (0.041) |
| Loan type (base =P&I) | |||||||
| IO | 1.198** (0.055) | 1.193** (0.055) | 1.068 (0.086) | 1.286** (0.074) | 1.201 (0.110) | 1.081** (0.021) | 1.012 (0.031) |
| Switched to P&I – IO period expired | 1.026 (0.095) | 1.025 (0.095) | 0.817 (0.165) | 1.121 (0.118) | 0.863 (0.164) | 1.001 (0.038) | 1.109 (0.051) |
| Investor | 1.334*** (0.050) | 1.337*** (0.050) | 1.481*** (0.074) | 1.219* (0.070) | 1.235 (0.108) | 1.000 (0.020) | 1.096** (0.027) |
| Self-employed | 1.062 (0.054) | 1.059 (0.054) | 1.112 (0.079) | 0.990 (0.076) | 0.924 (0.122) | 0.990 (0.019) | 1.151*** (0.026) |
| Multiple debtors | 0.766*** (0.043) | 0.766*** (0.043) | 0.641*** (0.064) | 0.889 (0.058) | 1.430*** (0.093) | 1.041* (0.015) | 1.152*** (0.022) |
| SEIFA | 0.999 (0.000) | n/a | 0.999 (0.001) | 0.999 (0.001) | 1.000 (0.001) | 1.001*** (0.000) | 1.001*** (0.000) |
| Mining share of employment | 1.000 (0.003) | 0.999 (0.003) | 0.901 (0.076) | 1.004 (0.004) | 0.993 (0.006) | 0.995 (0.002) | 0.992 (0.004) |
| Previous discharge | 0.983 (0.127) | 0.984 (0.127) | 1.235 (0.157) | 0.627* (0.226) | 0.710 (0.434) | 0.709*** (0.051) | 0.931 (0.064) |
| Restructuring arrangements | 0.364*** (0.084) | 0.363*** (0.084) | 0.336*** (0.120) | 0.388*** (0.121) | 0.554** (0.184) | 1.190*** (0.022) | 0.860*** (0.032) |
| Low documentation | 1.083 (0.099) | 1.077 (0.099) | 1.000 (0.134) | 1.193 (0.149) | 1.448 (0.352) | 0.768*** (0.038) | 0.891 (0.049) |
| Fixed rate | 0.864 (0.084) | 0.863 (0.084) | 0.853 (0.126) | 0.885 (0.113) | 0.794 (0.178) | 1.016 (0.027) | 0.849*** (0.041) |
| Loan purpose (base = purchase) | |||||||
| Construction | 1.145 (0.100) | 1.142 (0.100) | 1.556** (0.140) | 0.919 (0.145) | 0.850 (0.206) | 0.896** (0.042) | 0.857** (0.062) |
| Further advance | 0.793 (0.243) | 0.791 (0.243) | 0.531 (0.455) | 0.876 (0.294) | 0.826 (0.425) | 0.902 (0.076) | 1.033 (0.094) |
| Refinance | 1.007 (0.047) | 1.007 (0.047) | 1.088 (0.070) | 0.946 (0.065) | 0.931 (0.106) | 1.001 (0.017) | 1.039 (0.024) |
| Broker-originated | 1.192** (0.047) | 1.192** (0.047) | 1.216* (0.070) | 1.183* (0.064) | 1.124 (0.098) | 1.058** (0.016) | 0.791*** (0.024) |
| Region (base = capital city) | |||||||
| Major city | 1.325* (0.107) | 1.330* (0.107) | 1.401* (0.118) | 1.644 (0.419) | 0.696 (0.801) | 0.986 (0.032) | 0.939 (0.042) |
| Regional centre | 1.568*** (0.061) | 1.588*** (0.060) | 1.280* (0.102) | 1.714*** (0.105) | 1.675** (0.179) | 1.038 (0.024) | 0.941 (0.035) |
| Remote | 1.556*** (0.073) | 1.618*** (0.068) | 1.757*** (0.105) | 1.501** (0.127) | 1.386 (0.215) | 1.040 (0.027) | 0.742*** (0.043) |
| State fixed effects | Yes | Yes | Yes | Yes | Yes | Yes | Yes |
| Origination year fixed effects | Yes | Yes | Yes | Yes | Yes | Yes | Yes |
| Time fixed effects | Yes | Yes | Yes | Yes | Yes | Yes | Yes |
| Deal and issuer type | Yes | Yes | Yes | Yes | Yes | Yes | Yes |
| No of observations | 42,136 | 42,141 | 30,401 | 11,735 | 2,796 | 42,136 | 42,136 |
| No of events | 2,388 | 2,389 | 1,092 | 1,296 | 572 | 18,187 | 9,016 |
| Concordance ratio | 0.791 | 0.791 | 0.787 | 0.756 | 0.732 | 0.579 | 0.634 |
|
Notes: ***, ** and * denote statistical significance at the 0.1, 1 and 5 per cent levels, respectively; standard errors are in parentheses Sources: ABS; Author's calculations; CoreLogic data; RBA; Securitisation System |
|||||||