RDP 2020-02: The Distributional Effects of Monetary Policy: Evidence from Local Housing Markets 5. The Distributional Effects of Monetary Policy on Housing Wealth
February 2020
- Download the Paper 1,879KB
5.1 Identification
Next, we estimate a version of the model where the focus is on the heterogeneity in price levels across local housing markets. This version of the model directly tells us about the link between monetary policy and inequality in housing wealth. For example, if changes in monetary policy affect prices in expensive areas by more than in cheap areas, this would suggest that monetary policy affects housing wealth inequality.
For this exercise, we adopt an alternative approach to the unrestricted model to control for macroeconomic conditions. Specifically, time fixed effects are included in the model and the focus is solely on the differences in sensitivity to monetary policy across local housing markets. If we estimate Equation (1) as it stands and include time fixed effects then we will not be able to separately identify the effect of monetary policy , as it only varies with time and hence is not linearly independent:
But we can still identify differences (from some baseline) in the sensitivity to monetary policy across regions. To see this, suppose we have just two local housing markets, A and B, where region A is more expensive on average than region B. We are interested in identifying whether more expensive regions are more sensitive to monetary policy than less expensive regions. While we cannot estimate the equation above, we can estimate this:
where D is a dummy variable that is equal to one if the region is A and zero if the region is B. The estimates of the time fixed effects will set the baseline (in this case, region B) and the estimate of will capture the difference between regions A and B in their sensitivity to monetary policy. We can then test whether monetary policy has a different effect on housing price growth depending on how expensive the region is.
As before, we also need to account for the fact that macroeconomic conditions can have differential effects on local housing markets, and it may be that monetary policy is endogenously responding to these changes in the economy. So, similar to before, we include controls for macroeconomic conditions and interact them with the dummy variable to control for these differential effects:
The local housing markets are divided into price deciles depending on how expensive they are. To do this we group regions based on their ‘initial’ housing price level. We divide SA3 regions into price deciles based on the average sale price between 1991 and 1994. We set each local housing market to remain in the same decile over the sample period. This is to prevent endogenous changes in price groups driven by monetary policy. This choice is supported by the data. Between the early 1990s and 2019, only 6 per cent of local housing markets moved more than two price deciles. The persistence of these gaps in pricing suggest that housing price differences are at least in part determined by longer-term supply conditions, such as geographic or zoning constraints. (Gyourko, Mayer and Sinai 2013).
We also impose the restriction that local housing markets in the same price decile respond similarly to monetary policy . We refer to this as the ‘restricted model’:
where all the notation is as before, but now we also have an indicator variable equal to one if region i belongs to national price decile g = 1,…,10 (Decileg). The set of coefficients represents the effect of cash rate changes on housing prices h periods ahead for each decile g, after controlling for changes in macroeconomic conditions (included in the control variables Xt) The housing market groupings non-parametrically allow different deciles to have different responses to monetary policy. Adding time fixed effects to the model and removing the 5th decile (i.e. the 40th to 50th percentile) makes the 5th decile our benchmark (denoted by subscript b). The use of the benchmark modifies the interpretation of the coefficients . These coefficients represent the difference in the housing price response of decile g relative to the price response of the 5th decile. In the baseline model, we include four lags of the change in the cash rate as well as controls for year-ended growth in GDP, the terms of trade and the unemployment rate. We also allow these controls to have differential effects on the price deciles by interacting them with the dummy variables for each price decile.
5.2 Results
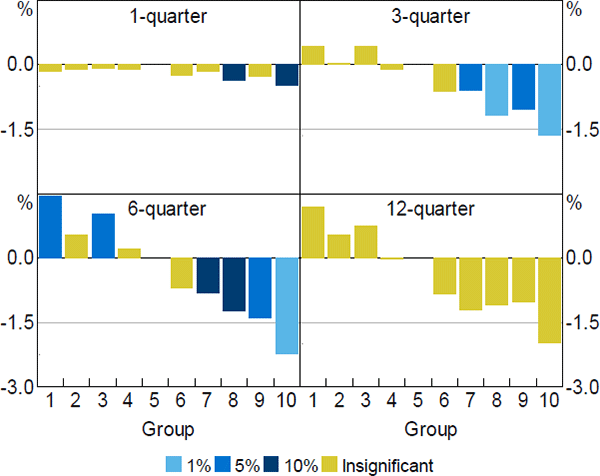
The estimated coefficients of the restricted model are presented in Figure 4. Recall that this model estimates the differential effect of monetary policy between price deciles and the median group (the 5th decile). The results suggest that monetary policy has heterogeneous effects across the distribution of price levels. Specifically, following an increase in the cash rate, housing prices in more expensive housing markets (the upper deciles) fall more strongly than prices in cheaper markets (the lower deciles).
Note: Colours represent level of significance of estimated coefficients using standard errors clustered across time and state (or territory)
Sources: ABS; Authors' calculations; CoreLogic data; RBA
The largest differences in response to monetary policy changes occur in the top half of the price distribution. We find that a 100 basis point increase in the cash rate is associated with housing prices falling by more in the expensive areas after about three quarters. The peak difference in housing price responses occurs six quarters following the change in monetary policy at about –1.4 per cent, on average. This implies, for example, that housing prices would fall by about 3.7 per cent in the top four price deciles if prices in the median area fall by 2.3 per cent in response to a 100 basis point increase in the cash rate. In the bottom half of the price distribution, local areas appear to be less sensitive to changes in the cash rate than the median area, though the evidence is less clear.
The differential effects of monetary policy changes on housing prices appear to be temporary. The differences across all price deciles becomes statistically insignificant beyond two years. These spatial deviations in prices are indicative of housing market frictions, as price differentials should not be observed in efficient markets. These frictions could reflect transaction costs, home bias of buyers or asymmetric information. However, the temporary nature of the price differentials suggest that the frictions dissipate over time.[22]
5.3 Housing Supply Factors
So why are more expensive areas more sensitive to monetary policy? A possible explanation is that more expensive areas are more constrained in terms of new housing supply. In the long-run, housing prices should move in line with construction costs. But there is evidence of systematic short-run deviations, which suggests that land availability matters (Himmelberg et al 2005).
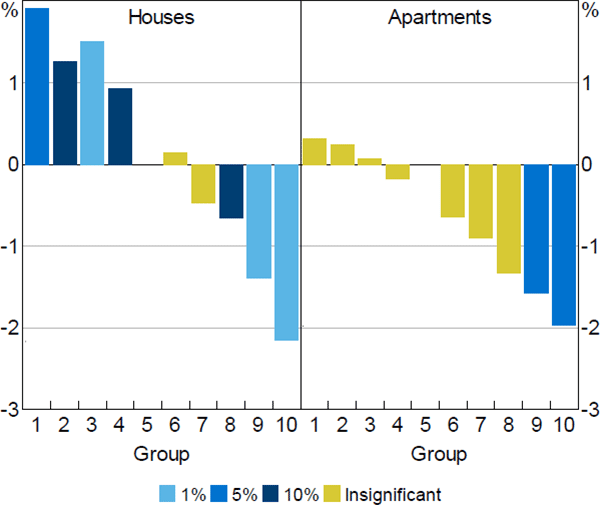
We test this hypothesis by separately estimating the effect of monetary policy on the price distribution of detached homes and apartments across local areas. Detached houses are naturally more sensitive to changes in land value than apartments, as land represents a larger proportion of the value of detached houses (Kendall and Tulip 2018). So, if land availability matters, then monetary policy should be able to affect the price distribution of detached houses more than the price distribution of apartments. In our asset pricing model, this would be represented through a more negative value of for detached houses than apartments.
To estimate these models, we redefine the price deciles for houses and apartments separately. This allows us to directly answer if monetary policy alters the price distribution of houses or apartments.[23] Our results provide some weak evidence for the ‘land availability hypothesis’. We find that the price distribution of detached houses are slightly more sensitive than apartments to cash rate changes (Figure 5). Here, in response to a 100 basis point increase in cash rate, the peak difference between the most expensive 30 per cent of areas and the median group for detached houses and apartments is on average −1.2 and −1.5 percentage points, respectively. The key difference between the responses of houses and apartments occurs at the lower end of the price distribution. For detached houses, areas in the cheapest 30 per cent of areas experience a differential response to the median group of around 1.6 percentage points. These effects are statistically significant. However, for apartments in price groups below the median, the differences in price response to changes in monetary policy relative to the median group are small and statistically insignificant. This provides some evidence to suggest that changes in monetary policy do not meaningfully alter the distribution of apartment prices across regions.
Evaluating the estimates jointly, we find that the differences between the estimates for houses and apartments are not statistically different from one another. Moreover, it is difficult to determine if these effects are confounded by the degree of substitutability between apartments and houses. For example, increases in house prices may spillover into the apartments if the demand to own housing is inelastic. Overall, we view these results as weak evidence to land availability driving the heterogeneous response of housing prices across the distribution of housing wealth.
Note: Colours represent level of significance of estimated coefficients using standard errors clustered across time and state (or territory)
Sources: ABS; Authors' calculations; CoreLogic data; RBA
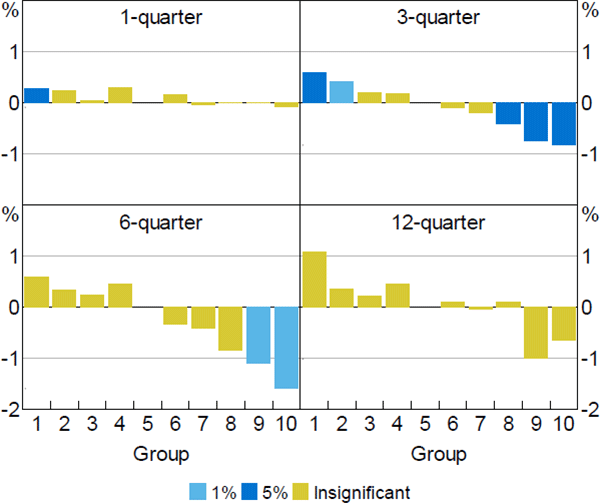
An alternative approach to capture the role of land is to disentangle the land value from the cost of the structure following the methodology of Kendall and Tulip (2018).[24] Specifically, for each local area, we estimate a hedonic regression on home sale unit record data. We then calculate the physical land component of a dwelling by taking the average sales price and multiplying it by the estimated coefficient of land on price (i.e. elasticity of price to land). The local areas can then be divided into deciles based on the share of the sales price that is accounted for by the physical land component. And then we can re-estimate the restricted model using these new groupings and explore the variation across local areas based on the value of physical land.
The deciles using this measure of value determined by land differ from the baseline specification that divides areas by average sales price from the early 1990s. The correlation between the measure of proportion of value determined by land in an area and average sales price is 0.41, suggesting that there is some overlap between the groupings but enough difference to be indicative if the land availability hypothesis is a valid explanation to the differentials generated in our baseline restricted model.
Doing so, we find that housing prices are more sensitive to the cash rate in areas where land is valuable (Figure 6). Specifically, following a 100 basis point increase in the cash rate, the top two deciles experience a larger fall in housing prices relative to then benchmark group. This effect peaks at around –1.34 per cent, six quarters following the change in the cash rate. These effect sizes and timings are comparable to our baseline restricted model estimates. These results are consistent with land availability being an important driver of the heterogeneity in sensitivity to monetary policy across housing price levels.[25]
Note: Colours represent level of significance of estimated coefficients using standard errors clustered across time and state (or territory)
Sources: ABS; Authors' calculations; CoreLogic data; RBA
Overall, we find some evidence to suggest that land availability plays some role in driving the heterogeneous response of housing prices across price deciles. However, the results comparing apartment and housing prices suggest other factors could also be important. This is consistent with the previous section that found a variety of factors related to both supply and demand are important in explaining the distribution of responses of housing prices across all local areas.
Footnotes
The analysis uses a hedonic index to measure housing prices so as to abstract from differences in the quality of housing. But part of the heterogeneity in the response of local housing markets may be through changes in housing quality, leading us to underestimate the differential effects of monetary policy. We also estimate the restricted model using median sales prices as the dependent variable. The baseline results are robust to this change. The expensive areas respond by more, and the heterogeneity in price responses across regions is very similar. This suggests that the quality of the housing stock does not change much in response to monetary policy over a two-year horizon. [22]
Estimates when using the price groups defined in our baseline restricted model produce a similar finding that there is no strong evidence for land availability driving the heterogeneous response of housing prices across the distribution of housing wealth. [23]
More details in Appendix B. [24]
We also tested whether supply constraints were driving the price responses by examining how dwelling investment responds to monetary policy changes across local housing markets. However, our proxy for dwelling investment – home building approvals – was too noisy at a quarterly frequency (and over a relatively short time window) to generate any meaningful results. [25]