RDP 2019-01: Online Appendices: A Model of the Australian Housing Market Appendix B: Housing Construction
March 2019
- Download the Online Appendices 1,185KB
There has been a reasonably stable long-run relationship between building approvals, commencements, work done, investment, and completions. As a building approval is required before construction can commence on a new dwelling, we start with estimates of approvals, then map these through to other construction variables. These relationships are shown by the purple boxes in Figure A1.
B.1 Residential Building Approvals
Building approvals feed into two separate chains of variables.
- Constant price measures of approvals are used to estimate dwelling investment and the real value of the housing stock.
- The number of new building approvals is used to estimate completions and the number of dwellings, which in turn, feed into estimates of the rental vacancy rate.
The different measures of building approvals (i.e. constant price and number) are related to each other by the average quality of new dwellings. The equations for the constant price measures of building approvals are discussed in Section 4.1 of the paper.
Number of approvals
We estimate separate equations for the constant price measures and average quality of approvals, then back out the number of approvals using the following identity:
where APPNO is the number of approvals, APP is the chain volume measure of approvals, and QUALITY is the quality, or average volume, of approvals. A key advantage of this approach (relative to directly estimating the number of approvals) is that the quality of approvals is much less volatile than the number of approvals, so it is easier to estimate. Relatedly, the number of approvals drives the cyclical variation in the constant price measures of approvals. Having separate equations for both the number and constant price measure of approvals could result in inconsistent estimates of the housing construction cycle.
Quality of approvals
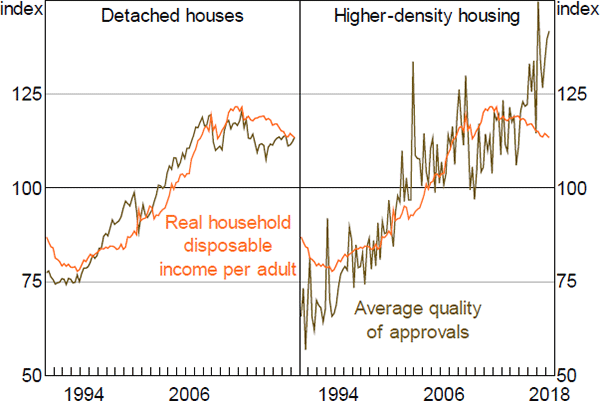
We assume that the quality (or average volume) of approvals increases in line with real income per capita in the long run.
where quality is the average volume of dwelling approvals, hhdy_capita is real household disposable income per adult (15+ years), and Δhhdy_capita* is steady-state growth of real income per adult. All variables are in natural logs.
We have used simple assumptions for the two parameters in Equation (B1): λ and θ.
- The speed of adjustment coefficient, λ, is set equal to the speed of adjustment for the constant price measure of approvals (Equation (1) in the paper). This ensures that the responses to income from Equation (1) and Equation (B1) are broadly consistent.
- θ is the steady-state ratio of the average quality of approvals and real income per capita (in logs). We assume θ is equal to the average value of this log-ratio in the final two years of our sample. We calculate this average over a two-year period (as opposed to a longer horizon), so that θ is fairly responsive to recent data: while real income per adult and the average volume of approvals have grown at a similar rate in the long run (Figure B1), it is not clear that the ratio of these variables should be stationary.
Source: ABS
This specification has a couple of important implications.
First, increases in real income per capita lead to an increase in the quality of new housing, but have little effect on the number of new dwellings. It is somewhat puzzling that changes in income per capita have little effect on the number of dwellings while changes in interest rates and housing prices have very large effects. However, this seems to be a feature of the data for Australia.
Second, the number of approvals grows at the same rate as the adult population in the long run. This implies that average household size will be stable. As discussed in Section 4.3 of the paper, a more complicated model might be able to model household size as decreasing with income and increasing with rent. This is left for future work.
Private and public building approvals
The previous estimates of residential building approvals do not distinguish between private and public approvals. This is not important for our estimates of the number of dwellings (which includes all additions to the housing stock), but it is an issue for our estimates of dwelling investment (which only includes the private sector).
For each component of commencements, we use an AR(4) in log levels to estimate the volume of public sector commencements. We then subtract public commencements from our previous estimates of total commencements to estimate private sector building commencements.
B.2 Construction Activity
Constant prices
We use single equation error correction models to map the volume of building approvals to commencements, then commencements to work done. We then assume growth of national accounts investment is equal to growth of work done. Separate equations are estimated for each component of housing construction. We have restricted the long-run elasticity in each of these equations to equal 1, so that approvals and investment grow at the same rate in the long run.
As shown in Figure B2, around 50 per cent of the investment in detached houses is estimated to be completed within one quarter of the building approval, and around 90 per cent within four quarters. Construction times on higher-density housing are likely to be much more variable. Nevertheless, the data suggest that most projects commence shortly after a building approval is issued and, on average, around 70 per cent of the work done on projects is completed within four quarters of the approval.
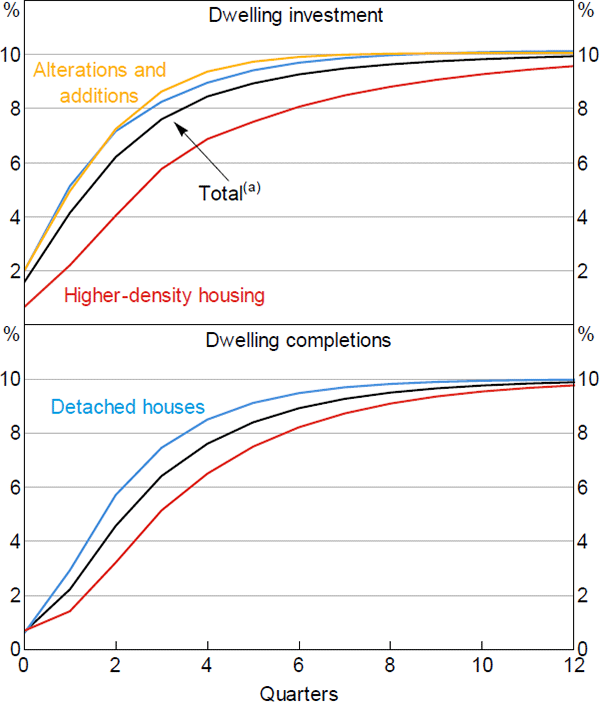
Note: (a) Weighted by shares in national accounts dwelling investment
Sources: ABS; Authors' calculations
Number
Similar to the constant price measures of construction activity, we use single equation error correction models to map the number of building approvals to commencements, then commencements to completions.
We estimate that for detached houses, around 30 per cent of completions occur within one quarter of the building approval, and around 85 per cent within four quarters. For higher-density housing, around 65 per cent of dwellings are completed within four quarters of the approval.
B.3 Dwelling Stock
Constant prices
Quarterly estimates of the constant price dwelling stock are constructed by combining annual data on the dwelling stock (from the Australian System of National Accounts (ASNA)) with quarterly estimates of net additions to the housing stock. Net additions to the housing stock are based on estimates of dwelling investment and the replacement rate (which includes both demolitions and depreciation). Specifically, in quarters where national accounts data are not available, we use the equation below to calculate estimates of the dwelling stock.
The replacement rate is estimated by comparing the dwelling stock in two successive releases of the ASNA and total dwelling investment during this period. That is, the difference between total gross additions to the dwelling stock and the actual change in the dwelling stock equals the loss from depreciation and demolitions.
Number of dwellings
The process for estimating the number of dwellings is similar to that for the constant price measure of the dwelling stock (see above). The ABS Census provides data on the number of dwellings in Australia every five years.[1] These data are used as a benchmark for our quarterly estimates of the number of dwellings. Specifically, we use the equation below to estimate the number of dwellings for intercensal periods.
The number of demolitions is estimated by comparing the dwelling stock measured in two successive Census surveys and the number of completions during this period. That is, the difference between total gross additions to the dwelling stock and the actual change in the dwelling stock equals demolitions. To apportion the total between Census years, we assume that the number of demolitions in each quarter is proportional to the number of completions in that quarter. The intuition being that the greater the number of completions in a given period, the greater the number of demolitions needed to make room for these new homes. After the 2016 Census, we assume the demolition rate is unchanged at 8.3 per cent of completions.
B.4 Coverage of Alterations and Additions Data
The ABS publishes data on building approvals, commencements and work done for large alterations and additions (valued over $10,000). However, expenditure on large alterations and additions only accounts for around a quarter of total spending on alterations and additions (Figure B3).[2] Large alterations and additions share of total alterations and additions investment has also changed over time, increasing from around 21 per cent in the early 2000s.
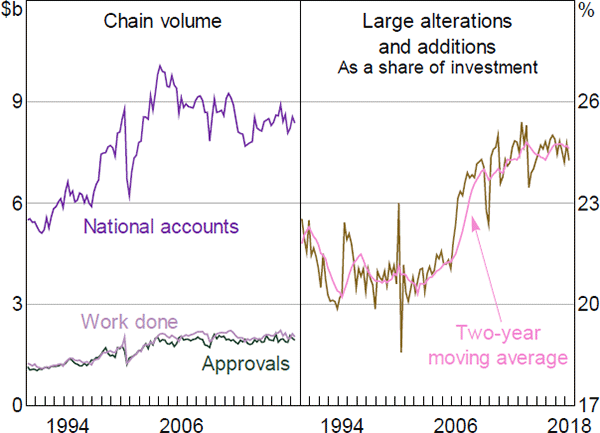
Source: ABS
This raises an issue for our estimates of alteration and additions approvals. Without any adjustments to the data, this equation would estimate the effect of interest rates and dwelling prices on large alterations and additions, rather than total alterations and additions.
To address this issue, we have scaled the data on large alterations and additions approvals, commencements, and work done, so that the levels of these data are representative of total alterations and additions investment. The data have been scaled using a two-year moving average of the ratio of work done to the national accounts measure of alterations and additions investment.
where y is {approvals, commencements, work done} for large alterations and additions, ŷ is the scaled data, wd is work done on large alterations and additions, and na is the national accounts measure of total alterations and additions investment.
Footnotes
The dwelling stock is defined as the sum of all occupied and unoccupied dwellings from the Census, less caravans, house boats, cabins and improvised homes. [1]
The ABS use estimates from the Construction Industry Survey (CIS) as a benchmark for the national accounts measure of alterations and additions investment. This survey is conducted every six to seven years. To estimate quarterly investment between each CIS, the ABS primarily use estimates of work done on large alterations and additions. Information from the Household Expenditure Survey (HES) is also used as a crosscheck on these estimates. [2]