RDP 2015-05: The Social Costs of Currency Counterfeiting 4. A Structural Model of Counterfeiting and Methods of Payment
May 2015 – ISSN 1448-5109 (Online)
- Download the Paper 881KB
In this section, we use a structural VAR to identify the effects of counterfeiting activity on payments activity. This specification is designed to capture substitution effects between payment methods when there is a shock to counterfeiting.[9] We then use the implied substitution effects in conjunction with data from previous payment cost studies to estimate the social cost of counterfeiting associated with a loss of confidence in the currency.
4.1 The Data
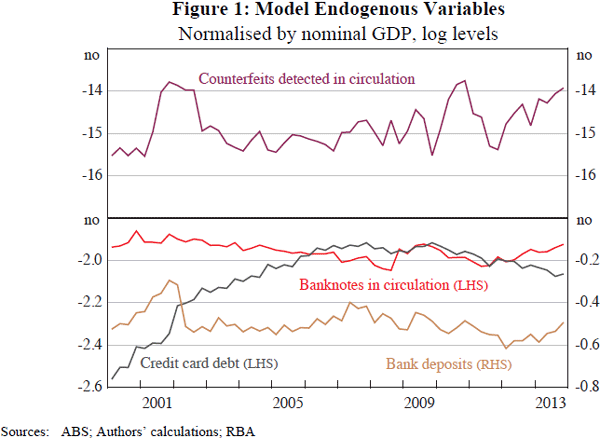
We use quarterly Australian data covering the sample period from March quarter 2000 to December quarter 2013.[10] The model includes four endogenous variables – the stock of banknotes in circulation, the stock of bank deposits, the stock of credit card debt, and the flow of counterfeits detected and removed from circulation (Table 3). The stock of banknotes in circulation represents the demand for banknotes and is used to measure the effect of counterfeiting on confidence in the currency. The stock of bank deposits is included to capture the effect of counterfeiting on debit card and eftpos payments.[11] Finally, the stock of credit card debt is included to capture the effect of counterfeiting on credit card payments.[12] While flows data might capture these effects more directly, it is difficult to measure cash transactions in the economy. Another reason to use stocks for banknotes in circulation, bank deposits and credit card debt is to allow for potential long-run (or cointegrating) relationships between these variables.[13] We find in robustness tests below that the stocks data are consistent with flows data. In particular, using the value of eftpos and credit transactions instead of bank deposits and credit card debt yields qualitatively similar results.[14]
| Volume ('000) | Value (A$ million) | Ratio to nominal GDP (per cent) | |
|---|---|---|---|
| Counterfeits detected in circulation | 2 | 0.1 | 0.00004 |
| Banknotes in circulation | 926,560 | 38,653 | 14.1 |
| Bank deposits | 166,311 | 60.9 | |
| Credit card debt | 35,854 | 12.7 | |
|
Sources: ABS; Authors' calculations; RBA |
|||
The data enters the model in log levels, and all endogenous variables are normalised by seasonally adjusted nominal GDP (Figure 1). This normalisation is motivated in two ways. First, standard models of currency demand suggest that the stock of banknotes in circulation depends on the level of income. Second, this normalisation can account for any demand shocks that could potentially influence the extent of counterfeiting and the demand for payments simultaneously.
We also include dummy variables to control for effects of the global financial crisis and seasonal effects. Finally, we include as an additional exogenous variable the quarterly average cash rate in level terms. This is consistent with standard models of currency demand where the return on bank deposits captures the opportunity cost of holding currency.[15] Details of data sources used in the model can be found in Appendix A.
4.2 The Model
We identify counterfeiting shocks and estimate their effects on other payment methods using a structural VAR model:

Where Yt is a vector containing the endogenous variables; and Xt is a vector containing the exogenous variables – the cash rate, financial crisis and seasonal dummy variables. The A1 matrix captures the effects of lags of the endogenous variables, and the vector γ0 captures the contemporaneous effect of the exogenous variables in each equation in the system. The matrix A0 contains information on the contemporaneous relationships between the endogenous variables. The vector of equation residuals, εt, are identified as the structural shocks to the system.
We identify counterfeiting shocks using a recursive ordering approach; we restrict the parameters of A0 such that counterfeiting shocks affect all payment types with a lag.[16] That is, we assume that it takes time for substitution effects to occur following a counterfeiting shock. It may take time for the public to learn about an increase in counterfeiting activity and make the decision to use other payment methods. Also, it may take time for these payment decisions to take effect if the public smooths their consumption.
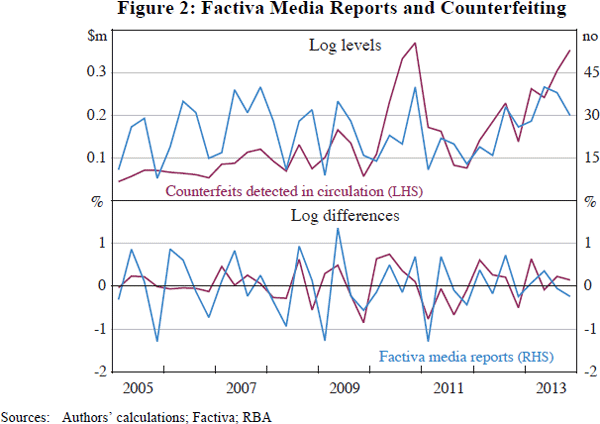
In support of our timing assumption, we examine media coverage of counterfeiting activity as a critical part in the transmission of the effect of counterfeiting on confidence. Figure 2 highlights media reports concerning counterfeiting recorded in the Factiva media database in comparison to actual counterfeiting activity.[17] On first inspection, there appears to be co-movement between media reports and counterfeits detected. Testing for correlation between the log-differenced data, we find evidence of correlation between counterfeits detected and the first lag of the Factiva media reports series, as well as contemporaneous correlation. We also find evidence at the 95 per cent level of significance that counterfeits detected Granger-causes Factiva media reports in a bivariate VAR.[18] This is consistent with counterfeits being detected and then subsequently being reported in the media.
4.3 Results
We estimate the effect of a counterfeiting shock on the different payment methods. Figure 3 shows the impulse response functions associated with a positive one standard deviation shock to counterfeits detected in circulation, which is an increase of 30 per cent in the first quarter (as shown in the top left panel of Figure 3). The shock has some persistence with increases in counterfeits detected for around five quarters before subsiding.
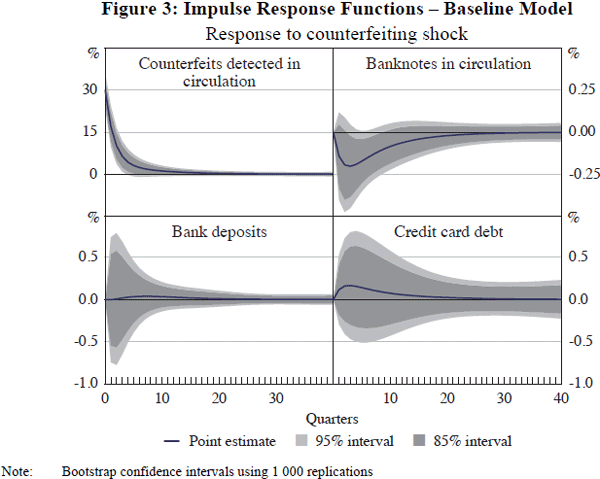
Point estimates suggest that the value of banknotes in circulation declines in response to a counterfeiting shock, which is consistent with a loss of confidence in the currency. The peak effect of the response occurs two quarters after the shock at −0.20 per cent. The stock of bank deposits responds positively to the shock by 0.04 per cent, consistent with the public conducting more electronic transactions through their deposit accounts, such as eftpos and debit card transactions. Finally, the response of the stock of credit card debt is also positive which suggests that the public also increase their use of credit cards following a shock. The increase reaches a maximum of 0.16 per cent after two quarters.
The impulse responses in Figure 3 are consistent with a loss of confidence in the currency and substitution to alternative methods of payment. In particular, without imposing any restriction on the change in overall transaction activity, we find that a 0.2 per cent decline in the use of currency is exactly offset by a 0.2 per cent increase in electronic transaction activity – taking the changes in stock variables as an indicator of the change in electronic card activity. The cumulative effects for these variables also closely offset, with a 2.1 per cent decline in the use of currency and a 2.3 per cent increase in electronic transaction activity over the ten years following the shock.
Nevertheless, Figure 3 also illustrates that there is considerable statistical uncertainty around these point estimates. The 95 per cent and 85 per cent confidence intervals for the responses of bank deposits and credit card debt encompass zero.
Using the same variables in a potentially cointegrated system implies that the response of bank deposits is larger and statistically significant (Appendix B). In sum, we view these results as consistent with the presence of substitution effects, but they are not identified with much precision. This is not surprising given that there have been relatively few episodes of large counterfeiting operations in Australia, and so it is hard to pin down the effects of counterfeiting on people's behaviours.
4.4 Quantifying the Social Cost of Substitution Effects
To provide some indication of the social costs associated with the counterfeiting shock identified in the structural VAR model above, we undertake the following scenario analysis. We consider the one standard deviation shock to counterfeiting identified in Figure 3. We assume that credit card transactions and deposit account transactions increase by the same proportion as credit card debt and bank deposits in response to the counterfeiting shock in Figure 3, and that these additional credit card and deposit account transactions would otherwise be made using cash in the absence of the counterfeiting shock.
The counterfeiting shock reflects a cumulative increase in counterfeits detected totalling around A$140,000 spread over a period of ten years. The size of this counterfeiting shock is consistent with data on previous known counterfeiting operations in Australia. The counterfeiting shock is around the same size of a number of smaller counterfeiting operations which were shut down fairly quickly, but smaller than some more significant counterfeiting operations in the data.
Deposit account transactions could be made using a proprietary debit card (e.g. eftpos) or a scheme debit card (e.g. MasterCard/Visa debit). We assume that the effect of counterfeiting on bank deposits is attributable to substitution from cash to eftpos. This gives us a conservative estimate of the social cost associated with the counterfeiting shock, as the social cost associated with using eftpos is less than a scheme debit card.
To quantify the additional costs associated with the change in payments behaviour, we use cost estimates from previous Australian studies on the resource costs associated with different means of payment.[19] Most recently, Stewart et al (2014) estimate that the average size credit card transaction is A$0.99 more expensive than the average size cash transaction, while the average size eftpos transaction incurs broadly the same costs as cash (Table 4). In comparison, a previous study published in 2008 estimated that credit card transactions incur a cost A$0.66 greater than cash, while eftpos transactions cost A$0.12 more than cash, for the average size transaction (Schwartz et al 2008). Finally, a joint study produced by the Reserve Bank of Australia and the Australian Competition and Consumer Commission estimated the resource costs to financial institutions associated with both debit and credit card schemes (RBA and ACCC 2000). Cash is found to be A$0.08 more costly than eftpos transactions, while credit card transactions are A$1.87 more expensive than cash transactions. Although the cost estimates provided in each study are not conceptually identical, they are indicative of the social cost of making payments over the sample 2000 to 2013, and so we use the average cost implied across the three studies.[20]
| Credit cards | eftpos | Cash | |
|---|---|---|---|
| Stewart et al (2014) | |||
| Private costs | |||
| Financial institutions – direct payment costs | 0.82 | 0.24 | 0.20 |
| Merchant | 0.66 | 0.24 | 0.29 |
| Total cost | 1.48 | 0.48 | 0.49 |
| Increase in cost over cash | 0.99 | −0.01 | |
| Schwartz et al (2008) | |||
| Production costs | |||
| Financial institutions – direct payment costs | 0.59 | 0.22 | 0.18 |
| Merchant | 0.40 | 0.31 | 0.24 |
| Public sector | 0.01 | ||
| Consumer costs | 0.22 | 0.14 | 0.12 |
| Total cost | 1.21 | 0.67 | 0.55 |
| Increase in cost over cash | 0.66 | 0.12 | |
| RBA and ACCC (2000) | |||
| Private costs | |||
| Financial institutions – direct payment costs | 1.93 | 0.15 | na |
| Merchant | 0.43 | 0.26 | na |
| Total cost | 2.36 | 0.41 | 0.49 |
| Increase in cost over cash | 1.87 | −0.08 | |
|
Sources: Authors' calculations; RBA and ACCC (2000, Tables 4.1, 5.1 and 6.1); Schwartz et al (2008, Table 11); Stewart et al (2014, Table A1) |
|||
Under this scenario, a total increase in counterfeits detected of around A$140,000 spread over a ten-year horizon leads to a cumulative increase in credit card transactions of 1.8 per cent over ten years, and 0.5 per cent in total eftpos transactions. This in turn implies a total increase in social costs of A$7.0 million, with estimates averaged over the three transaction cost studies (Table 5).
| Credit card | eftpos | Total | |
|---|---|---|---|
| Average number of transactions (million) | 332.4 | 418.8 | 751.2 |
| Cumulative response to counterfeiting shock (per cent) | 1.8 | 0.5 | |
| Increase in number of transactions (million) | 6.0 | 2.1 | 8.1 |
| Estimated social costs (A$ million) | |||
| Stewart et al (2014) | 5.9 | 0.0 | 5.9 |
| Schwartz et al (2008) | 3.9 | 0.2 | 4.2 |
| RBA and ACCC (2000) | 11.2 | −0.2 | 11.0 |
| Average social cost (A$ million) | 7.0 | 0.0 | 7.0 |
|
Sources: Authors' calculations; RBA; RBA and ACCC (2000, Tables 4.1, 5.1 and 6.1); Schwartz et al (2008, Table 11); Stewart et al (2014, Table A1) |
|||
These estimates indeed imply that the scale of the effect of counterfeiting on social costs is large, and we now discuss three possible explanations for its magnitude. First, the perceived threat of counterfeiting, not the actual threat, influences the public's payments behaviour. If the public perceive a higher probability of receiving a counterfeit than the actual probability (due to media coverage, for example), or believe that the rate of detection is small (implying that the level of counterfeits still circulating is large), then this could justify a large effect.
Second, there is a sizable difference in scale between the payments system and the level of counterfeiting seen in Australia. This means that only a small change in payments behaviour is required to generate significant social costs. For example, the value of credit card payments is around A$47 billion each quarter on average over the sample. While the implied cumulative response of credit card payments to the counterfeiting shock is only 1.8 per cent, this is a total increase of A$0.8 billion in level terms. This leads to an increase in social costs of A$7.0 million (around 0.8 per cent of the value of the increase in credit card payments).
Finally, the impulse response functions in Figure 3 are estimated with large uncertainty. For example, the A$0.8 billion increase in credit card payments is estimated with a confidence interval spanning –A$4.5 billion to A$6.2 billion. An estimate smaller in magnitude within this confidence interval would imply lower social costs and imply the effect of counterfeiting on social costs is smaller in scale.
Notwithstanding these measurement difficulties, the responses suggest that the pay-offs from activities used to prevent and deter counterfeiting are likely to be non-trivial. The level of counterfeiting could be higher in the absence of efforts in law enforcement, education and awareness, and the production of secure banknotes. Moreover, these estimates are novel in the sense that there are no other quantified estimates on the social costs of counterfeiting when associated with a loss of confidence in currency. This analysis helps fill this gap and provides one direction for future work using data in other countries.
Footnotes
The number of counterfeits detected in circulation reflects the interaction of the demand and supply of counterfeits among criminals, and the rate of detection by the public or authorities. In the context of this analysis, a shock to the number of counterfeits observed is likely to be related to developments that affect the demand and supply of counterfeits, including technological advancements that reduce the cost of counterfeiting, increase the quality of counterfeits and potentially reduce a criminal's chance of being caught while passing a counterfeit. It is less likely that the counterfeit shocks observed in the data are related to preventative measures since detection efforts and technologies have remained relatively unchanged and there have been no changes to Australia's banknote security features over the sample period. [9]
While data exists beyond this end date, it is still susceptible to revisions and is thus excluded from our sample. This is because there can be a delay between the time a counterfeit is detected in circulation and when it is entered into the data at the Counterfeit Examination Laboratory (CEL). One reason for this is that some counterfeits are involved in investigations before they are sent to the CEL. This means that, in any given quarter, revisions can be made to the data in previous quarters. [10]
There is a structural break in the bank deposit series in 2002:Q2 due to changes in bank reporting. We do not break-adjust the data in the results that follow as there is a risk of falsely removing natural variation in the data. However, we find that using a break-adjusted series in the model produces estimates with signs and magnitudes consistent with the impulse response functions we estimate in Figure 3 below. [11]
The ideal variable to capture the effect of counterfeiting on credit card payments would be debt not bearing interest; however, the data are not available for the whole sample period. We use total credit card debt, which is strongly positively correlated with debt not bearing interest. [12]
Possible cointegrating relationships could be implied by theories of money or transactions demand, for example. [13]
See Section 5 below for details. Both payments (flows) data and stocks data can be affected by demand, saving, and wealth shocks. In using either dataset, we assume that these shocks are uncorrelated with counterfeiting activity, which we think is plausible. [14]
The cash rate reasonably captures the variation in at-call deposit account rates. We find high correlation between the cash rate and several at-call deposit account rates, and that using these deposit account rates in the model does not significantly change the results. [15]
We use Cholesky decomposition with the ordering: banknotes in circulation, bank deposits, credit card debt, counterfeits detected. The ordering of variables before counterfeits detected does not change our results since we are only concerned with identifying counterfeiting shocks. [16]
We search for articles within the subject ‘Counterfeit/Forgery’ with free text bank note* or note* and search articles from all authors and all sources for all industries in the Australia region. [17]
We also test the relationship between media reports and counterfeiting activity using media reports detected and recorded by the Counterfeit Analysis team, internal to the Reserve Bank of Australia. We again find evidence that counterfeits detected Granger-causes media reports. [18]
Resource costs measure the resources required to facilitate payments and do not reflect rents sought to compensate for the provision of services. In this way, resource costs are ideal for constructing estimates of social costs. [19]
The 2008 and 2014 studies both estimate the resource costs of facilitating payments. However, the 2008 study estimates the costs to consumers in conducting payments, including costs such as tender times, while the 2014 study estimates only reflect the private costs to consumers, such as merchant surcharges and fees. The 2000 study only estimates the resource costs to financial institutions, which represent one component of social costs. [20]