RDP 2015-03: The Value of Payment Instruments: Estimating Willingness to Pay and Consumer Surplus 6. Estimating Consumer Surplus under Various Surcharging Scenarios
March 2015 – ISSN 1448-5109 (Online)
- Download the Paper 1.24MB
The second part of this paper explores how the willingness-to-pay data can be combined with a decision model of consumers to understand payment method choice. We first predict each respondents' willingness to pay using a variant of the model outlined above. We then outline a simple economic decision-making model of the consumer that predicts the mix of payments used in a range of surcharging scenarios. Each respondent's willingness to pay for debit cards and credit cards is a measure of the benefit they receive from using that instrument relative to cash. An individual behaving rationally will choose to use the payment method that offers the greatest net benefit, i.e. the highest benefit once the cost (the price or the surcharge) is taken into account.
For each scenario, we also estimate the ‘economic surplus’ for consumers, which is the benefit received by consumers from the payment method chosen less the price to use that payment method. Estimation of consumer surplus is a considerable benefit of using the willingness-to-pay data. Comparing the surplus across different surcharging scenarios, we demonstrate the potential gains from aligning prices with costs. The following results should not be interpreted as a definitive outcome of surcharging but rather as an illustrative exercise of how the estimated consumer benefit can be used in calibration, leaving future work to explore its use in more sophisticated models of the payments system.
Similar counterfactual exercises have been conducted in recent papers. Borzekowski and Kiser (2008) utilised counterfactuals to explore how consumers' choice of payment methods would be influenced by the removal/non-acceptance of certain payment methods by merchants. They found that the removal of debit cards increased use of paper methods, cash and cheques, more than credit cards and vice versa. Likewise, Ching and Hayashi (2010) focus on the effect of removing one of the payment options from the set; say due to merchants' decisions not to accept that method. Bolt et al (2010) consider how usage of debit cards may change under different surcharge levels. Given our dataset, it is feasible to consider the response to specific price (surcharge) levels on cash, debit cards and credit cards as well as the effect of non-acceptance of these methods. Our use of DCE is also unique in providing a measure of the change in consumer surplus.
6.1 Predicted Willingness to Pay
For each of the 938 respondents, we estimate the willingness to pay for credit cards (where applicable) and debit cards using a predictive model. The predictive model is an extended form of the model specified in the previous section that incorporates: more granular categories for employment status and education level; a wider range of demographic variables including personal income, the type of employment undertaken and the individual's main financial institution; and payment diary variables of the percentage of debit card and credit card use, value of spending on debit cards and credit cards, and number of surcharges paid (full list in Table E1). Extending the number of covariates in the model allows for greater variation and more precision in the predicted willingness to pay. However, the inclusion of potentially endogenous payment variables collected in the diary means that the coefficients cannot be interpreted as estimates of the causal effects of independent variables on willingness to pay (and the standard errors are also subject to bias). This is not a concern in this section of the paper as we are simply relying on the regression variables as correlates to provide an in-sample prediction of each respondent's willingness to pay; the current exercise should be distinguished from the investigation of causal relationships in Section 5.
6.2 Decision Framework
In our model, consumers make the decision of which payment method to use. Under the model, consumers will choose the payment method that gives them the greatest net benefit (or economic surplus), which is the difference between their willingness to pay for that method and the surcharge for using that method (i.e. the benefit they expect to receive in using that payment instrument at the cost directly attached to using that instrument). The net benefit to each individual i of using payment method j is given by:
where j is an element of the set J, which contains the available payment methods (cash, debit card and credit card), WTPi,j is individual i's estimated willingness to pay for payment method j from our model and Sj is the surcharge (price) on payment instrument j. Since our estimates of the benefit of debit cards and credit cards are relative to the use of cash, the benefit of paying with cash is normalised to zero.
A respondent will choose to use payment method j (the choice is denoted as Mi,j = 1) if the net benefit of using payment method j is greater than the net benefit of using any other payment method:
Respondents who do not hold a credit card have their choice set limited to cash and debit cards.
6.3 Calculation of Economic Surplus
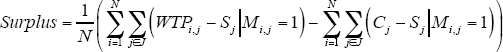
To evaluate the effect of the change in the mix of payment methods in response to the surcharging scenario, we calculate and compare the sum of the consumers' economic surplus under each scenario.[17] In our simple static model, each consumer makes one purchase of a $50 item in a store. We assume that there are a large number of identical merchants (i.e. no monopolistic pricing), which we call the representative merchant, all selling the same item worth $50. We assume that this representative merchant incurs costs in accepting payments and that each payment method has a different cost (Cj). Each sale has the same benefit (the benefit of the sale is normalised to zero) for the merchant regardless of what payment method is used.[18] It is assumed that merchants are competitive and must recover their costs; costs can be recouped through surcharges on more costly payment methods or increases in the general prices of the items that are charged to all consumers, or some combination of the two.
Consumers' economic surplus per transaction is the sum of each individual's net benefit of using the payment method they choose (the first term below) less the merchant costs that are built into an increase in the base price of the item, to the extent these merchant costs are not recovered through surcharging (the second term):
The number of transactions is equal to the number of respondents (N). When merchants surcharge at their cost of acceptance (Cj = Sj), the second term is nil.[19]
Under this model, Sj affects consumers' combined surplus by changing the mix of payments in the economy. The surplus associated with each payment method is not itself changed by altering Sj. To aid in interpretation, we focus on the change in the total surplus from a baseline scenario to an alternative scenario in terms of the basis points per $50 transaction.
6.4 Scenario Analysis
A number of scenarios are considered to examine how the imposition of surcharges may affect the mix of payment methods and the economic surplus of consumers. The baseline scenario is one where merchants accept cash, debit card and credit cards but there is no surcharging of any payment method. We compare the baseline outcomes to several alternative scenarios. In the first, the representative merchant applies a surcharge to the two higher-cost payment methods of three (cash, debit cards and credit cards), with the surcharges set to equal the incremental (to the lowest-cost method) costs of acceptance. In a second scenario, the representative merchant surcharges at the cost of acceptance of each payment method rounded to the nearest percentage point. We also compare these scenarios to others where the merchant surcharges at an arbitrary level or refuses to accept one of the payment methods.
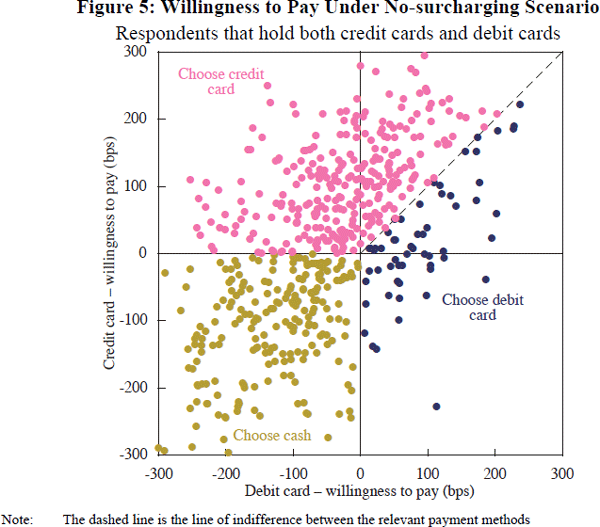
Starting with the baseline scenario, where the surcharges on cash, debit cards and credit cards are all set to zero, respondents simply choose the payment method that provides them with the highest willingness to pay.[20] Figure 5 depicts the decision framework for credit card holders under the baseline scenario. Respondents who are predicted to receive no benefit from the use of debit cards and credit cards (bottom left quadrant) will choose to use cash. Those in the top left and bottom right quadrant only obtain a positive benefit from one type of card and thus will choose to use that card. For respondents that obtain benefit from both debit and credit cards, the card that provides the higher benefit will be chosen. For non-credit card holders (not shown), the choice is between whether to pay using a debit card or using cash; those who have a positive predicted willingness to pay with a debit card (around 33 per cent) are assumed to choose their debit card and the remainder are assumed to choose cash.
Under the baseline scenario, 51 per cent of respondents choose cash, 18 per cent choose debit card and 31 per cent choose credit card. These proportions can be compared to the mix of payments used for point-of-sale purchases of $50 recorded in the Survey (Table 6).[21] The comparison suggests that under the baseline scenario our model predicts the share of cash used well, although it underestimates the use of debit cards and overestimates the use of credit cards.[22] The lower share of credit card payments reported in the Survey relative to the outcome of the model is consistent with some use of surcharging in 2013, which would be expected to affect the relative shares of debit cards and credit cards to a degree. In contrast, our baseline assumes that no payment methods are surcharged.
| Consumer Use Survey data(a) | No-surcharging scenario | Surcharging-at-cost scenario |
||
|---|---|---|---|---|
| Per cent of payments | Per cent of payments | Surcharge price(b) Basis points | Per cent of payments | |
| Cash | 51 | 51 | 10 | 61 |
| Debit card | 29 | 18 | 0 | 29 |
| Credit card | 20 | 31 | 118 | 10 |
| Change in surplus from no surcharging | baseline | 13 bps | ||
|
Notes: (a) Reserve Bank of Australia's 2013 Survey of Consumers'
Use of Payment Methods; $50 point-of-sale transactions Sources: Authors' calculations based on survey data; RBA |
||||
Due to the assumption of a normal distribution for the willingness to pay, the model predicts a large group of individuals with negative willingness to pay for the use of cards. We do not truncate the estimated willingness to pay at zero for the scenario analysis. Truncation at near zero would not change the mix of payment methods chosen (i.e. the ranking of payment instruments for each individual is preserved with or without truncation).[23] Similarly, the estimate of consumer surplus is unaffected by the large negative willingness to pay as those negative benefits are not realised by the respondents (e.g. a respondent in the top left quadrant will choose between cash and credit cards; any change in behaviour and associated increase in surplus would not be influenced by the highly negative willingness to pay predicted for debit cards).
To conduct the first surcharging scenario, we assume the representative merchant sets the surcharges at its cost of accepting each payment method. We approximate these costs from a 2014 study on the costs of payments in Australia by Stewart et al (2014). The costs to the representative merchant in our scenario for a $50 payment is 108 basis points for a cash payment, 98 basis points for a debit card payment and 216 basis points for a credit card payment.[24]
The decision framework is only affected by the relative (rather than absolute) price of each payment method. Therefore, we normalise the surcharge of the least costly method (debit cards) to zero and the surcharge on cash and credit cards is equal to the difference in the cost of that method to debit cards. Under the surcharging scenario, the representative merchant applies a 10 basis point surcharge on cash, no surcharge on debit cards and a 118 basis point surcharge on credit cards.[25]
The change in relative prices compared to the no-surcharging scenario causes a shift in the mix of payments; consumers who may previously have received the greatest benefit from one payment method, may now receive the greatest benefit from using a different payment method. Figure 6 shows how the use of the three instruments by credit card holders is distributed under the surcharging scenario.
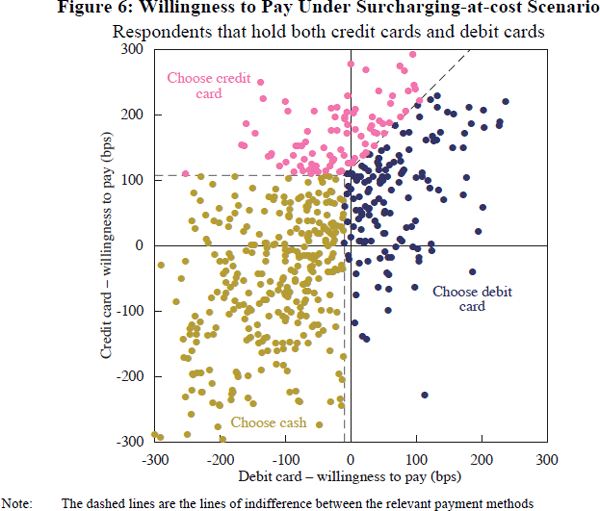
For the full sample (i.e. including those that do not hold credit cards), the results of the change in relative prices are that 12 per cent of individuals shift from using credit cards to using cash, 10 per cent of individuals switch to using debit cards instead of credit cards and around 1 per cent of individuals shift from cash to debit cards. Table 6 summarises the net effect on the shares of each payment method; the use of cash and debit cards increases to 61 per cent and 29 per cent respectively, and the use of credit cards decreases significantly to 10 per cent. The mix of payment methods has changed, but all payment methods are still being used.
The predicted shift toward cash from credit cards is very strong in the model. This result may be affected by the framing of the scenario around a $50 payment, for which the use of cash is higher than payments in the surrounding price range. If the payment function of cards has been slightly undervalued, the scenario may over-predict the shift toward cash relative to debit cards. However, the result is consistent with the findings of Borzekowski and Kiser (2008) in a similar counterfactual exercise for the United States.
The increase in the joint surplus of consumers and merchants amounts to 13 basis points per transaction under the surcharging scenario (Table 6). This increase in surplus is driven by the change in the mix of payments as individuals switch away from the payment methods for which their net benefit was small but which incurred relatively high costs for the merchant that had to be built into a higher base price.[26] As consumers switch to using payment methods with a lower net cost, the total price paid by consumers falls. The application of surcharging introduces market discipline into the consumer's choice of payment method and improves the overall economic outcome.
The finding that the mix of payments is more economically efficient and that consumer surplus is higher in the presence of surcharging holds for all instances where the merchant surcharges at the costs of acceptance. The magnitude of the increase in joint surplus, however, is sensitive to the relative costs of each payment method, increasing when the difference in costs is large and diminishing as the difference in payment costs gets smaller.
In contrast, where merchants do not surcharge at the cost of acceptance, surplus may not necessarily increase. Whether an efficiency gain is realised will depend on how closely the surcharges approximate the cost of acceptance. If the deviation is small, say due to rounding of surcharges, the system is still likely to experience an increase in efficiency; for example, in a scenario involving no surcharge on cash or debit cards and a 100 basis point surcharge applied to credit cards, the economic surplus nevertheless increases by 12 basis points (Table 7). That is, nearly all the potential efficiency gains from surcharging exactly at cost are obtained in this scenario.
| Only credit cards surcharged | Arbitrary card surcharging | ||||
|---|---|---|---|---|---|
| Surcharge price Basis points | Per cent of payments | Surcharge price Basis points | Per cent of payments | ||
| Cash | 0 | 62 | 0 | 92 | |
| Debit card | 0 | 26 | 100 | 8 | |
| Credit card | 100 | 12 | 300 | 0 | |
| Change in surplus from no surcharging | 12 bps | −4 bps | |||
However, in situations where the merchant arbitrarily surcharges with no regard to the respective costs of the payment methods, outcomes are uncertain. Our third scenario presents an example where merchants surcharge debit cards at 100 basis points and credit cards at 300 basis points. Under this scenario, the use of cards falls significantly and surplus falls by 4 basis points in comparison to no surcharging.
We also consider a fourth scenario where merchants do not surcharge, but instead choose to not accept certain payment methods. A key result is that under most non-acceptance scenarios, the joint surplus is lower than under the surcharging scenario (Table 8). This result is particularly strong for the scenarios where either cash or debit cards are not accepted. This is due to the fact that these methods are fairly inexpensive and, if not available, the share of payments made using relatively expensive credit cards increases for no gain in consumer surplus. However, in some circumstances that non-acceptance may increase consumer welfare; given that credit cards are relatively more expensive than cash or debit cards, dropping credit cards is found to lead to an increase in consumer surplus relative to a baseline of no surcharging. Consumer surplus is of course lower than in the surcharging-at-cost scenario because 10 per cent of respondents would prefer to pay by credit card (and pay a surcharge) but cannot because credit cards are not accepted. Overall, the result of this analysis illustrates that more efficient outcomes occur when the merchant chooses to surcharge consumers at the cost of acceptance, although gains may still be realised by non-acceptance of particularly expensive options.
| Per cent of payments | ||||||
|---|---|---|---|---|---|---|
| No surcharging | Surcharging at cost(a) | No credit cards | No debit cards | No cards | No cash | |
| Cash | 51 | 61 | 69 | 65 | 100 | 0 |
| Debit card | 18 | 29 | 31 | 0 | 0 | 52 |
| Credit card | 31 | 10 | 0 | 35 | 0 | 48 |
| Change in surplus from surcharging at cost | baseline | −5 bps | −30 bps | −31 bps | −94 bps | |
| Change in surplus from no surcharging | baseline | 7 bps | −18 bps | −19 bps | −81 bps | |
| Note: (a) Involves surcharges of 10 basis points on cash and 118 basis points on credit cards as per Table 6 | ||||||
Footnotes
We assume that the merchant, card issuing and card acquiring markets are all competitive. [17]
In a dynamic analysis, the increase in the price of the items may affect total sales volumes. However, in our model, demand for items is static. Likewise, some argue that acceptance of credit cards increases sales by reducing liquidity constraints of consumers, thus benefiting merchants. Our model does not include such effects. [18]
We note that this implies that the price of the item will in many scenarios be greater than $50. We recognise that the DCE results are most applicable to items priced at $50 exactly and that increasing the price of the item above $50 to a non-whole value number may imply a greater value on card payments than is used in the scenarios. [19]
As the DCE did not include a scenario asking about willingness to pay with a card when there was no surcharge, the outcome of this scenario is dependent on our assumption of the normality of the underlying distribution of willingness to pay. However, because the minimum surcharge value considered in the DCE of 0.1 per cent was very close to zero we believe it is reasonable to consider the no-surcharge scenario as the baseline. [20]
We can infer the mix of payments without the predictive model, but by simply using the DCE response data on which willingness-to-pay range a respondent falls in. We find the mix predicted by the ranges are consistent with the mix predicted by the predictive model and those recorded in the Survey (see Table E2). However, simply using the willingness-to-pay ranges does not allow the calculation of consumer surplus or provide sufficient precision in predicting the mix of payment under surcharging. [21]
A comparison of how closely the model correctly predicts the in-sample data is provided in Table E3. Similar to the comparison to the Survey data in Table E2, we under-predict the willingness to pay for debit cards, whilst the credit card predictions display some dispersion. [22]
Truncation at zero would likewise not change the results if it is also assumed that cash is preferred to debit cards and credit cards, when the net benefits of each relevant payment instrument is equal. [23]
The costs for merchants are approximated by the resource costs of payments, which Stewart et al (2014) show are predominantly borne by merchants. These figures include the resource costs of financial institutions, which are passed onto merchants in the form of merchant service fees, and the merchants' own resource costs. It is worth noting that cost study uses data on a selected number of large retailers and that the range of costs for different merchants can be wide; for example, costs for smaller merchants are higher given the lack of economies of scale and higher fees. The level of cost may therefore not be applicable for all merchants. Further, the resource costs incurred vary by payment size; cash is cheaper than debit cards at payment values below $20, although credit cards are always the most expensive payment method. [24]
A surcharge on cash is technically outside the scope of the DCE data. However, a very similar result is obtained when there is no surcharge on cash. [25]
The increase in surplus is primarily driven by the group of individuals who changed their choice of payment method from credit cards to cash, and another group who switched from credit cards to debit cards. As discussed above, the change in surplus for individuals who changed their choice from credit cards to cash are not affected by their predicted negative willingness to pay, but rather their relative willingness to pay for credit cards. [26]