RDP 2014-03: Household Saving in Australia 1. Introduction
April 2014 – ISSN 1320-7229 (Print), ISSN 1448-5109 (Online)
- Download the Paper 1.14MB
Between the early 1970s and the early 2000s the aggregate household saving ratio in Australia steadily declined, from around 20 per cent to around zero (Figure 1). This trend was driven by a number of factors, including an increased availability of credit, falling real interest rates, more stable economic outcomes, rising asset prices, rising household income and income expectations, and high household confidence. The importance of various factors waxed and waned over the three decades, but it is likely that all contributed to some extent to a higher rate of growth in consumption compared with income, and so the fall in the saving ratio seen over this period.
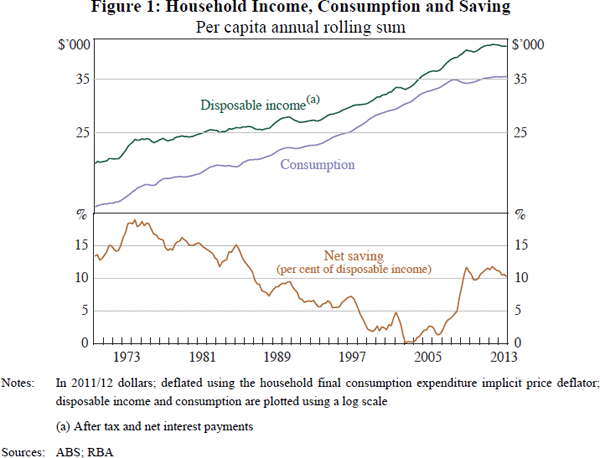
However, in the latter half of the 2000s, the household saving ratio reversed this decline, and is now at a level similar to that of the mid 1980s. This is an important change in household behaviour, particularly given the fact that household consumption accounts for a little over half of GDP.
The extent to which the higher saving ratio is sustained will depend on what caused the change in saving behaviour. For example, if saving rose due to an unexpected boost to income that households believed to be temporary, standard theory would suggest that saving will fall again as the boost to income dissipates. Conversely, earlier large increases in housing prices and the expectation for further large increases to come, as well as the associated run-up in housing debt, may have encouraged and enabled households to reduce their saving over the 1990s and early 2000s.[1] In this case, a reassessment by households of the likely future path of housing prices, and an associated levelling off in the aggregate stock of housing debt, may have led to a more enduring increase in saving.
In this paper we investigate the drivers of the rise in the household saving ratio over the past decade or so. By examining aggregate data on household income and consumption, we can observe that saving rose around the mid to late 2000s, reflecting both an increase in income growth and a fall in consumption growth (Figure 1; see also Stevens (2011)). Even if one assumes that the rise in income was due to factors outside the household sector's control, it is difficult to draw conclusions from the aggregate data about what drove the changes in consumption behaviour, or how households responded to their higher income levels. Instead we turn to household-level data and examine the link between various household characteristics and saving behaviour. To do this, we use the Household Expenditure Survey (HES) from the Australian Bureau of Statistics (ABS) detailing household income and expenditure in 2003/04 and 2009/10.
The period we consider saw times of rapidly rising asset prices and strong economic growth, as well as times of rising unemployment and financial crisis, with the population slowly ageing throughout. By considering how the saving behaviour of different households changed, we aim to understand the relative importance of life-cycle factors, credit constraints, precautionary motives and household wealth on saving behaviour.
It is important to note, however, that we cannot directly test the effect of, for example, precautionary motives on saving behaviour, since there is no variable that measures how much risk a household perceives itself to face. Rather, we examine how saving relates to various household characteristics that are correlated with, for example, risk around future income, such as skill level or reliance on investment returns for a large share of income. To the extent that saving varies with household characteristics deemed to indicate a higher degree of income risk, we draw the inference that it is this underlying risk factor that is driving saving behaviour, but this is open to debate.
While we believe ours to be the first study that focuses on the recent rise in household saving in Australia using the Household Expenditure Survey data, other papers have analysed household saving behaviour using micro data. For Australia, Harris, Loundes and Webster (2002) use household-level data from Melbourne Institute surveys to consider the household characteristics that lead a household to identify with a type of saving behaviour that ranges from ‘running into debt’ to ‘saving a lot’. The authors find that households with higher income and wealth, households that own their own home and households with a more positive economic outlook tend to identify themselves as active savers. Their findings suggest several saving hypotheses help to explain variation in household saving behaviour, highlighting the need to consider multiple hypotheses for the rise in saving.
More recently, Berger-Thomson, Chung and McKibbin (2009) use the Household, Income and Labour Dynamics in Australia (HILDA) Survey to examine how uncertainty affects households' consumption decisions. The authors find that households that are worried about their future employment status have lower marginal propensities to consume out of current income compared with households that are not concerned about their future employment status, and so save more.
Using the Household Expenditure Survey, Islam, Parasnis and Fausten (2013) examine the saving behaviour of migrants in Australia. They find that migrant households tend to save more than otherwise-similar native-born households, but that they also tend to have lower incomes, and that the latter result dominates, resulting in less saving overall.
Chamon and Prasad (2010) examine household saving behaviour in China using household-level data between 1995 and 2005. Similar to our study, their primary aim is to uncover the reasons behind the rise in the Chinese household saving ratio over this period. The authors find that precautionary saving motives are an important determinant of this rise, with younger and older households increasing saving due to rising uncertainty and increasing housing, education and healthcare costs in China.
Attanasio and Weber (1994) examine two popular hypotheses for the sharp fall that occurred between 1986 and 1988 in the United Kingdom's household saving ratio: that it was due to a substantial rise in house prices; and that it was due to a rise in perceived permanent income. While wealth effects may have boosted consumption growth in the 1980s, the authors conclude that the sharp fall in saving is best explained by younger households upwardly revising their expectations of permanent income.
Dynan, Skinner and Zeldes (2004) examine whether households with higher permanent income in the United States save a larger fraction of their income than lower-income households. They find evidence of a strong relationship between a household's permanent income and their saving ratio, suggesting that the permanent income hypothesis (that households spend in line with their permanent level of income) does not hold.
Using micro data from the United States and the United Kingdom, Attanasio (1999) finds that consumption varies over the life cycle, which appears to contradict the life-cycle hypothesis. However, after controlling for demographic factors, he shows that variation in consumption over the life cycle is largely the result of changes in family size and composition. Similarly, Browning and Crossley (2001) argue against modelling consumption behaviour based on simple ‘rules of thumb’, but emphasise that the life-cycle framework remains relevant to the consumption literature. The authors suggest that while simple life-cycle models may not explain the data, more complex life-cycle models can; for example, precautionary motives and changing demographic factors can exist within a life-cycle framework (see also Attanasio and Weber (2010)).
The remainder of this paper is organised as follows. In Section 2 we describe the household-level datasets we use, and examine how they compare with aggregate data available in the Australian national accounts. Section 3 presents the cross-sectional results from a model of the median household's saving behaviour that is similar to those employed in Dynan et al (2004), Chamon and Prasad (2010) and Islam et al (2013), while Section 4 presents the time series results from the median regression model as well as a decomposition of the change in the mean saving ratio into parameter and characteristic effects. Modelling median saving allows us to assess determinants of the saving behaviour of a ‘typical’ household, while modelling mean saving allows us to quantify the size of various influences on the aggregate saving ratio. Section 5 concludes.
Footnote
See, for example, Dynan and Kohn (2007) for a discussion of the link between house prices, borrowing and saving in the United States, or Iacoviello (2004) for a general equilibrium model of house prices, debt and consumption. [1]