RDP 2014-01: Macroeconomic Consequences of Terms of Trade Episodes, Past and Present 3. Macroeconomic Consequences
January 2014 – ISSN 1320-7229 (Print), ISSN 1448-5109 (Online)
- Download the Paper 630KB
Terms of trade upswings have tended to be expansionary for the Australian economy. On average, each previous boom has coincided with per capita GDP growth that is stronger than the average over the previous decade (Figure 5).[4] On the flipside, as the terms of trade fall, GDP per capita growth tends to be lower than the decadal average for two years, but returns to the average rate after five years. Consistent with stronger economic growth, the unemployment rate has tended to decline during terms of trade upswings and increase, sometimes quite sharply, during downswings in the terms of trade.
There is variation in the magnitude of output and income growth across episodes, reflecting differences in the amplitude and duration of terms of trade movements and disparate policy settings. Focusing initially on expansionary phases of terms of trade cycles, per capita output growth was particularly strong in the two years prior to the peak in the terms of trade in the early 20th century, as exports recovered after the Federation drought. However, the slow and prolonged recovery after the recession of the 1890s and the Federation drought were major headwinds to growth in the economy in the five years prior to the peak. In the early 1920s and 1950s, strong per capita output growth partly reflected pent-up demand following war and coincided with strong growth in investment.
In contrast, during the 1970s and the current episode per capita growth was below trend prior to the peak in the terms of trade. These two later episodes were affected by a disruptive negative international shock (the oil price shock and the global financial crisis). A substantial real exchange rate appreciation has occurred with nearly all upswings in the terms of trade, which is discussed further in Section 4.1.
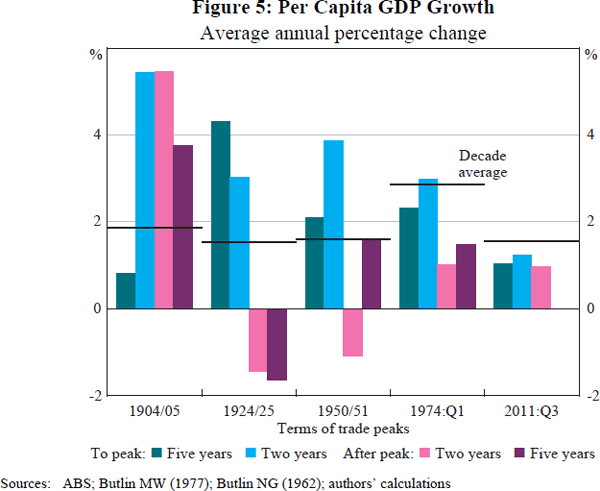
During downswings, the fall in the purchasing power of exports has been the largest drag on national incomes in the two years after the peak in the terms of trade.[5] On average, income per capita has taken five years to return to the level observed at the peak.
Of course, some downswings have been associated with more severe macroeconomic outcomes than others. The 1920s boom was followed by a protracted weakening in domestic economic activity. The fall in the terms of trade and output initially reflected a weakening in economic activity in the United Kingdom and cessation of capital inflows. While the contraction in output in the immediate years following the peak in the terms of trade, and even in the subsequent depression in the 1930s, was less severe than the earlier depression in the 1890s, the unemployment rate still reached close to 20 per cent by the early 1930s.[6]
The expansionary episode of the early 1970s was also followed by a downturn in global economic conditions, triggered by the global oil price shock, along with deteriorating local domestic conditions. The combination of a tightening in monetary policy in the mid 1970s, rigidities in the labour market and an overvalued nominal exchange rate contributed to per capita output growth in Australia being below average for half a decade after the peak (Pagan 1987).
The sharp slowing in real growth following the Korean War peak was short-lived. In part, this reflected strong global growth, while active fiscal and monetary policy responses to the transitory boom in wool prices also insulated the economy from the shock (Schedvin 1992; Henry 2007).
The downswing in the terms of trade in the early 20th century was an exception. GDP per capita growth remained well above its decadal average after the peak in the terms of trade. In part, this reflects the low level of average growth around that time because of the slow recovery following the severe recession of the 1890s, which involved a period of prolonged deleveraging following the collapse of the financial system. Australia's sheep flock also took considerable time to rebuild after the Federation drought; the export boom in wool only got underway in the early 20th century.[7] The fall in the terms of trade was also relatively mild, with prices remaining at high levels, as there was no major global downturn.
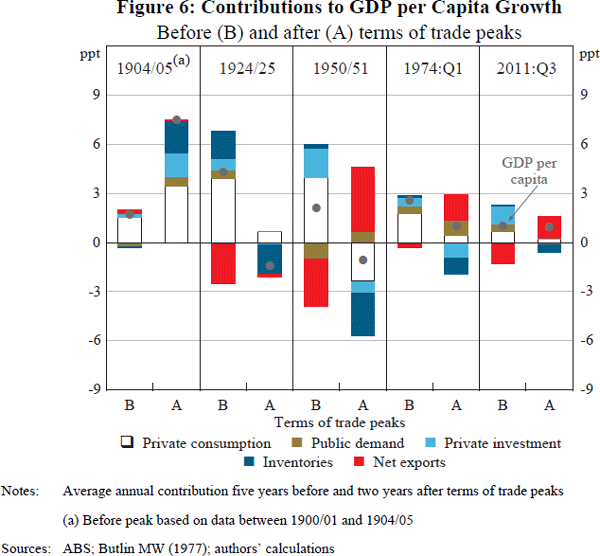
While the consequences of terms of trade cycles for the major expenditure components of GDP will be discussed in more detail in the following subsections, the key points are:
- Investment contributed strongly to GDP per capita growth before peaks in the terms of trade, with the exception of the early 1900s (Figure 6). Increased investment reflects the business sector seeking to increase supply in response to higher commodity prices. Dwelling investment also generally contributes to growth during these periods, with the exception of the early 1900s and the most recent cycle.
- Net exports weighed on growth leading up to the peaks in the terms of trade, although there were considerable differences across episodes. Export volume growth took time to respond to higher prices in many cases and the accompanying real exchange rate appreciation weighed on the rest of the tradeables sector (see Section 4.1). Following peaks in the terms of trade, net exports contributed to GDP growth, notably in the 1950s and 1970s episodes, and the real exchange rate depreciated.
3.1 Investment
Major upswings in the terms of trade have reflected increases in commodity prices accompanying strong global growth, resulting in higher marginal returns to investment in the resources and rural sectors. As such, terms of trade booms are generally accompanied by strong investment growth in these and other parts of the economy (Figure 7). Dwelling and business investment grew quickly during most upswings and made substantial contributions to output per capita growth. Increased investment in public infrastructure also typically contributed to growth during terms of trade upswings. Very high investment has also been a key characteristic of the current episode. Much of this has been driven by investment in the resources sector, which has reached a historically high 8 per cent of GDP.[8]
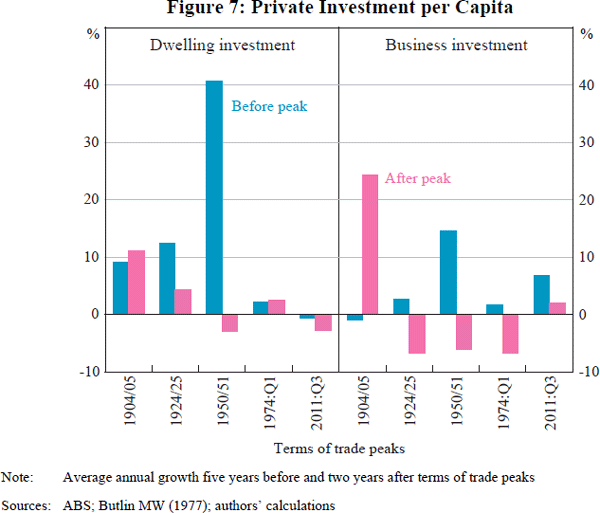
Differences in the characteristics of resources, rural and other forms of investment have important consequences for the size and duration of the investment response. In particular, some forms of investment can take long periods before becoming productive. The planning and approval processes associated with resources investment are more extensive than many other forms of investment. These time-to-build characteristics of resources investment lead to a long supply lag that keeps commodity prices higher than they otherwise would be.
A large movement in the terms of trade, and a concomitant change in the real exchange rate, can also affect investment at a sectoral level, as it discourages investment in the other tradeable sectors. However, to the extent that the real appreciation is in part owing to a nominal exchange rate appreciation, it also makes imported capital goods cheaper.
Private dwelling investment did not contribute sizably to output per capita growth in the current cycle as the terms of trade rose. Indeed, the cyclicality of dwelling investment evident historically has been largely absent since the early 2000s; it is an open question why this has occurred. One possibility is that supply-side issues in the housing market have meant that increased household incomes have flown more so into higher house prices. Also, income gains coming via the corporate sector in the current episode probably have been muted by foreign ownership of the mining sector (see Connolly and Orsmond (2011)).
Growth in overall investment has tended to moderate as the terms of trade decline. However, a notable exception was the early 20th century episode, when the rate of growth of investment was higher than in the upswing phase. This situation reflected the fact that private investment picked up following the period of weakness and deleveraging associated with the 1890s depression and the end of the Federation drought.
3.2 Trade
Export volumes have generally experienced weak growth in the period preceding a terms of trade peak (Figure 8). In part, this reflects the accompanying rise in the real exchange rate and the sluggishness with which commodity production can respond to higher prices. For example, during the Korean War boom there was only modest growth in total export volumes (though this was in part due to a reduction in the size of the sheep flock following the effect of drought). On the other hand, imports experienced relatively strong growth prior to the peaks in the terms of trade, reflecting the real exchange rate appreciation and pick-up in domestic final demand.[9] For the domestic economy, the increase in import volumes constitute a leakage of income gains from the terms of trade. Consequently, the net exports contribution to GDP growth in the lead up to peaks in the terms of trade has typically been slight (Figure 6).[10]
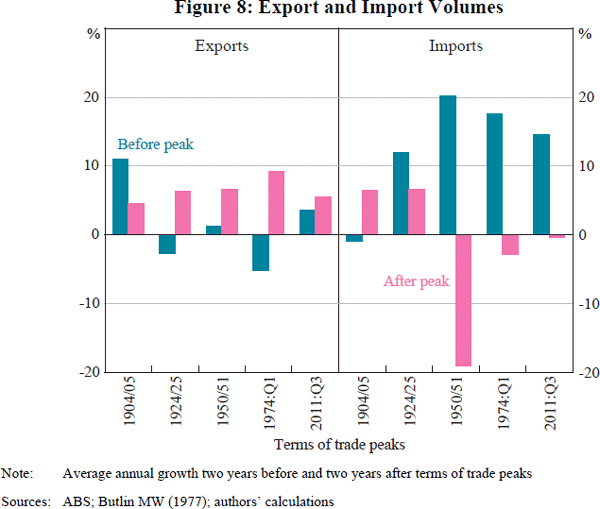
In the most recent episode, growth in resource export volumes was also subdued following the initial pick-up in commodity prices. This is likely to have reflected uncertainty about the longevity of the higher prices together with the time it takes for resources investment to become productive. As a result, average growth in total export volumes in the first decade of the 21st century was the lowest since World War II, although this reflected weak performance in a number of resource exports, as well as across rural commodities, manufactures and services (Plumb et al 2013). The sizeable real exchange rate appreciation that accompanied the increase in the terms of trade also restrained export growth outside of the resources sector; downturns in trading partner growth in the early 2000s and the global financial crisis were also factors.
Following peaks in the terms of trade, exports growth typically increased in the short term as supply came on line and the real exchange rate declined. A slowdown in imports growth has also typically followed peaks in the terms of trade.[11]
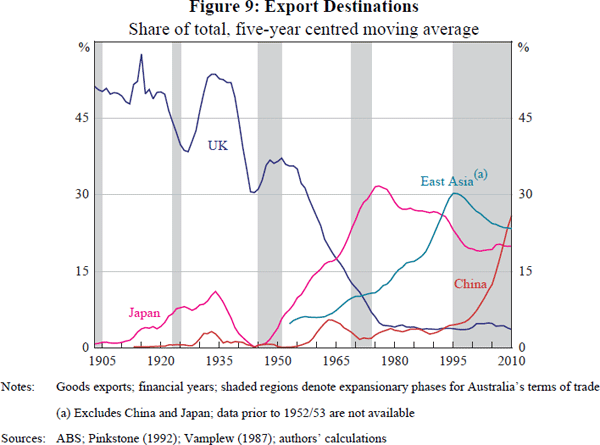
The concentration of Australian exports in the current episode has parallels with previous episodes. Since 2011, half of Australia's goods shipments have been destined for China and east Asia excluding Japan. In the three earliest episodes, the share of Australian goods exports directed to the United Kingdom was usually at least above 40 per cent (Figure 9). Furthermore, Australia's share of goods exports to Japan rose to close to 30 per cent in the 1970s episode, coinciding with its industrialisation. This accompanied a change in the composition of exports towards metal ores and coal, reflecting increased demand from Japan's steel industry, and the lifting of export bans.[12]
3.3 Consumption
A change in the terms of trade may influence per capita consumption in several ways. First, it may alter the composition of the consumption bundle by changing the relative price of imports to domestically produced goods. This could occur as a result of a change in the nominal exchange rate. Increases in low-cost manufacturing in the 1920s and the current episode have also suppressed world, and hence Australian import, prices. Second, a change in the terms of trade also affects income, although the extent to which this influences consumption depends on whether the movements are perceived as permanent or temporary.
The behaviour of consumption per capita growth differs considerably across episodes (Figure 10). Growth was particularly strong during the Roaring Twenties, coinciding with lower unemployment and higher asset prices and wealth. In the lead up to the peak in the terms of trade in the 1950s, consumption growth was weak relative to its high decadal average. The effects of a ‘wartime economy’, such as production shortages and rationing controls, difficulties obtaining imported capital and an acceleration in net overseas migration in the late 1940s, weighed on per capita consumption growth in this episode (Waterman 1972).
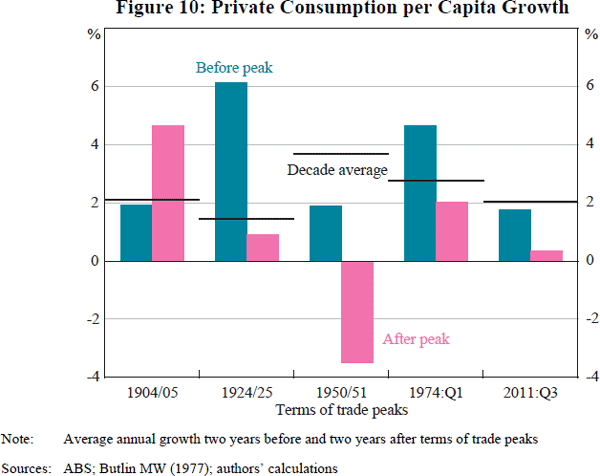
Growth of consumption per capita in the current episode was close to its decadal average before the peak in the terms of trade. Several factors might explain this relatively subdued outcome despite the magnitude of the increase in the terms of trade. First, the global financial crisis and sizeable declines in asset prices probably led to a re-evaluation of risks and encouraged a rebuilding of balance sheets (see, for example, Stevens (2011)). Similarly, growth in the early 20th century was also weighed down by the severe depression of the 1890s and the subsequent reduction in household debt. Second, households may have expected a short-lived boom; Plumb et al (2013) illustrate that the magnitude and duration of the recent expansion of the terms of trade was not anticipated by the RBA, and consequently it is likely to have also surprised many households. Indeed, Figure 1 suggests that the terms of trade historically probably were best characterised as being mean reverting.[13] A high degree of foreign ownership of the resources sector may have been another factor.
A further possibility is that some households might have been credit constrained, and thus unable to bring forward their consumption in anticipation of higher future incomes, although the financial deregulation of the 1980s has removed these constraints relative to the past.
Footnotes
Measured output growth prior to World War II is considerably more volatile than afterwards, which may partially reflect measurement issues. [4]
Growth in national incomes includes changes in output as well as changes in the purchasing power of exports and net primary income receivable from non-residents. For more information, see Sheehan and Gregory (2013). [5]
Between 1891 and 1895, real GDP declined by almost 20 per cent. The 1890s depression was exacerbated by several idiosyncratic factors, including a banking crisis associated with the collapse of a property price bubble in Melbourne (see Simon (2003) and Kent (2011)). Maddock and McLean (1987) also suggest that structural imbalances in the local economy and high external indebtedness exacerbated the downturn in the 1890s. [6]
Public investment also made a noticeable contribution to growth (Maddock and McLean 1987). [7]
The accumulation of livestock for wool (but not food), is treated in the national accounts as investment. The relationship between the terms of trade and the livestock investment series is not strong, probably reflecting measurement issues and supply disturbances (such as drought). [8]
An additional factor following the world wars is the resumption of international trade. [9]
One exception is the early 20th century episode. Export volumes increased significantly prior to the peak, as supply recovered following the Federation drought. During this period there was also an expansion into mineral exports, particularly gold. The fixed price of gold made exploration and mining an attractive investment following recessions in the United Kingdom and the United States (Pinkstone 1992). Australia also responded to demand for base metals and ores from newly industrialising markets in Europe up until World War I (Pinkstone 1992; Meredith and Dyster 1999). [10]
Quantitative import restrictions were implemented following the Korean War wool boom – see Waterman (1972). [11]
The Western Australian government also began to issue concessions for iron ore mining in the 1960s (McLean 2013). [12]
Unit root tests on data over the entire sample suggest the Australian terms of trade are stationary, whereas data from 1955 onwards appear to be non-stationary. [13]