RDP 2013-05: Liquidity Shocks and the US Housing Credit Crisis of 2007–2008 5. Testing the Liquidity Constraints Hypothesis
May 2013 – ISSN 1320-7229 (Print), ISSN 1448-5109 (Online)
- Download the Paper 756KB
5.1 Identification
I estimate a difference-in-differences panel regression model to examine the causal effect of bank liquidity shocks on mortgage lending. The set-up of the model is based on an experimental design in which there are two groups of lenders – a ‘treatment group’ (the OTD lenders) and a ‘control group’ (the non-OTD lenders) – as well as a ‘treatment’ (the closure of the securitisation market in 2007). I first write the regression model in terms of levels:
where the dependent variable is the (log) number of new loans of lender i to tract j in period t (Lijt). The explanatory variables include the share of loans that were sold by lender i in the pre-crisis period (SALESHAREi), a dummy variable for whether the period is pre- or post-crisis (CRISISt) and an interaction variable (SALESHAREi *CRISISt). I also include a set of control variables (Xijt) that vary by lender, tract and time, such as the average income of loan applicants and the share of loan applicants that are from a minority group, as well as controls that vary by lender and time only, such as lender size. The composite error term (νijt) consists of a tract-specific effect (θj), a tract-specific time trend (ηjt) and an idiosyncratic term (εijt). The tract-specific effect captures unobservable factors in each tract that do not vary with time (e.g. geographic factors) while the tract-specific time trend captures unobservable factors in each tract that do vary with time (e.g. local housing prices or employment prospects).
I collapse the time series information into two periods – the pre-shock (‘before’) and post-shock (‘after’) periods – by taking the average of all observations before and after the crisis. The pre-shock period covers the years 2000 to 2006 while the post-shock period covers the years 2007 to 2008. Difference-in-differences estimation that uses many periods of data and focuses on serially-correlated outcomes can produce inconsistent standard errors (Bertrand, Duflo and Mullainathan 2004). Collapsing the data in this way smoothes out variation and generates conservative standard errors.
To aid computation, I take the first difference over time between the pre- and post-crisis periods to obtain the equation in growth rates:
where the dependent variable is the percentage change in the number of new mortgage
loans by lender i to tract j between the pre- and post-crisis periods (ΔLij).
The key explanatory variable is the share of loans sold by lender i
on average in the pre-crisis period (SALESHAREi). This
variable is the proxy for the liquidity shock. The main coefficient of interest
is the difference-in-differences estimator ( ) which measures the
causal effect of the liquidity shock on mortgage lending during the crisis.
The test of the liquidity constraints hypothesis is a test of whether mortgage
lenders that were reliant on securitisation pre-crisis, and hence more exposed
to the negative liquidity shock, reduced lending by more than mortgage lenders
that were not reliant on securitisation (i.e. ρ < 0). The equation
is reduced form in nature but can be derived as an equilibrium condition by
explicitly modelling the credit supply and demand schedules (see Appendix A
for the derivation).
) which measures the
causal effect of the liquidity shock on mortgage lending during the crisis.
The test of the liquidity constraints hypothesis is a test of whether mortgage
lenders that were reliant on securitisation pre-crisis, and hence more exposed
to the negative liquidity shock, reduced lending by more than mortgage lenders
that were not reliant on securitisation (i.e. ρ < 0). The equation
is reduced form in nature but can be derived as an equilibrium condition by
explicitly modelling the credit supply and demand schedules (see Appendix A
for the derivation).
The OLS estimator of ρ will be biased if unobservable credit demand shocks are correlated with a lender's reliance on loan sales (i.e. corr(SALESHAREi,Δηj) ≠ 0). It is difficult to determine the direction of this bias. On the one hand, a lender's reliance on loan sales and the credit demand shocks could be positively correlated, which will lead to a positive OLS bias and the effect of the liquidity shock will be underestimated. For example, only lenders that experience particularly rapid growth in loan demand may turn to securitisation if it is relatively more expensive to fund a loan through securitisation than through retail deposits (e.g. due to deposit insurance). On the other hand, a lender's reliance on loan sales and the credit demand shocks could be negatively correlated, which will cause a negative OLS bias and the effect of the liquidity shock will be overestimated. For instance, OTD lenders might be more likely to lend to risky borrowers that became particularly discouraged from borrowing when economic conditions deteriorated. More generally, variation in borrower composition across OTD and non-OTD banks that directly affects credit demand biases the estimated coefficient on the loan sale share variable.
To address this issue, I include tract dummies (Δηj) in the estimating equation that fully absorb all regional demand shocks, such as shocks to growth in local housing prices or local unemployment rates. The identification strategy assumes that changes in credit demand are felt proportionately across different banks that lend to borrowers in the same tract. The model then identifies the causal effect of the liquidity shock through variation in the lending behaviour of OTD and non-OTD lenders within the same tract. The remaining identifying assumption is that the financial crisis was not anticipated, so that a lender's reliance on the secondary market and lender-tract shocks are uncorrelated (i.e. corr(SALESHAREi,Δεij) = 0). Put differently, US mortgage lenders did not adjust their financing structures in anticipation of the shock.
5.2 Graphical Analysis
Before turning to the econometric analysis it is instructive to inspect the trends in the disaggregated loan-level data that underpin the regression. The graphical analysis is designed to see whether the difference-in-differences regression is driven by appropriate identification assumptions. The key identifying assumption in my empirical strategy is that the trends in mortgage lending are the same for the OTD lenders and non-OTD lenders in the absence of the shock to the securitisation market. This is known as the common (or parallel) trends assumption. Specifically, I compare the trends in the mortgage lending of OTD and non-OTD lenders, both before and after the credit crisis.
To aid comparisons with the regression analysis, I construct conditional estimates of the lending of both types of lenders. Specifically, I split lenders into OTD and non-OTD lenders based on whether the share of loan sales is above or below the lender-mean each year. I then separately calculate the average level of lending for both OTD and non-OTD lenders each year, and plot the logarithm of this mean estimate over time.
The aggregate trends in Figure 4 illustrate the impact of the liquidity shock on lending and generally support the identification strategy. Prior to the crisis, the trends in average lending for the two types of lenders were very similar, with the gap in lending between the two groups being relatively constant over time. This constant gap in lending activity supports the common trends assumption. As the crisis hit, the OTD lenders reduced new lending by significantly more than the non-OTD lenders, particularly in 2008. As the US economy emerged from recession in 2009, the gap in lending between the two groups then reverted back to its pre-crisis level. This overall time series pattern of lending is consistent with the hypothesis that the OTD lenders became liquidity-constrained when a major source of funding – loan securitisation – declined sharply, and this caused them to reduce credit supply relative to the non-OTD lenders that were not liquidity constrained.
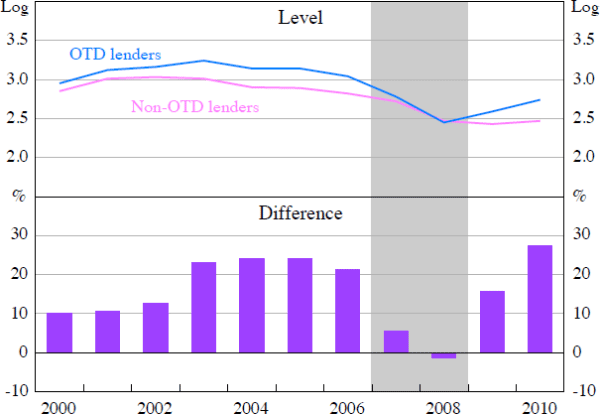
Note: Shaded areas denote crisis period (2007–2008)
Source: Home Mortgage Disclosure Act Loan Application Registry
5.3 Econometric Analysis
Table 2 summarises the results of estimating the benchmark difference-in-differences equation for the causal effect of the liquidity shock. The first column provides the OLS estimates as a benchmark and the second column provides the preferred tract fixed-effects estimates.
| OLS | Tract fixed effects | |
|---|---|---|
| Variable | (1) | (2) |
| Sale share | −0.0937*** (−2.74) |
−0.0774** (−2.17) |
| Income growth | 0.0719** (8.75) |
0.0679*** (8.63) |
| Minority share | −0.0398** (−2.15) |
−0.0840*** (−3.66) |
| Lender size | −0.0208*** (−3.22) |
−0.0217*** (−3.14) |
| Constant | 0.0824 (1.36) |
0.0875 (1.31) |
| R2 | 0.015 | 0.062 |
| Observations | 1,848,528 | 1,848,528 |
| Notes: t statistics in parentheses; ***, ** and * indicate significance at the 1, 5 and 10 per cent level, respectively; standard errors are clustered at the lender and tract levels | ||
Overall, the results strongly support the hypothesis that the negative shock to lender financing conditions caused a reduction in mortgage credit supply. Each model specification suggests that mortgage lenders that were particularly reliant on loan securitisation cut lending by relatively more during the crisis. The estimates of the effect of the liquidity shock on the number of new loans are shown in the first row of the table. The fixed-effect estimate, which controls for unobservable trends in credit demand, is −0.077 (column 2) while the OLS estimate of the causal effect is −0.094 (column 1). The OLS estimate is further from zero than the fixed-effects estimate, which suggests that the OLS bias is negative. The coefficient estimate from the fixed-effects specification implies that a one percentage point increase in the share of loans sold is associated with a decline in the level of new mortgage lending of about 7.7 per cent during the crisis. Alternatively, a one standard deviation increase in the share of loans that are sold (the standard deviation is 34 per cent) is associated with a fall in the level of new mortgage lending of about 2.7 per cent (= −0.077*0.34*100) during the crisis. At the lender-tract level, the total number of new loans fell by around 18.7 per cent, on average, over the crisis period. In other words, the estimates imply that a one standard deviation liquidity shock explains about 14 per cent (= 2.7/18.7*100) of the total decline in new mortgage credit. This effect is economically meaningful.
The coefficient estimates on the control variables are statistically significant. The income growth of loan applicants is positively correlated with growth in the number of new loans over the crisis period. The share of loan applicants that are from a minority has a negative effect on lending activity during the crisis. Also, larger mortgage lenders, as measured by the average number of loan applications, cut lending by more than smaller lenders during the crisis.