RDP 2013-02: Industry Dimensions of the Resource Boom: An Input-Output Analysis 4. Key Assumptions
February 2013 – ISSN 1320-7229 (Print), ISSN 1448-5109 (Online)
- Download the Paper 744KB
There are a number of important assumptions underlying our results in Section 3. In what follows, we examine the validity of some of these assumptions.
As noted in Section 2, the I-O tables are not available for all years in our sample. For the years in which I-O tables are not published, we assume that every $1 of industry output requires the same value and industry composition of inputs as that implied from I-O tables that are close to the year in question. For example, we use an average of 2001/02 and 2004/05 GVA requirements matrices to transform final demand into industry GVA in 2002/03 and 2003/04 (when I-O tables were not published). For this assumption to be valid, we would need to observe very little change in relative prices in the years in which we do not have I-O tables, no changes in production technology, and no constraints on the availability of inputs.
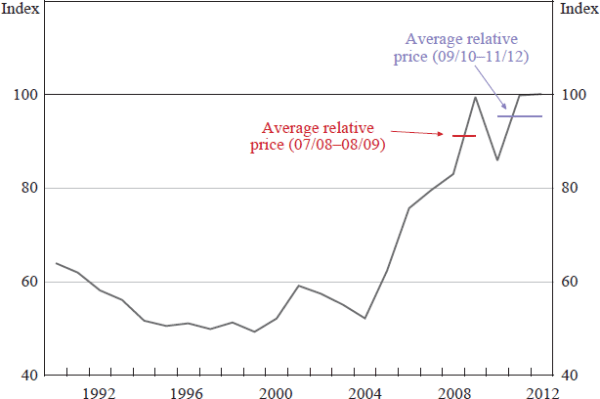
The relative price that is of particular importance for our analysis is the price of resource output relative to the price of its inputs. Figure 10 shows a proxy for this relative price over our sample period, calculated as the ratio of a resource export price deflator to a weighted input price deflator for the resource extraction sector.[24]
Sources: ABS; RBA
Fortunately, over the period where we observe a significant increase in the relative price of resource output to its inputs (from 2004/05 to 2008/09), we have annual I-O tables so we can take reasonable account of any changes in the structure of the economy in these years. In the 1990s (where we use the 2001/02 I-O tables to transform final demand into GVA), there is some variation in relative prices, but nothing like that experienced through the 2000s. Also reassuringly, beyond 2008/09 (where we use an average of the 2007/08 and 2008/09 I-O tables to transform final demand into GVA), the average relative price is reasonably close to the average of 2007/08 and 2008/09.[25] However, there is some volatility in the relative price from year to year (reflecting changes in resource export prices); as a result, we chose to smooth through some of the resulting volatility in our estimates by calculating the average growth rate over a run of years rather than focusing on the rate of growth in any single year. For example, in Figure 8 we presented the three-year-centred moving average of the annual growth in our estimates of the resource economy.
Another way of testing whether the I-O approach is providing estimates of GVA that are not biased by relative price changes, technology changes and/or capacity constraints is to compare our estimates to industry GVA data published by the ABS. For instance, if the model has correctly captured the relationships between industries in the economy, then we would expect to see only a small difference between mining GVA published by the ABS and our estimates.
We find that the mining industry GVA estimates implied by our model – in other words, resource extraction excluding resource-specific manufacturing – are generally close to those published by the ABS (Figure 11). The largest discrepancy occurs in 2009/10, where our estimate of mining GVA is $8 billion (or 0.7 per cent of total GVA) higher than that published by the ABS. More recently, our estimate of mining GVA in 2011/12 was around $7½ billion lower than that published by the ABS (or around 0.5 per cent of total GVA).
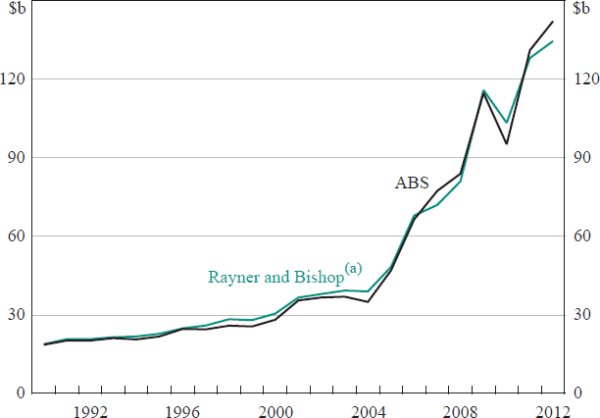
Note: (a) Resource extraction less resource-specific manufacturing
Sources: ABS; authors' calculations
There are several possible explanations for the discrepancies presented in Figure 11. First, the relationships embedded in the 2007/08 and 2008/09 I-O tables may not accurately capture the structure of the economy in the years beyond 2008/09. If this is the case, our estimates of mining GVA could be revised once we incorporate the I-O tables for these later years. Another potential source of error is the measurement and allocation of final demand to industries. It is difficult to achieve a perfect concordance between final demand data and the ABS's Input-Output Industry Groups given the level of disaggregation available in the published data, and without detailed knowledge of the various adjustments made by the ABS (some of which are confidential).
Footnotes
The resource export price deflator is calculated as the ratio of resource export values to resource export volumes, where resource exports are comprised of the following categories from the ABS' ‘Balance of Payments and International Investment Position, Australia’ release (ABS Cat No 5302.0): metal ores & minerals; coal, coke & briquettes; other mineral fuels; metals; and non-monetary gold. To calculate the weighted input price deflator, we follow the methodology used in D'Arcy, Norman and Shan (2012). First, IPDs – measured as the ratio of gross value added in current prices and chain volumes – are calculated for each industry. Second, these deflators are weighted according to each industry's contribution to total use of domestic intermediate inputs by the resource extraction sector. Third, this domestic input price index is combined with a goods import price deflator, with the two series weighted according to the relative share of domestic and imported inputs used by the resource extraction sector. One alternative method for calculating the weighted input price deflator is to use implied deflators from the ABS' ‘Business Indicators, Australia’ (ABS Cat No 5676.0). This release has data on income from sales by industry in both current prices and chain volumes. Using the IPDs from ‘Business Indicators’ gives a similar result to that presented in Figure 10. [24]
We average over the 2007/08 and 2008/09 tables because the structure of the economy in 2008/09 may not be representative of future years, given that Australia experienced a significant fall in its terms of trade and slowdown in GDP growth in 2008/09 as a result of the global financial crisis. As Figure 10 shows, the average of the I-O tables in 2007/08 and 2008/09 is likely to provide a better representation of the nominal input-output structure of the economy than if we use either of the individual tables. Our results are qualitatively unchanged if we only use GVA requirements from 2008/09 to transform final demand data from 2009/10 onwards. [25]