RDP 2010-04: Employment Composition: A Study of Australian Employment Growth, 2002–2006 4. Comparing the Employed to those Not-employed
June 2010
- Download the Paper 309KB
4.1 Methodology
The graphical comparison shows that those groups with the lowest employment rates in 2002 tended to experience the largest increase in employment rates between 2002 and 2006. In order to test this finding more systematically, we must estimate the empirical relationship between employment and personal characteristics. The standard way to do this using unit-record data is to estimate a discrete ‘choice’ model in which individuals can either be employed or not employed depending on their personal characteristics. We leave an examination of the link between being in one of the three different pools of those not-employed – the unemployed, marginally attached and those not in the labour force – and personal characteristics until Section 5.
We proceed in two steps. First, we estimate binomial logit models for 2002 and 2006 separately, as well as for data pooled over both 2002 and 2006. The binomial logit model defines the probability of an individual being in employment as a function of his or her characteristics:
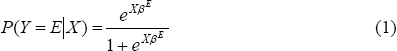
where: Y = E indicates employment (the alternative is not-employed); X is a vector of dummy variables (xj) indicating personal characteristics; and βE is a vector of coefficients (the superscript E indicates that these coefficients are relevant to the propensity to be employed).[8]
We present our results in terms of the odds ratio of employment associated with each characteristic (ORxi). The odds measures the probability of the person being in employment relative to the probability of the person being not employed conditional on the person's characteristics. The odds ratio associated with each characteristic is the ratio of two odds: the odds that an individual who has the characteristic in question but otherwise exhibits the ‘base’ set of characteristics is in employment; and the odds that an individual who exhibits the full ‘base’ set of characteristics is in employment. Mathematically:
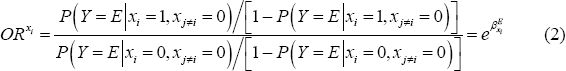
An odds ratio greater than 1 indicates that the odds of being in employment are higher for a person who exhibits that characteristic than for a person who is otherwise identical but does not exhibit that characteristic. In this way, we can identify which characteristics are associated with a higher probability of being in employment.
The second step is to formally test for changes in the coefficients over time. We estimate the binomial logit model over the pooled data and interact a 2006 dummy with each of the explanatory variables. For those dummies that are statistically significant, we conclude that the relationship between the relevant characteristic and employability had changed over time. We also test whether there was any statistically significant change in the overall relationship between characteristics and employment by testing the null hypothesis that all the dummy variables are jointly equal to 1 (in which case the regression results for 2006 would not be statistically different from the results for 2002).
4.2 Average Distribution of Employment over 2002 and 2006
Before discussing the change over time, it is worth reviewing the average distribution of employment over personal characteristics that we determine from the regression over the pooled data. As discussed above, an odds ratio greater than 1 indicates that the characteristic is associated with a higher probability of being in employment (compared to the base characteristic) and vice versa for an odds ratio less than 1. As expected, characteristics typically associated with high labour supply or high productivity raise the probability of being in employment (Table 1). In particular, the probability of being in employment is higher for younger workers, partnered males, individuals with more work experience, and those with a high level of education and a higher occupation status. In contrast, the probability of being employed is lower for those aged over 45 years, women with young children, those with less than high school education, production and unskilled workers, migrants from non-English-speaking backgrounds and people with very little work experience. Our model predicts 93 per cent of the observations and has a pseudo R-squared of 0.67.
| Pooled |
2002 |
2006 |
Diff(b) |
Pooled excl history(c) | |
|---|---|---|---|---|---|
| 2006 (vs 2002) | 1.0 | 1.2*** | |||
| Age (vs 36–45 years) | |||||
| 18–25 years | 1.2 | 1.1 | 1.2 | 1.6*** | |
| 26–35 years | 0.9 | 1.1 | 0.8 | 1.1 | |
| 46–55 years | 0.7*** | 0.7** | 0.7** | 0.7*** | |
| 56–65 years | 0.4*** | 0.4*** | 0.4*** | 0.2*** | |
| Birth country (vs Australia) | |||||
| English-speaking | 1.0 | 0.9 | 1.1 | 1.0 | |
| Non-English-speaking | 0.7*** | 0.7*** | 0.8 | 0.5*** | |
| Education (vs university) | |||||
| Diploma or certificate | 0.8** | 0.6*** | 1.0 | ** | 0.7*** |
| High school | 0.9 | 0.8 | 1.0 | 0.7*** | |
| Less than high school | 0.6*** | 0.5*** | 0.8 | ** | 0.5*** |
| Occupation (vs professional) | |||||
| Associate professional | 0.9 | 0.9 | 0.8 | 0.8*** | |
| Trade | 0.9 | 1.0 | 0.9 | 0.7*** | |
| Production | 0.6*** | 0.7* | 0.6*** | 0.5*** | |
| Unskilled | 0.8 | 0.8* | 0.9 | 0.5*** | |
| Father's occupation (vs professional) | |||||
| Associate professional | 1.1 | 0.9 | 1.3* | * | 1.1 |
| Trade | 1.3** | 1.5*** | 1.1 | 1.2** | |
| Production | 1.2** | 1.4** | 1.0 | 1.2*** | |
| Unskilled | 0.8 | 0.8 | 0.9 | 0.9 | |
| Mother's employment status (vs employed) | |||||
| Not employed | 1.1 | 1.2 | 1.0 | 1.1*** | |
| Student status (vs not student) | |||||
| Enrolled full-time | 0.9 | 1.0 | 0.8 | 0.5*** | |
| Finished studies 1–2 years ago | 1.4** | 1.6 | 1.3 | 0.9 | |
| Time in work in previous year (vs 100 per cent) | |||||
| 0 per cent | 0.0*** | 0.0*** | 0.0*** | na | |
| 1–25 per cent | 0.0*** | 0.0*** | 0.0*** | na | |
| 26–50 per cent | 0.0*** | 0.0*** | 0.1*** | * | na |
| 51–75 per cent | 0.1*** | 0.0*** | 0.1*** | na | |
| 76–99 per cent | 0.1*** | 0.1*** | 0.1*** | na | |
| Time in work since school (vs more than 50 per cent) | |||||
| Less than 50 per cent | 0.8** | 0.9 | 0.7** | na | |
| Health condition (vs healthy) | |||||
| Has health condition | 0.5*** | 0.5*** | 0.6*** | 0.3*** | |
| Housing tenure (v mortgagee) | |||||
| Outright owner | 0.9 | 0.9 | 0.9 | 0.8*** | |
| Renter | 1.3* | 1.1 | 1.4* | 1.6*** | |
| Family status (vs male couple with no child) | |||||
| Female | 0.9 | 0.8* | 1.0 | 0.7*** | |
| Single with no child | 1.0 | 1.1 | 0.8 | 0.7*** | |
| Couple, male, child 0–4 years | 1.3 | 1.4 | 1.2 | 1.3** | |
| Couple, male, child 5–24 years | 1.5*** | 1.6** | 1.4 | 1.9*** | |
| Couple, female, child 5–24 years | 1.1 | 1.1 | 1.1 | 0.8*** | |
| Couple, female, child 0–4 years | 0.3*** | 0.3*** | 0.3*** | 0.1*** | |
| Single, child 0–14 years | 0.9 | 1.0 | 0.8 | 0.4*** | |
| Has non-resident child | 1.4** | 1.5* | 1.4 | 0.9 | |
| Net wealth (vs top quintile) | |||||
| 1st quintile | 0.5*** | 0.6** | 0.5*** | 0.2*** | |
| 2nd quintile | 0.7** | 0.8 | 0.7* | 0.4*** | |
| 3rd quintile | 0.7*** | 0.7** | 0.7** | 0.6*** | |
| 4th quintile | 0.8* | 0.7* | 0.9 | 0.8** | |
| Income less own labour income (vs top quintile) | |||||
| 1st quintile | 1.7*** | 1.2 | 2.2*** | ** | 2.9*** |
| 2nd quintile | 1.2* | 1.1 | 1.4* | 1.4*** | |
| 3rd quintile | 1.3** | 1.2 | 1.3* | 1.3*** | |
| 4th quintile | 1.3** | 1.1 | 1.4** | 1.4*** | |
| Debt-to-income ratio (vs above 3) | |||||
| 0 | 0.5*** | 0.5*** | 0.5*** | 0.2*** | |
| 0–1 | 0.6*** | 0.6*** | 0.7*** | 0.4*** | |
| 1–3 | 0.8** | 0.7* | 0.9 | 0.6*** | |
| Remoteness (vs capital city) | |||||
| Major city | 1.1 | 1.1 | 1.1 | 1.0 | |
| Rural | 1.0 | 1.1 | 0.9 | 1.0 | |
| State or Territory (vs NSW) | |||||
| Victoria | 0.9 | 1.0 | 0.9 | 1.1 | |
| Queensland | 0.9 | 0.9 | 0.9 | 0.9 | |
| South Australia | 1.1 | 0.9 | 1.1 | 1.1 | |
| Western Australia | 1.0 | 1.0 | 1.0 | 0.9 | |
| Tasmania | 0.8 | 0.5** | 1.2 | ** | 0.9 |
| Northern Territory | 2.6* | 7.8*** | 1.0 | ** | 2.7*** |
| ACT | 1.2 | 0.8 | 1.5 | 1.2 | |
| Imputed (vs not imputed) | 1.4*** | 1.4*** | 1.5*** | 1.6*** | |
| Memo items: | |||||
| Number of observations | 17,606 | 8,952 | 8,654 | 17,606 | |
| Likelihood ratio test (p-value) | 0.00 | 0.00 | 0.00 | 0.00 | |
| Pseudo R2 | 0.67 | 0.69 | 0.65 | 0.29 | |
| Predictive power(d) | 93.1 | 93.3 | 93.2 | 81.6 | |
| Wald test of the full set of 2006 dummies equal to zero (p-value)(b) | 0.15 | ||||
| Notes: (a) Base case is indicated in brackets for each group of categorical variables. Standard errors calculated using White's robust variance estimator. *, ** and *** indicate significance at the 10, 5 and 1 per cent levels respectively. (b) Results from a regression of employment status on characteristic type and a set of dummies that interact characteristics with the year 2006. Null hypothesis is that the coefficient on the 2006 characteristic is equal to zero, that is, no difference in the relative probability of employment between 2006 and 2002 for that characteristic compared to the base case. (c) The same regression, but excluding the work history variables. (d) Percentage of observations correctly predicted, where the rule is to predict employment if probability of employment for that individual is greater than 50 per cent, and predict not-employed otherwise. |
|||||
A few results are worth discussing in more detail.
One of the key predictors of employment status is work history. Excluding these variables, only 82 per cent of observations are correctly predicted and the pseudo R-squared falls to 0.29. As expected, the greater the proportion of the previous financial year (or lifetime) spent in work, the greater the likelihood that that individual is employed.
Financial incentives are also strongly related to the probability of being employed. Theory suggests that a higher level of household income may decrease the financial incentive to work. Consistent with this we find a negative relationship between the probability of being employed and household income. Similarly, the positive relationship between the debt-to-income ratio and the probability of being in employment indicates a strong role for financial incentives.[9]
4.3 Comparing 2002 and 2006
Having identified the characteristics associated with employment, we now examine whether those who are not employed have become more or less similar to the employed, and which characteristics are central to understanding that change. Including a full set of 2006 interaction dummies in the pooled regression does not alter the fit of the model, the pseudo R-squared is 0.67, and 93 per cent of observations are correctly predicted. Very few interactive terms are found to be significant at the 10 per cent level, and a Wald test that all interactive terms are equal to zero cannot be rejected at the 10 per cent level. For each characteristic group, we test the joint significance of the 2006 interactive dummies – only for two categories (father's occupation and regional location) are the dummies jointly different from zero at the 10 per cent significance level (see Appendix Table B1). Thus, the change in the distribution over time appears to be minimal.
Nevertheless, in a number of cases, the point estimates do change in an economically meaningful way. Further, these changes are consistent with those in Figure 2. The characteristics least associated with employment in 2002 were relatively more likely to be associated with employment in 2006. In other words, there appears to have been some broadening of employment across people with the lowest employment rates in 2002.
Notably, the estimated odds ratios across all categories of employment experience (where the base case is 100 per cent employment in the previous year) were higher in 2006 than in 2002. This implies that the link between previous employment experience and current employment status, though still strong, was somewhat weaker in 2006 than in 2002. The effects of this phenomenon can be seen directly in the fall in the proportion of the sample who were long-term unemployed (over 24 weeks) from 1.0 per cent to 0.6 per cent. This result supports the idea that during an employment expansion the average level of recent work experience in the population rises.[10]
Other low employment groups also appeared to benefit in a relative sense from increased labour demand. The odds ratios of employment for the unskilled, those with lower education and migrants from non-English-speaking countries were all higher in 2006 than in 2002. In the case of education, the increases in the odds ratios of employment associated with less-than-high-school and diploma-level education are significant at the 10 per cent level.
One dimension in which the low-employment groups were not found to have benefited is across the net wealth categories; the odds ratios of employment fell for the two bottom net wealth quintiles. However, it is difficult to interpret this change because of the dependence of wealth on employment.
Footnotes
We estimate our model using the logit and mlogit commands in Stata 10 without weighting the data; the qualitative story is robust to estimation with or without weighting. The HILDA sample is fairly representative of the population across the variables we include. Further, attrition between waves 2 and 6 appears to have occurred at similar rates across characteristics, so that the sample should not have become unrepresentative over time. [8]
Also see Belkar et al (2007) who attempt to identify a causal effect of increased debt-to-income ratios on the labour supply of women. [9]
In the inertia model, past work experience also proxies for unobservable characteristics. Therefore, this result may suggest that the relationship between ‘employability’ and the unobserved individual characteristics had weakened between 2002 and 2006. [10]