RDP 2008-01: A Sectoral Model of the Australian Economy 6. Sensitivity Analysis
April 2008
6.1 Sample Period
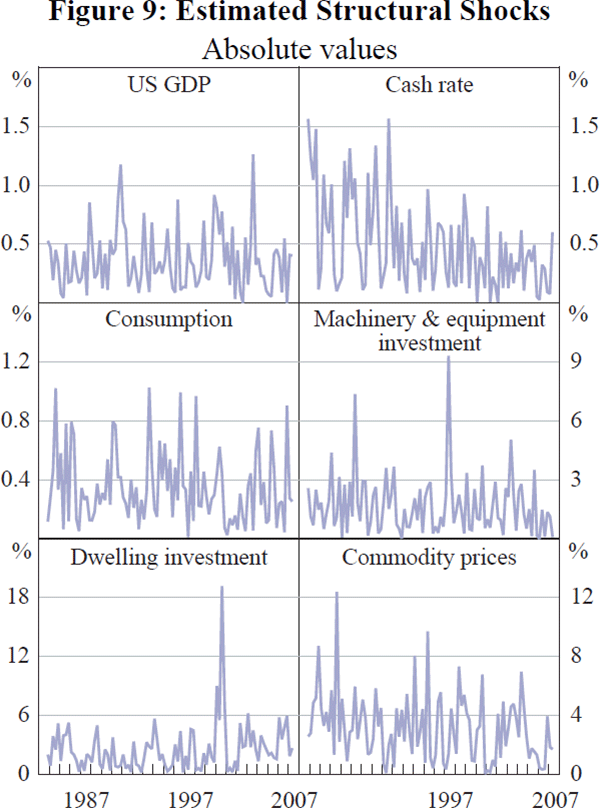
The results from SVAR models can be sensitive to the way they are specified, including the sample period over which they are estimated. Our baseline models were estimated over the period from 1983 to 2007. Not only have some structural features of the Australian economy changed over this period, but most importantly for this analysis, the monetary policy framework changed in 1993 with the advent of inflation targeting. Figure 9 shows that the absolute magnitude of the structural shocks in the cash rate equation has declined significantly in the second half of our sample period, suggesting that monetary policy has become more predictable.[18]
To examine whether the relative interest sensitivity of different sectors is influenced by our sample period, we re-estimate our expenditure components model over two periods – March 1981 to September 1997, and March 1991 to September 2007. Each sample contains 67 observations and we have chosen them to minimise the number of overlapping observations while leaving us with enough degrees of freedom to estimate the model.
Figure 10 compares the impulse responses of the expenditure components of GDP to an unexpected 25 basis point increase in the cash rate over the two sample periods. It is clear that the relative responses across the different components are similar across the two sample periods, although the size of the responses appears to have increased in the more recent period. However, given that the model is less precisely estimated over the shorter samples, we are hesitant to interpret our results as suggesting that there has been a significant change in the transmission of policy through different sectors in the economy over time.[19]
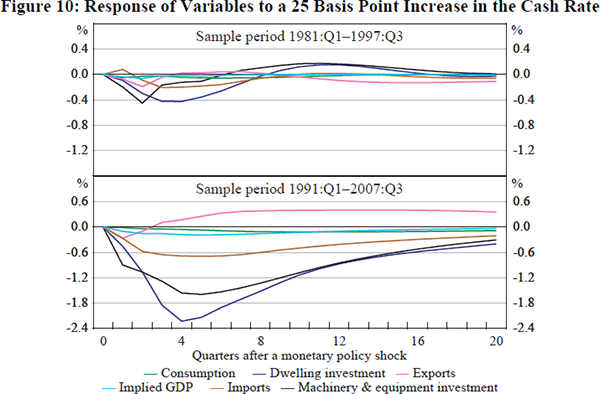
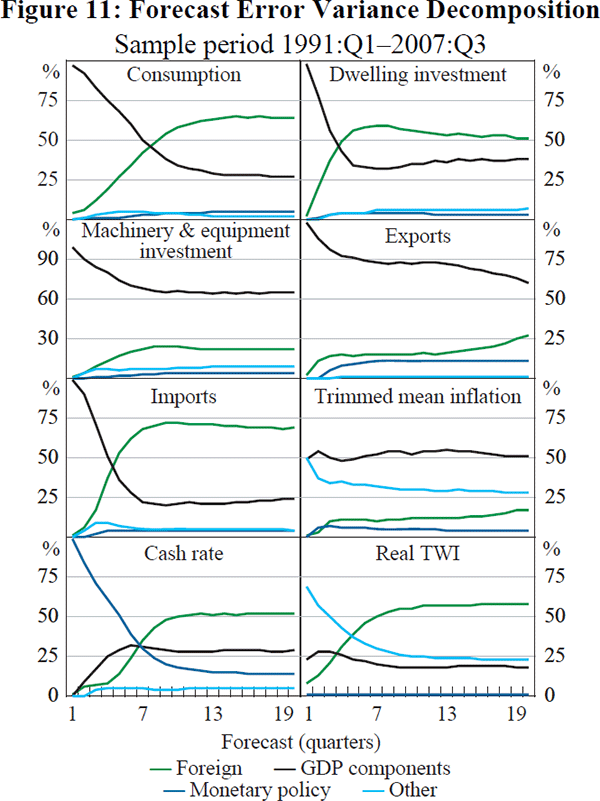
Figure 11 shows the forecast error variance decomposition for the endogenous variables in the model estimated over the more recent sample period. Two patterns stand out. First, the importance of foreign shocks, particularly at long horizons, is noticeably larger in the more recent sample period than in the earlier sample period. This may reflect the rapid growth in the prices of Australia's export commodities, which has had a profound impact on the Australian economy in recent years. Second, unexplained changes in monetary policy surprises explain none of the variance in the forecast errors at longer horizons in the more recent sample. This is consistent with the decline in the magnitude of monetary policy shocks suggested by Figure 9, reflecting the increased predictability of monetary policy in the inflation-targeting era.[20]
6.2 Omitted Variables
We also examine whether our results are robust to the choice of variables in our baseline specifications. First, we include major trading partner GDP instead of US GDP as our measure of global economic activity to better capture the effect of the recent rapid growth of countries such as China. The inclusion of major trading partner GDP leaves our key results broadly intact, although there is an increase in the interest sensitivity of dwelling investment relative to our baseline model, which implies a slightly larger decline in aggregate GDP in response to a positive interest rate shock, although it also returns to its baseline level more rapidly.
We also estimate models including variables such as total credit (which may be correlated with the cash rate) and household net wealth (which may be correlated with dwelling investment and consumption).[21] The alternative variables have little effect on our core results. The inclusion of the wealth variable increases the interest sensitivity of consumption slightly.
6.3 Identification Schemes
Finally, we experimented with alternative identification schemes such as the recursive scheme proposed by Christiano et al (1996), in which monetary policy responds to GDP and inflation contemporaneously, but these variables respond to monetary policy only with a lag. Again, the relative sensitivity of the sectors is largely unchanged.
Footnotes
For ease of interpretation, we have converted the structural errors to absolute values. [18]
The model is less stable over the shorter sample period, converging only when two lags are used instead of three, and underlying inflation does not fall at any stage after an unanticipated increase in the cash rate. [19]
Once again, because of the small size of our sample over this estimation period and the large number of parameters to be estimated, these results should not be taken as definitive evidence of the changing importance of various shocks to the Australian economy over the past two decades. However, the results seem plausible in light of the economic outcomes that have characterised the Australian economy in recent years – in particular, the maintenance of low inflation and relatively stable GDP growth (at least compared to previous decades). [20]
See Berkelmans (2005) for a detailed VAR study of the role of credit in the transmission of monetary policy. [21]