RDP 2007-09: Private Business Investment in Australia 2. Trends in Investment
September 2007
- Download the Paper 467KB
2.1 Long-term Trends in Investment
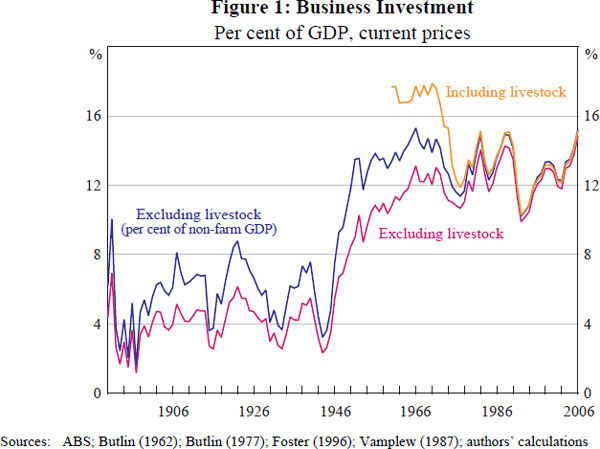
Private business investment (excluding livestock and in nominal terms) as a share of non-farm GDP increased dramatically and permanently mid last century. The investment share rose from an average of around 5–6 per cent in the first part of the century to average around 12 per cent over more recent decades (Figure 1).
A detailed discussion of the reasons for the change is beyond the scope of this paper, but a number of possible explanations for the existence or timing of the rise are briefly outlined below. First, Maddock (1987) argues that by 1945 the Australian private capital stock was substantially depleted and had aged significantly, given the distractions of two world wars and the intervening depression. This suggests that some of the new investment at the time may have been to modernise an out-of-date and depreciated capital stock. Second, investment (particularly in manufacturing industries) may have been encouraged by some of the policies of post-war governments, such as substantial trade protection for capital-intensive industries, the relaxation of capital controls and generous depreciation allowances (Maddock 1987).
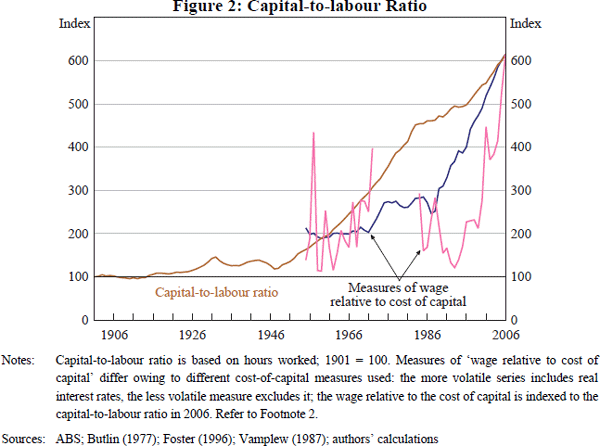
Third, investment in the post-war period could have been buoyed by increases in the cost of labour, which made capital relatively more attractive. This is consistent with a rise in the capital-to-labour ratio and the real wage relative to the Hall-Jorgenson cost of capital (Figure 2).[1] Fourth, the post-war period saw the introduction (and increased popularity) of relatively capital-intensive consumer products. Similarly, new technologies often resulted in more capital-intensive methods of production for existing goods.[2]
2.2 Investment over the Past Three Decades
The rest of the paper focuses on investment over the past three decades or so for which reliable data are more readily available. After a brief discussion of the data underlying the econometric modelling conducted later in the paper, trends in investment by industry and by type are discussed.
2.2.1 Data
The main econometric models presented in Section 3 examine investment by asset type: equipment; non-residential building (such as office blocks and factories); and engineering (largely mines and infrastructure, such as roads, ports and railways). Data are quarterly over 1974:Q2–2006:Q2 for equipment, 1986:Q3–2006:Q2 for building, and 1979:Q2–2006:Q2 for engineering, with models also estimated over a shorter common sample of 1990:Q1–2006:Q2. This shorter period can be characterised both by a deregulated financial system and low inflation. Most data are available from the National Accounts, or from other sources as outlined in Appendix A. Investment by industry (Section 2.2.2) is presented annually as these data are not available quarterly.
Before proceeding with a discussion of recent trends, a few comments are necessary on the usefulness of real measures of investment. Investment theory, and some key related concepts – such as capital stocks and depreciations rates – are inherently based on real values. However, estimates of real investment can be strongly influenced by large trends in relative prices, which means that nominal and real investment shares of GDP can provide very different measures of the strength of investment spending (Figure 3, top panel).
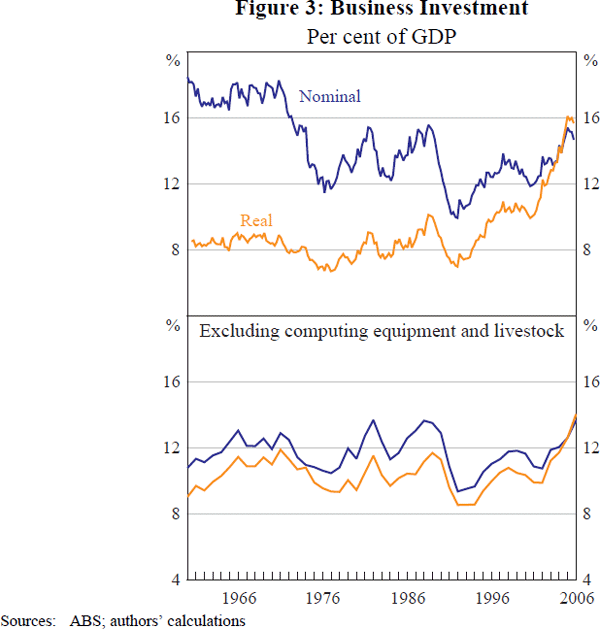
Concerns regarding measures of real investment typically arise because of the behaviour of computing equipment and livestock, which have undergone large price changes relative to other components of investment.[3] A key concern is that the extent of the measured fall in quality-adjusted computing equipment prices may be overstated, thereby raising doubts about the strength in real measures of computing equipment investment. Computing equipment prices are quality-adjusted using hedonic techniques; however, this approach has its limitations and it is unclear whether changes to the characteristics of computers truly describe how their contribution to the productive capital stock has changed.
Another concern, even when large relative price shifts are measured correctly, is that the use of chain-linking in constructing real data can produce levels estimates that do not have an intuitive interpretation. In part, this arises because chain-linking no longer guarantees that components will add to their aggregates, with this type of non-additivity being more pronounced the larger the relative price changes. Appendix B provides more detail on these issues.
Despite these concerns about the real estimates, once computing equipment and livestock are excluded, there is little to distinguish nominal and real shares of GDP (Figure 3, bottom panel). For this reason, in what follows we exclude equipment (and livestock) from investment where possible. Separating out computing equipment investment is not straightforward when modelling quarterly investment data for Australia, since computing equipment investment data are only available at an annual frequency. In this paper, a quarterly series for non-computing equipment investment is constructed by chain-linking annual estimates and basing intervening quarterly movements on quarterly movements in total equipment investment. This is done using benchmarking procedures developed by Denton (1971) and is very similar to the procedures used by the ABS.
2.2.2 Investment by industry and type
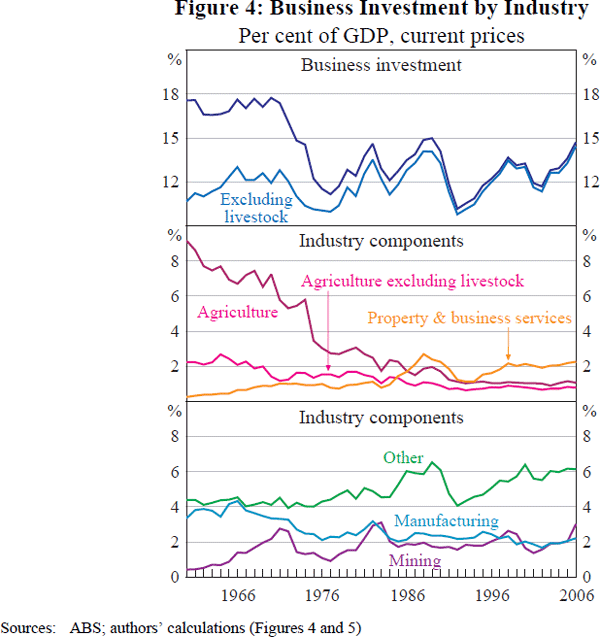
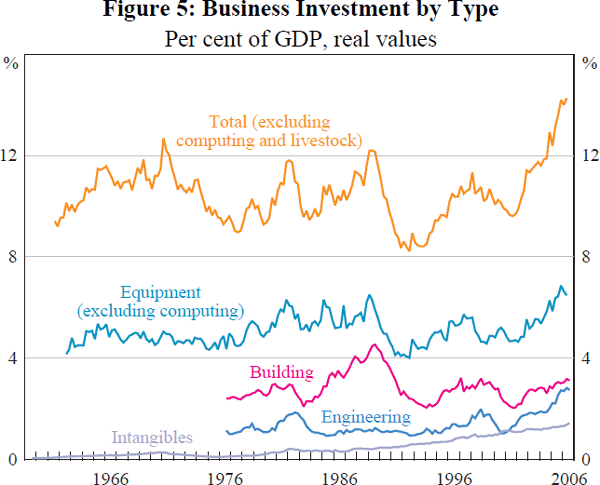
The behaviour of investment has varied considerably across industries over the past few decades.[4] The contributions of the main industries to private investment are shown in Figure 4 (in nominal terms), along with the remaining industries shown collectively as ‘other’. The mining booms of the early 1970s, early 1980s and of recent years are clearly evident. The commercial property boom and bust of the late 1980s/early 1990s is apparent in investment by the property & business services industries and those industries covered by ‘other’.[5] The mining and commercial property booms can also be seen in movements of the real shares of engineering and building investment (respectively) when investment is decomposed by asset type (Figure 5).
Because movements in aggregate investment reflect quite different trends and cycles at the disaggregated level, it is likely that modelling undertaken at the disaggregated level (in this paper, by asset type) may be required in order to uncover the main drivers of business investment. For interested readers, Appendix D decomposes industry components into changes in investment intensity and GDP shares, and discusses industry trends in more detail.
Footnotes
See Section 3 for a discussion of the cost of capital. The measure shown in Figure 2 excludes the cost of equity due to data availability. The 1970s was a period of very low real interest rates, and hence wages relative to the cost of capital appear implausibly high. The broken series shown excludes some of this period, while the other measure excludes real interest rates altogether. [1]
The Solow-Swan neoclassical growth model suggests that along the balanced growth path the optimum investment share of GDP will be higher if technological progress is more rapid (and the capital-to-labour ratio will grow faster). Without technological change, the diminishing marginal product of capital will limit the increase in capital intensity of production brought about by (even very large) movements in relative prices (Gordon 2001). [2]
The price of computing equipment in 2005/06 is estimated to be 1.9 per cent of its value in 1985/86, while the price of livestock investment is estimated to be 19.6 per cent of its value in 1965/66, with most of this fall occurring in the 1960s and 1970s (see Table B1 in Appendix B). Livestock is a separate asset type and so is not included in equipment, building or engineering investment in the modelling that follows. Intangibles investment is also excluded from the analysis. [3]
Data availability prevents computing equipment and livestock from being removed from industry estimates in this section, so nominal investment shares are presented instead. [4]
Property & business services and ‘other’ industries were also affected by a general downturn and subsequent recovery in equipment investment that accompanied the recession of the early 1990s. [5]