RDP 2006-02: Term Structure Rules for Monetary Policy 2. The New Keynesian Model
April 2006
- Download the Paper 316KB
The model presented here is a standard New Keynesian model with an extended set of equilibrium conditions in order to allow for an explicit consideration of the term structure of interest rates. Instead of working through the details of the derivation, I present the key aggregate log-linear relationships.[8]
The aggregate demand schedule implies that the current level of the output gap, xt, depends on the expected future level of the output gap and the one-period real interest rate:

where R1,t is the one-period nominal interest rate; πt is the inflation rate during period t; at is a technology shock with persistence governed by ρ; and gt is a preference shock with persistence governed by ϕ and size µg.
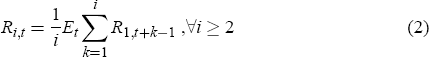
It can be shown that the theory of the term structure of interest rates that emerges from optimising behaviour in the context of this model is the expectations hypothesis. The nominal interest rate at t associated with a zero-coupon bond that promises to pay one dollar at the end of period t + i − 1 is given by
Firms are assumed to operate in an environment characterised by monopolistic competition in the goods market and by price stickiness. Factor markets are assumed to be competitive and goods are produced with a constant returns-to-scale technology. Following Calvo (1983), it can then be shown that the above assumptions produce the log-linear New Phillips curve given by

where νt is a cost-push shock with size µv. The parameter λ > 0 governs how inflation reacts to movements of output from its natural level. A larger value of λ implies that there is a greater effect of output on inflation. In this sense, prices may be viewed as adjusting faster. The household's discount factor β is restricted to lie between 0 and 1.
Finally, to close the model we need assumptions about the behaviour of the monetary authority. The standard case characterises monetary policy as a commitment to the following Taylor-type rule:

where bt is a monetary policy shock whose size is governed by µb.
In the case in which the monetary authority adds a long-term rate as an additional variable to which it reacts, the policy rule can be characterised by

Throughout the paper, policy rules that allow a reaction to long-term rates are labeled type-1 rules. I study these rules of type-1 for maturities 2, 4, 12, 20 and 40 which, for a quarterly frequency, correspond to a term structure composed of bonds with maturities of 6 months, 1 year, 3 years, 5 years and 10 years, respectively.
When the central bank replaces the short-term rate in the standard Taylor rule with a long-term rate, monetary policy follows a rule of the form

Policy rules like this are labeled type-2 rules. As before, the selected term structure for type-2 rules is 2, 4, 12, 20 and 40.
Notice that as interest rates of various maturities are linked by the expectations hypothesis, whatever outcome a type-1 or type-2 rule produces, it could alternatively be obtained using some given rule for the short-term rate. For example, the central bank could achieve the same equilibrium allocation either by using a type-2 rule for R2,t, or by using a rule for the short-term of the form

Hence, one could view the exercise either as an analysis of different policy rules for the short rate, or as a comparison of Taylor-type rules involving various longer-term rates.
Finally, the stochastic block of the model is assumed to behave as given by
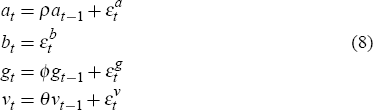
where the parameters are restricted as follows: |ρ| < 1, |φ| <
1, |θ| < 1, and the independently and identically distributed shocks  and
and
 have
normal distributions, zero mean, and standard deviations given by,
have
normal distributions, zero mean, and standard deviations given by,  and
and
 ,
respectively.
,
respectively.
The model is calibrated to roughly match key features of the Australian and the US economies.
The parameters β and λ are fixed throughout the study. These
parameters are set to 0.99 and 0.14, respectively, as usually done in the literature. The value
for λ implies an expected price-contract length of one year. The shocks
associated with the parameters ρ, φ and θ are thought
to be highly persistent innovations.[9]
For this reason they are set to 0.95. Finally, the parameters that control the size or standard
deviation of the remaining shocks are calibrated as follows. The standard deviation of the
technology shock,  , is set to 0.7 following Cooley and Prescott
(1995). Then, in the case of a Taylor rule with τ = 0.5, α = 0.6 and
δ = 0.0009, the values of µb, µg and
µv are chosen so as to approximate the volatility of the output gap,
the interest rate and inflation in the data.[10]
, is set to 0.7 following Cooley and Prescott
(1995). Then, in the case of a Taylor rule with τ = 0.5, α = 0.6 and
δ = 0.0009, the values of µb, µg and
µv are chosen so as to approximate the volatility of the output gap,
the interest rate and inflation in the data.[10]
For Australia, the output gap is constructed as the log difference between the quarterly real non-farm output and real potential quarterly output as calculated by the model of Stone, Wheatley and Wilkinson (2005). Inflation is measured as the quarterly change of the weighted-median CPI, and the interest rate is taken to be the nominal 90-day bank bill rate. For the US, the output gap is constructed as the log difference between the seasonally adjusted quarterly real GDP and real potential quarterly GDP taken from the Congressional Budget Office. Inflation is measured as the quarterly change of the GDP implicit price deflator and the interest rate is the 3-month Fama and Bliss zero-coupon bond yield data from the Center for Research in Security Prices.
 and
and