RDP 2006-01: Modelling Manufactured Exports: Evidence from Australian States Appendix A: Data
April 2006
- Download the Paper 484KB
To construct an estimate of state manufactured exports in real terms, the value of manufactured exports for each state and 2-digit SITC manufactured product is deflated using the national deflator for the same product. This level of disaggregation is used to account for differences in the mix of products across states, and in price trends across various goods.
Data on 2-digit SITC manufactured export values for each state are sourced from the Australian Bureau of Statistics (ABS Cat No 5465.0). Manufactured exports consist of all categories within Sections 5–8 of the 2-digit SITC classification, plus beverages (Division 11). However, automatic data processing (ADP) exports and Divisions 67 (iron & steel) and 68 (non-ferrous metals) are excluded. ADP exports are excluded because of the bias inherent in this division's deflator (arising from its changing product mix over time). Adjustments are also made to the Victorian series, to remove the value of frigate exports in 1997:Q2 and 1999:Q4. The national implicit price deflators that are used to deflate these values estimates are sourced from the ABS (Cat No 6457.0). The resulting disaggregated estimates in real terms are then aggregated, and seasonally adjusted using the X-12 program.
Real exchange rates are calculated as per Equation (2), with daily nominal exchange rates (sourced from Reuters) averaged to form quarterly series. The 21 economies used in calculating exchange rates are: Canada; China; the euro area; Hong Kong; India; Indonesia; Japan; Malaysia; New Zealand; Papua New Guinea; the Philippines; Saudi Arabia; Singapore; South Africa; South Korea; Sweden; Switzerland; Thailand; the United Arab Emirates; the United Kingdom; and the United States. These countries are included based on their presence in the Reserve Bank of Australia's trade weighted index (Taiwan and Vietnam are excluded due to data limitations).
The domestic price used to calculate the real exchange rate is the national manufacturing output producer price index (ABS Cat No 6427.0). National prices are used due to the lack of a corresponding state-specific series; it would theoretically be possible to use constructed implicit price deflators for manufactured exports, as calculated above, but any errors in the construction of these series could bias the estimated price elasticity towards 1 (Kemp 1962). Foreign prices are, in general, producer prices for manufactured goods, although the CPI is used for China, Papua New Guinea and the United Arab Emirates due to the lack of suitable producer price series. Where data for a country commences part-way through the sample (such as for India), that country is spliced onto the exchange rate index by using growth rates of the index with and without the inclusion of this country.
Weights used in the construction of real effective exchange rates and trading partner GDP are calculated from data on Australian exports by country for each (2-digit) SITC manufactured product. The share of exports from state s to country j, is calculated by summing over all manufactured products, i, as follows:
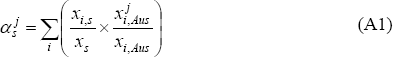
where:  is Australian exports of product i to country
j; xi,Aus is total Australian exports of product i;
xi,s is state exports of product i; and xs is
total state exports. This method assumes that exports of product i are traded with the
same countries (and in the same proportion) regardless of where they are produced, so that
differences in state trading partner weights derive solely from differences in the share of each
product in total state exports. Data on Australian trade by SITC good and destination country
are taken from the IMF's COMTRADE database. Weights are updated annually, using the prior
year's trade data.
is Australian exports of product i to country
j; xi,Aus is total Australian exports of product i;
xi,s is state exports of product i; and xs is
total state exports. This method assumes that exports of product i are traded with the
same countries (and in the same proportion) regardless of where they are produced, so that
differences in state trading partner weights derive solely from differences in the share of each
product in total state exports. Data on Australian trade by SITC good and destination country
are taken from the IMF's COMTRADE database. Weights are updated annually, using the prior
year's trade data.
Trading partner GDP is calculated as per Equation (3), with data on quarterly real GDP sourced from national statistics offices via Datastream. Quarterly Chinese GDP is calculated by fixing the level of GDP in the June quarter 2000 to 53.3 per cent that of the US economy, in line with PPP weights, and then using the profile of year-to-date average growth, published by the National Bureau of Statistics of China office, to extrapolate quarterly growth rates. The shares of exports from state s to each country are again used as weights.
A quarterly estimate of the (national) manufacturing capital stock is interpolated from annual data (ABS Cat No 5204.0, Table 71). Domestic final demand is sourced from the ABS (Cat No 5206.0), and is in chain volume, seasonally adjusted terms. The NAB measure of capacity utilisation is for only the manufacturing industry, and is taken from the quarterly survey published by the NAB. The ACCI-Westpac capacity utilisation measure is sourced from ACCI. This measure is presented in net balance terms. It is scaled to a level series using the ratio of the long-run averages of the NAB and ACCI-Westpac series, adjusted for differences in their variances.
The proportion of each state's exports that are elaborately transformed is calculated using 2-digit SITC export data by state for 2000–2004, and classifying each category as simply or elaborately transformed according to Productivity Commission (2003) classifications (Table 4.2). This implies that SITC Sections 5 and 6 are simply transformed, except Divisions 54 (medical & pharmaceuticals), 59 (chemical materials) and 69 (metal manufacturing). In addition to these three divisions, all products in Sections 7 and 8, except miscellaneous manufacturing (89), are classed as elaborately transformed. Beverages (Division 11) are also classified as elaborately transformed. The proportion of imported inputs in manufacturing production is calculated by weighting each state's share of manufacturing industry i (defined using ANZSIC classifications, with data on production by state and industry taken from ABS Cat No 8221.0) by the import content of that industry nationally (see Productivity Commission 2003, Table 6.2). Adjustments are made for the exclusion of food, much of printing & publishing and most of the metal products division from SITC manufactured export classifications.
The cost of inputs to manufacturing, used in the simultaneous equations model, is represented by the ‘materials used in manufacturing’ series from the Producer Price Indexes, Australia release (ABS Cat No 6427.0), and is common across all states.