RDP 2005-08: Declining Output Volatility: What Role for Structural Change? 4. Results
October 2005
4.1 Basic Approach
The OLS estimates of Equation (1) are shown in Table 4. Model 1a is the full specification, with two direct structural indicators, three indirect structural indicators and oil price volatility as explanatory variables. Of these, only the two direct measures are statistically significant; less product market regulations (PMR) and a stricter monetary policy regime lead to lower output volatility in the subsequent five-year period. These results are robust to the exclusion of individual countries. Using a general-to-specific approach leads to the parsimonious Model 1b, with essentially unchanged coefficients on product market regulation and the monetary policy regime dummy variables. The inclusion of a separate Exchange Rate Mechanism (ERM) dummy variable suggests that other stricter monetary policy regimes have led to a greater reduction in output volatility. Point estimates suggest that adopting the ERM resulted in a 0.3 percentage point decline in output volatility, whereas a move to other strict monetary policy regimes led to a larger decline of 0.5 of a percentage point. The inclusion of a separate inflation-targeting dummy variable suggests that a change to this regime results in a larger reduction in output volatility (of 0.4 of a percentage point) than a move to other strict monetary policy regimes (0.3 of a percentage point). However, while these results are economically meaningful, they are not statistically significant and are not considered in regressions hereafter.
| Variables | Period | Model | |||||
|---|---|---|---|---|---|---|---|
| Basic | Fiscal policy(a) |
Inflation volatility |
Barrell & Gottschalk (2004)(b) |
Annual data(c) |
|||
| 1a | 1b | 2 | 3 | 4 | 5 | ||
| Direct structural measures | |||||||
| Product market regulations | t−1 | 0.220** | 0.202* | 0.242** | 0.175* | 0.203*** | |
| Monetary policy regime | t−1 | −0.370* | −0.346* | −0.386* | −0.427*** | ||
| Indirect structural measures | |||||||
| Days lost to labour disputes | t | 0.0010 | 0.0009 | 0.0013* | 0.0009 | −0.0003 | |
| Openness | t | 0.007 | 0.012 | −0.013 | −0.003 | ||
| Financial liberalisation | t | 0.007 | 0.008 | 0.008 | 0.009* | −0.001 | 0.003 |
| Inflation volatility | t | 0.184*** | 0.185** | ||||
| Fiscal policy volatility | t | 0.068 | |||||
| Other | |||||||
| Oil price volatility | t | −0.001 | −0.002 | −0.019*** | |||
| Numbers of observations | 100 | 100 | 90 | 100 | 120 | 380 | |
| R2 within(d) | 0.198 | 0.192 | 0.228 | 0.223 | 0.168 | 0.193 | |
|
Notes: ***, **, and * indicate that coefficients are significant at the 1, 5 and
10 per cent levels, respectively, using robust standard errors. (a) Fiscal policy data are unavailable for New Zealand and Switzerland, which are excluded from this regression. (b) Regression starts in 1978. (c) Uses annual data and 7-year rolling windows to calculate volatility measures. Other data are annual, with the PMR index interpolated. (d) The R2 within does not take account of the explanatory power from the constant; the adjusted R2 for Model 1a is 0.212. |
|||||||
Point estimates imply that the average decline in the PMR index (from 5.1 to 2.8; Table 1) from 1978 to 1998 was associated with a decline in output volatility (from 1983 to 2003) of almost 0.5 of a percentage point, and that a move to a stricter monetary policy regime was associated with a decline in output volatility of about 0.4 of a percentage point.[13] Though statistically insignificant, the point estimate for financial liberalisation implies that the average rise in the ratio of credit to GDP (of 42 percentage points) was associated with a rise in output volatility of about 0.3 of a percentage point. Actual average output volatility declined by 0.5 of a percentage point.
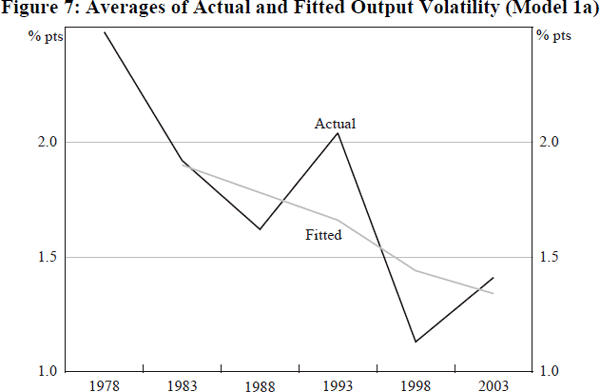
Figure 7 illustrates that the Model 1a regression appears to explain much of the trend decline in output volatility; but clearly does not capture all of the short-term fluctuations in output volatility. This residual volatility appears to reflect a common global business cycle, with output volatility typically relatively high in the five years ending 1983, 1993 and 2003 (coinciding with global recessions) compared with the five years ending 1988 and 1998 (which were periods of extended global expansions). Including the lagged level of output volatility in the model (results not reported) soaks up some, but not all, of this autocorrelation, without changing other coefficient estimates significantly. (Results from using individual time dummy variables are discussed in Section 4.2.)
Model 2 shows the results of controlling for possible changes in the behaviour of fiscal policy, as measured by the volatility of the cyclically-adjusted fiscal balance (as a ratio to GDP). The coefficient on this variable is positive, but insignificant. Results for the other coefficients are essentially unchanged with respect to Model 1a, although that on days lost to labour disputes is now significant.
Replacing the lagged monetary policy regime dummy variable with the contemporaneous measure of inflation volatility provides a slightly better fit of the data (Model 3 versus Model 1b). While this does not substantially alter the coefficient estimates for other variables, the coefficient on financial liberalisation is now significant at the 10 per cent level. The positive sign on the financial liberalisation coefficient contrasts with the findings of Barrell and Gottschalk (2004), but its significance is not robust to the exclusion of some countries from the regression (Finland, in particular) possibly reflecting a link between significant financial system instability and output volatility for some periods in these countries. Model 3 estimates suggest that the decline in average inflation volatility of 2 percentage points from 1983 to 2003 was associated with a decline in output volatility of about 0.4 of a percentage point.[14]
Model 4 uses a set of explanators close to that used by Barrell and Gottschalk (2004). We find that the coefficients on our measures of openness and financial liberalisation have the same sign as their results, but are statistically insignificant. This appears, in part, to reflect our use of data in five-year blocks; openness is significant in regressions based on rolling windows over annual data (see below), though only when excluding the direct measure of product market regulations (results not reported).
We test the robustness of our results to specifying our dependent variable in terms of a rolling standard deviation, in line with Blanchard and Simon (2001) and Barrell and Gottschalk (2004). To overcome our product market regulation variable being available only every five years, we use a linear interpolation to construct data at an annual frequency. Also, because annual data allow greater choice of window length over which to calculate standard deviations, we choose a length of seven years to better smooth through the business cycle. One drawback of using rolling standard deviations, however, is that we specifically introduce persistence into our regression, causing moving average errors. In this case, panel estimation using ordinary least squares is not appropriate because the assumption of independent errors is violated. However, the similarity of the results of Barrell and Gottschalk (2004) (who correct for this in their estimates) and Blanchard and Simon (2001) (who do not) suggests that a correction for moving average errors would not affect the results significantly.
Results using annual data are shown in Table 4 as Model 5. The encouraging finding, when comparing Models 1a and 5, is the similarity of the coefficient estimates for the direct structural measures – product market regulations and the monetary policy regime dummy. One odd result is that the coefficient on oil price volatility is significantly negative, which would imply that output volatility declines as oil price volatility rises. While oil price volatility is included to account for large supply-side shocks, over our sample the volatility of oil prices has been quite low and fairly stable compared with the levels of the 1970s.
Finally, one possibility worth considering is that the model should be specified in logarithmic form. Most of the coefficient estimates (not reported) from a fully specified logarithmic model are of the same sign as in Model 1a (the exceptions are oil price volatility and openness). Only the coefficient on financial liberalisation is significant.
4.2 Controlling for Common Shocks/Trends
The range of model results above points to a fairly consistent relationship between a country's output volatility and both the extent of its product market regulation and nature of its monetary policy regime. Although the estimation technique used above is fairly standard, it fails to account for possible changes in the magnitude of common shocks over time. A number of studies that attempt to estimate common shocks directly suggest that these have declined over time, and this is certainly consistent with the trend decline in output volatility evident in 14 of the 20 countries in our sample.[15] Failing to account for a trend decline in the size of global shocks could lead to spurious estimates of the coefficients of the trending explanatory variables we examine, including PMR and the monetary policy regime variables. While the oil price volatility variable can capture some global shocks, there are no doubt other significant supply and demand shocks which are not taken into account. Without loss of generality, the unexplained innovation to output volatility (from Equation 1) can be written in the following form:

where: κt is the common innovation, not already captured by other explanatory variables; and ηit is country-specific.
One way of dealing with trends in common innovations, κt, is to assume that they follow a linear time trend. Results of adding a time trend to the basic regression are shown as Models 6a, 6b and 6c in Table 5 (Models 1a and 1b are also shown for comparison). Model 6a shows that adding a time trend does not change the size of the coefficients on either the PMR or monetary policy regime variables, although the former becomes statistically insignificant (also true of the trend). Model 6b shows that the trend is significant when the PMR variable is removed, though the fit of the model is not as good as that of the basic parsimonious Model 1b. Also, the trend is not significant in the presence of the PMR variable, even when the monetary policy regime dummy variable is removed (Model 6c). In short, the PMR and monetary policy regime variables appear relatively robust to controlling for common trends by means of a time trend.
| Variables | Period | Model | |||||||||
|---|---|---|---|---|---|---|---|---|---|---|---|
| Basic | Time trend | Time dummies | Good luck dummy | ||||||||
| 1a | 1b | 6a | 6b | 6c | 7a | 7b | 8 | ||||
| Direct structural measures | |||||||||||
| Product market regulations | t−1 | 0.220** | 0.202* | 0.182 | 0.208 | 0.141 | 0.126 | 0.202* | |||
| Monetary policy regime | t−1 | −0.370* | −0.346* | −0.340* | −0.366* | −0.213 | −0.334* | ||||
| Indirect structural measures | |||||||||||
| Days lost to labour disputes | t | 0.0010 | 0.0009 | 0.0009 | 0.0008 | 0.0011 | 0.0012* | 0.0013* | 0.0009 | ||
| Openness | t | 0.007 | |||||||||
| Financial liberalisation | t | 0.007 | 0.008 | 0.008 | 0.007 | 0.008 | 0.005 | 0.006 | 0.008* | ||
| Inflation volatility | t | 0.159*** | |||||||||
| Other | |||||||||||
| Oil price volatility | t | −0.001 | |||||||||
| Time trend | −0.019 | −0.117* | −0.049 | ||||||||
| Good luck dummy | −0.046 | ||||||||||
| Time dummies | No | No | No | No | No | Yes | Yes | No | |||
| Number of observations | 100 | 100 | 100 | 100 | 100 | 100 | 100 | 100 | |||
| R2 within | 0.198 | 0.192 | 0.193 | 0.179 | 0.167 | 0.330 | 0.359 | 0.193 | |||
| Note: ***, **, and * indicate that coefficients are significant at the 1, 5 and 10 per cent levels, respectively, using robust standard errors. | |||||||||||
The common innovations, κt, could instead be accounted for by adding time dummies to the basic regression (this could also help to account for the apparent global business cycle effect apparent in Figure 7). As shown in Model 7a, adding time dummies does not alter the magnitude of other coefficient estimates substantially, although most variables are statistically insignificant (including the time dummies themselves). This is not so surprising since a time trend by itself leaves the PMR variable insignificant, and the individual time dummies will better match the behaviour of the monetary policy regime dummy variables.[16] While both the product market regulations and monetary policy regime variables tend to behave in a similar fashion across a number of countries over time, this happens not to be the case for days lost to labour market disputes, which is now significant.
The point estimate suggests that the average decline in days lost to labour market disputes (from 252 to 47 days per thousand employed) implies a contribution to the decline in output volatility of 0.3 of a percentage point over the sample. Similarly, inflation volatility, which displays greater variation across countries than the monetary policy regime dummy variable, is significant in the presence of individual time dummies (Model 7b).
To the extent that the general decline in output volatility might be due to good luck, it is not clear that this is best captured by a linear trend, or by the time dummies. A third alternative is to include a dummy variable that could better capture the possibility of countries experiencing global good luck in the latter part of the sample period. Including a single step dummy (with a value of zero for 1983 and one thereafter) leaves all other coefficient estimates largely unchanged, with the PMR and monetary policy regime variables statistically significant. The ‘good luck’ dummy variable is itself statistically insignificant (Model 8).[17] [18]
It appears that the time trend, time dummies and the good luck dummy variable are not especially satisfactory means of modelling common innovations, κt. The problem is that while they may capture common innovations, they can also capture common trends in output volatility that are the result of common structural changes. An alternative is to attempt to remove trends in common innovations (unrelated to structural change) by examining relative changes in output volatility across countries – that is, by measuring both left- and right-hand-side variables relative to a control country or group of countries. One option is to use the average experience of the full sample of countries as the control. However, this is equivalent to using time dummies (as in Models 7a and 7b).
An alternative is to use a single country as a control for common innovations. The US has been consistently cited in the business cycle literature and elsewhere as acting as a ‘locomotive’ for the rest of the world (Canova and Dellas 1993, and Canova and Marrinan 1998).[19] In this case the specification would be:

where: ‘tilde’ represents the difference between country i's observation and the equivalent observation for the US, and
 .
Estimates for this equation are shown in Table 6 as Model 9. Both PMR and monetary
policy regime variables are statistically significant even when controlling
for common innovations in this
way (results are robust to the exclusion of individual countries from
the
regression).[20]
The significance of these coefficients (in contrast to the results for Models
7a and 7b, which use time dummies) derives from the fact that the pattern of
behaviour for a number of variables for the US differed from the somewhat common
pattern for many other countries. This is most obvious for the PMR variable,
which in the US declined in a relatively consistent fashion throughout the
sample period, whereas for many other countries the decline lagged the US initially,
but subsequently declined more rapidly in the second half of the sample (Table
1 and Figure B1 in Appendix B). This difference
is also mirrored in the path of output volatility, explaining why the PMR appears
to be a better fit of the data than a linear time trend.
.
Estimates for this equation are shown in Table 6 as Model 9. Both PMR and monetary
policy regime variables are statistically significant even when controlling
for common innovations in this
way (results are robust to the exclusion of individual countries from
the
regression).[20]
The significance of these coefficients (in contrast to the results for Models
7a and 7b, which use time dummies) derives from the fact that the pattern of
behaviour for a number of variables for the US differed from the somewhat common
pattern for many other countries. This is most obvious for the PMR variable,
which in the US declined in a relatively consistent fashion throughout the
sample period, whereas for many other countries the decline lagged the US initially,
but subsequently declined more rapidly in the second half of the sample (Table
1 and Figure B1 in Appendix B). This difference
is also mirrored in the path of output volatility, explaining why the PMR appears
to be a better fit of the data than a linear time trend.
| Variables | Period | Model | |
|---|---|---|---|
| Basic | US is the control | ||
| 1a | 9 | ||
| Direct structural measures | |||
| Product market regulations | t−1 | 0.220** | 0.498*** |
| Monetary policy regime | t−1 | −0.370* | −0.509*** |
| Indirect structural measures | |||
| Days lost to labour disputes | t | 0.0010 | 0.0005 |
| Openness | t | 0.007 | 0.008 |
| Financial liberalisation | t | 0.007 | 0.010* |
| Other | |||
| Oil price volatility | t | −0.001 | |
| Number of observations | 100 | 95 | |
| R2 within | 0.198 | 0.298 | |
| Note: ***, **, and * indicate that coefficients are significant at the 1, 5 and 10 per cent levels, respectively, using robust standard errors. | |||
Footnotes
The cross-country average change in the monetary policy regime dummy was 0.75 from 1978 to 1998, given that some countries were always in the stricter monetary policy regime, while Italy and Norway were still not in the strict regime in 1998. [13]
Model 3 is likely to suffer from endogeneity between inflation and output volatility, which would tend to bias the coefficient estimate on inflation volatility. One solution is to use instrumental variables estimation. The results (not reported) suggest a slightly higher coefficient on inflation volatility (0.34) and a lower coefficient estimate on PMR (0.10) but these variables are no longer statistically significant. Other coefficient estimates are largely unchanged. [14]
Those countries with the highest output volatility in 1983 also experienced a larger decline in output volatility. At first glance this might suggest convergence of output volatility. However, closer inspection shows this is not the case, with seven countries moving from above to below average volatility, and seven moving from below to above average from 1983 to 2003. [15]
This matching of the time dummies and monetary policy is exaggerated with the use of five-year block data. Using annual data as per Model 5, but with time dummies added, leaves the monetary policy dummy variable significant (results not reported). [16]
A similar result holds for a good luck dummy variable beginning instead in 1993. In this case the coefficient estimate on the good luck dummy is positive (though insignificant), apparently reflecting the fact that this captures two business cycle downturns in 1993 and 2003 and only one business cycle upturn in 1998. [17]
It is not necessary to assume that the timing of this was coincident across all countries. We could allow for a once-off shift to a period of good luck for each country coinciding with the break dates estimated by Cecchetti, Flores-Lagunes and Krause (2005). Again, using this good luck dummy variable does not alter our basic results; the coefficient estimate on this dummy variable is positive (though insignificant). [18]
Other large economies, such as Germany and Japan, had significant idiosyncratic shocks affecting their output volatility in the 1990s (that is, the effect of re-unification for Germany, and bursting of the asset-price bubble in Japan) making them less appealing as controls. [19]
Also, the coefficient on the measure of financial liberalisation is positive and statistically significant, though as before, this appears to be driven by a few countries that have experienced a period of substantial financial system instability, including Finland and Japan. [20]