RDP 2005-08: Declining Output Volatility: What Role for Structural Change? 2. Explanations for Declining Output Volatility
October 2005
This section considers the mechanisms that could link output volatility to changes in monetary and fiscal policy, structural reforms in labour and product markets, and changes in the composition and behaviour of components of GDP. It also takes a preliminary look at some relevant trends in the data for 20 OECD countries (hereafter referred to simply as OECD countries) from the late 1970s to 2003.
2.1 Monetary and Fiscal Policy
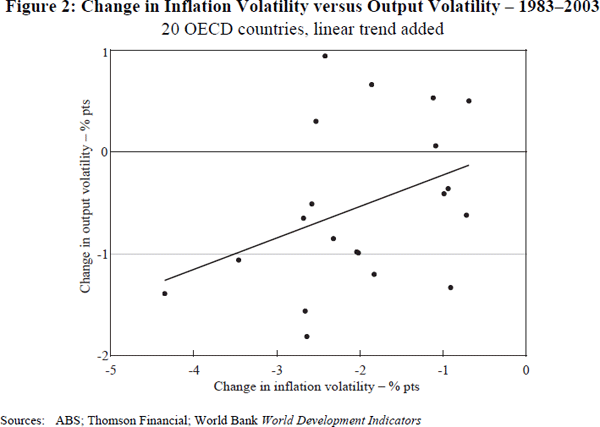
The rise of monetary and fiscal policies as stabilisation tools in the post-World War II era was one of the earliest, and still prominent, reasons cited for the decline in output volatility in a number of countries. Blanchard and Simon (2001) and Romer (1999) find that monetary policy rather than fiscal policy has made the larger contribution to stabilising economic downturns. One explanation for this is that monetary authorities have actively counteracted some post-war shocks, such as the 1987 stock market crash, while fiscal policy, though effective, has had a more passive role (largely through the operation of the automatic stabilisers) in moderating business cycle fluctuations. The tendency across many countries in the past couple of decades for greater central bank independence and the adoption of monetary policy regimes that are stricter on inflation appears to have resulted in the widespread decline in inflation volatility. This is consistent with a reduction in the volatility of output in the case of demand shocks, since these push output and inflation in the same direction. And while supply shocks push inflation and output in opposite directions, output volatility may still decline under a more credible monetary policy regime if it helps to better anchor inflationary expectations. A number of papers using panel data have established a close link between the decline in inflation volatility and output volatility (Barrell and Gottschalk 2004, and Blanchard and Simon 2001, for example). This is readily apparent in our sample of OECD countries (Figure 2; summary statistics by country are available in Table 1 and in Figure B1 in Appendix B).[3] Interpreting this to imply causation is, however, made difficult by the problem of endogeneity, as inflation and output volatility are likely to be affected by common shocks. Hence, we argue that there is a need to capture changes in monetary policy regimes with a more direct measure that is not likely to be affected by output volatility (see Section 3).
| GDP volatility(a) | Product market regulation(b) | Monetary policy regime(c) | Inflation volatility(d) | Days lost to labour disputes(e) | Openness(f) | Financial liberalisation (g) |
Oil price volatility(h) | Government balance volatility(i) | GDP less change in inventory volatility(a) | |||||||||||||||||||||||||||
|---|---|---|---|---|---|---|---|---|---|---|---|---|---|---|---|---|---|---|---|---|---|---|---|---|---|---|---|---|---|---|---|---|---|---|---|---|
| 1978 | 1983 | 2003 | 1978 | 1998 | Strict inflation regime | 1978 | 1983 | 2003 | 1978 | 1983 | 2003 | 1978 | 1983 | 2003 | 1978 | 1983 | 2003 | 1978 | 1983 | 2003 | 1978 | 1983 | 2003 | 1978 | 1983 | 2003 | ||||||||||
| Australia | 1.0 | 2.4 | 0.6 | 4.5 | 1.6 | 1993– | 3.0 | 2.9 | 0.3 | 580 | 481 | 49 | 29 | 32 | 42 | 45 | 53 | 117 | 1.2 | 0.4 | 1.1 | 2.6 | 1.9 | 0.7 | ||||||||||||
| Austria | 2.8 | 1.9 | 1.2 | 5.2 | 3.2 | 1995– | 2.4 | 1.5 | 0.8 | 1 | 1 | 65 | 64 | 72 | 100 | 58 | 75 | 104 | 1.4 | 0.8 | 1.2 | 1.2 | 0.8 | 1.4 | ||||||||||||
| Belgium | 2.8 | 1.9 | 1.4 | 5.5 | 3.1 | 1979– | 3.6 | 1.6 | 0.6 | 197 | 109 | 15 | 110 | 127 | 161 | 24 | 29 | 78 | 0.7 | 2.2 | 0.3 | 1.7 | 1.2 | 1.5 | ||||||||||||
| Canada | 1.2 | 2.7 | 1.7 | 4.2 | 2.4 | 1992– | 1.6 | 2.5 | 0.4 | 853 | 651 | 146 | 47 | 51 | 80 | 96 | 105 | 139 | 2.0 | 1.2 | 1.6 | 2.6 | 3.3 | 1.7 | ||||||||||||
| Denmark | 3.3 | 2.2 | 1.0 | 5.6 | 2.9 | 1979– | 2.5 | 2.1 | 0.3 | 72 | 98 | 39 | 60 | 68 | 80 | 159 | 134 | 139 | 2.0 | 1.4 | 0.8 | 2.6 | 1.9 | 1.1 | ||||||||||||
| Finland | 1.3 | 1.9 | 1.5 | 5.6 | 2.6 | 1994– | 3.9 | 2.0 | 1.0 | 400 | 294 | 41 | 53 | 61 | 70 | 45 | 43 | 58 | 1.6 | 1.2 | 1.6 | 2.0 | 0.6 | 1.3 | ||||||||||||
| France | 1.7 | 0.9 | 1.5 | 6.0 | 3.9 | 1979– | 1.9 | 1.7 | 0.6 | 167 | 101 | 77 | 32 | 36 | 43 | 49 | 70 | 73 | 0.7 | 0.7 | 1.0 | 0.8 | 0.6 | 1.4 | ||||||||||||
| Germany | 2.6 | 1.9 | 1.3 | 5.2 | 2.4 | Always strict | 1.7 | 3.1 | 0.5 | 48 | 6 | 3 | 38 | 43 | 55 | 66 | 75 | 119 | 0.9 | 1.9 | 1.0 | 2.0 | 1.6 | 1.6 | ||||||||||||
| Ireland | 2.7 | 2.1 | 3.1 | 5.7 | 4.0 | 1979– | 5.1 | 4.0 | 1.5 | 487 | 526 | 58 | 96 | 104 | 170 | 27 | 36 | 110 | – | 2.8 | 2.1 | 4.8 | 2.5 | 3.6 | ||||||||||||
| Italy | 3.3 | 2.0 | 1.2 | 5.8 | 4.3 | 1979–1992; 1999 | 2.7 | 2.8 | 0.4 | 993 | 848 | 90 | 44 | 46 | 53 | 81 | 62 | 79 | 1.2 | 2.0 | 0.8 | 1.1 | 1.8 | 1.8 | ||||||||||||
| Japan | 2.5 | 2.1 | 1.1 | 5.2 | 2.9 | Always strict | 7.2 | 2.3 | 0.3 | 91 | 13 | 1 | 25 | 27 | 20 | 85 | 87 | 110 | 1.3 | 1.0 | 0.6 | 2.9 | 1.3 | 0.9 | ||||||||||||
| Netherlands | 1.9 | 1.5 | 2.0 | 5.3 | 3.0 | 1979– | 2.6 | 1.7 | 1.0 | 10 | 24 | 11 | 96 | 106 | 122 | 41 | 58 | 143 | – | 1.5 | 0.8 | 0.6 | 1.2 | 2.2 | ||||||||||||
| New Zealand | 3.7 | 1.5 | 0.8 | 5.1 | 1.4 | 1990– | 2.2 | 3.9 | 1.2 | 229 | 241 | 16 | 54 | 60 | 64 | 18 | 21 | 121 | – | – | 0.6 | 4.0 | 2.7 | 0.8 | ||||||||||||
| Norway | 1.4 | 2.6 | 1.1 | 5.0 | 2.5 | 2000– | 1.3 | 3.4 | 0.7 | 64 | 44 | 58 | 78 | 78 | 72 | 53 | 52 | 100 | – | 1.0 | 2.2 | 1.4 | 2.8 | 1.1 | ||||||||||||
| Portugal | 4.4 | 1.8 | 2.1 | 5.9 | 4.1 | 1992– | 4.2 | 3.3 | 0.8 | 128 | 145 | 12 | 50 | 64 | 70 | 77 | 80 | 141 | 2.3 | 2.9 | 1.3 | 0.8 | 0.8 | 2.1 | ||||||||||||
| Spain | 2.0 | 2.3 | 1.0 | 4.7 | 3.2 | 1989– | 3.5 | 1.4 | 0.5 | 705 | 629 | 162 | 30 | 35 | 59 | 80 | 78 | 105 | – | 1.0 | 0.5 | 1.6 | 0.9 | 1.0 | ||||||||||||
| Sweden | 1.8 | 1.0 | 1.7 | 4.5 | 2.2 | 1995– | 0.7 | 2.7 | 0.8 | 30 | 225 | 34 | 55 | 61 | 83 | 40 | 40 | 44 | – | 1.2 | 1.7 | 0.7 | 0.7 | 1.7 | ||||||||||||
| Switzerland | 3.8 | 1.4 | 1.5 | 4.5 | 3.9 | Always strict | 3.9 | 1.5 | 0.4 | 2 | 1 | 3 | 62 | 69 | 82 | 89 | 115 | 160 | – | – | – | 3.2 | 1.9 | 1.5 | ||||||||||||
| UK | 2.1 | 2.2 | 0.8 | 4.3 | 1.0 | 1990– | 5.7 | 5.0 | 0.7 | 351 | 441 | 22 | 43 | 41 | 41 | 43 | 48 | 117 | 0.7 | 1.8 | 2.3 | 1.4 | 1.9 | 0.8 | ||||||||||||
| US | 3.0 | 2.5 | 1.5 | 4.0 | 1.4 | 1979– | 2.1 | 4.1 | 0.7 | 396 | 170 | 41 | 17 | 19 | 24 | 99 | 103 | 143 | 1.2 | 0.8 | 2.8 | 2.6 | 2.2 | 1.4 | ||||||||||||
| Average | 2.5 | 1.9 | 1.4 | 5.1 | 2.8 | 3.1 | 2.7 | 0.7 | 290 | 252 | 47 | 54 | 60 | 75 | 64 | 68 | 110 | 113.6 | 57.5 | 28.1 | 1.3 | 1.4 | 1.3 | 2.1 | 1.6 | 1.5 | ||||||||||
|
Notes: Annual data from 1973 to 2003. Standard deviations and averages are taken
over 5-year periods ending in the dates shown. Sources: See Appendix B |
||||||||||||||||||||||||||||||||||||
In principle, discretionary fiscal policy can be an effective tool for aggregate demand management if government spending and taxes are sizeable enough that modest variations may work to offset other cyclical impulses. In practice, fiscal policy may not move quickly enough to be countercyclical, and timing difficulties could actually lead fiscal policies to exacerbate output fluctuations. Perotti (2005), using structural VAR models for Australia, Canada, Germany, the UK and the US, finds that the magnitude of fiscal shocks declined around the early 1980s and that the transmission of these shocks has become more muted over time.
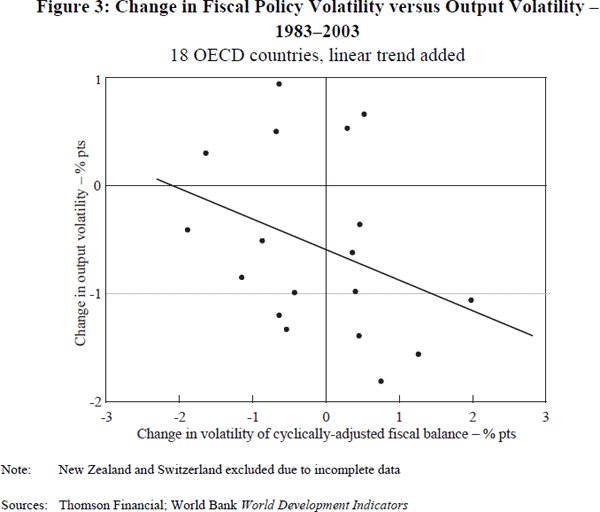
For OECD countries (on average and across countries) the relative size of the public sector (measured, for example, by public consumption as a share of GDP) has been generally stable since the late 1970s (at around 20 per cent). The volatility of discretionary policy (measured by the cyclically-adjusted fiscal balance, as a share of GDP) has not changed significantly over this period, although it has tended to rise in those countries which experienced larger declines in output volatility (Table 1 and Figure 3). However, interpreting this to imply something about causation is difficult; output volatility may have fallen in these countries due in part to more active discretionary fiscal policy working to dampen other cyclical influences, or in spite of it. Nevertheless, such a measure may provide a useful control for regression analysis.
Romer (1999) concludes that non-discretionary fiscal policy has played the larger role in moderating the fluctuations of business cycles, consistent with the post-war growth of a number of automatic stabilisers, including income tax, unemployment compensation and welfare programs. While this may be true, it would be difficult to establish without the aid of a structural model to identify shocks. Changes in the volatility of the non-discretionary fiscal balance (as a ratio to GDP) show no clear long-run trend across countries in our sample.[4]
2.2 Change in the Composition and Behaviour of GDP Components
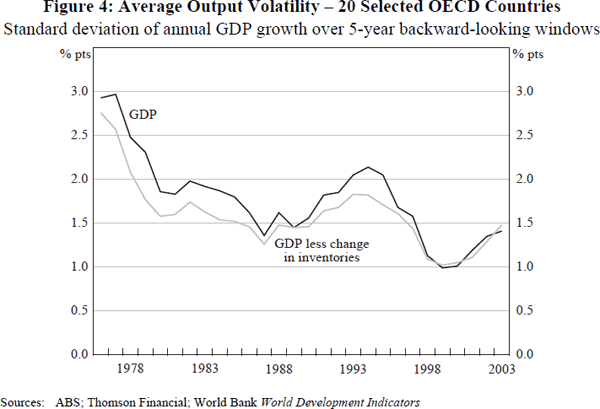
It is possible that firms have become more adept at managing demand shocks and that this has played an important role in reducing the volatility of output growth. In particular, it has been argued that improvements in information technology have helped firms to sharpen their inventory management, resulting in less pronounced swings in production and output (Dalsgaard, Elmeskov and Park 2002 and McConnell, Mosser and Perez-Quiros 1999). Kahn, McConnell and Perez-Quiros (2002) argue that the clear downward trend in the US inventory-to-sales ratio from the mid 1980s (after being steady since the 1950s) is attributable to improved inventory management techniques dating from the late 1970s and early 1980s, such as the adoption of flexible manufacturing systems and just-in-time inventory management. However, for Japan the decline in the inventory-to-sales ratio is a more recent phenomenon, while Khan and Thomas (2004) show that just-in-time methods have little effect on output volatility. Moreover, while supply-side factors may have played a role in the declining volatility of inventories, changes in the nature of demand may have also played a role. For example, more stable consumption would facilitate a reduction in the inventory-to-sales ratio and reduce the volatility of inventories. Hence, the role of improved inventory management in explaining the decline in output volatility is not entirely convincing (Sill 2004). On average across OECD countries, the decline in the volatility of GDP less the change in inventories is only slightly less than the decline in the volatility of GDP (Figure 4), and indeed for some countries, GDP less the change in inventories is actually more volatile than GDP itself (Table 1).
The shift away from the more volatile manufacturing sector and towards the service sector has also been suggested as an explanation for lower output volatility in developed economies (Dalsgaard et al 2002). However, this process has been underway since at least the 1950s and again it is unclear that it lines up with the timing of the shift to greater stability of the overall economy. Indeed, Blanchard and Simon (2001) find that changes in composition have not played an important role in the decline in output volatility; while the composition of output has changed over time, the effects have largely cancelled each other out.[5]
We do not directly deal with these possibilities in this paper. First, data limitations make it difficult to reliably remove the effect of changes in inventories from GDP across all of the countries in our sample. Second, many of the factors commonly cited as driving the reduction in volatility of consumption and investment (particularly of inventories) may be captured by our explanatory variables.[6] And third, compositional and behavioural changes in the components of GDP that are driven by global changes in technology and preferences will be accounted for when we control for possible common trends in the data in Section 4.2.
2.3 Product and Labour Market Reforms
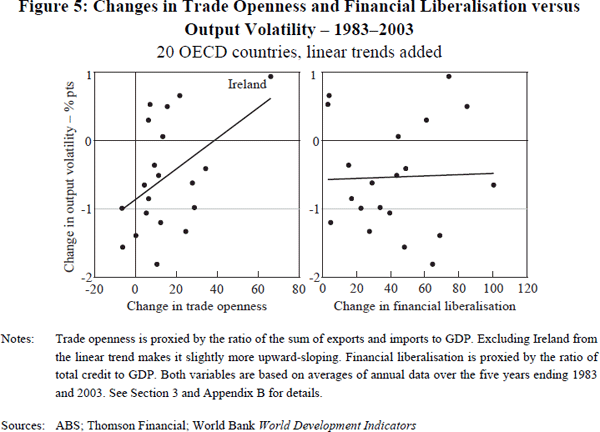
The effect of a range of different types of market reforms on output volatility has been considered in the literature, though in a somewhat piecemeal approach, and largely ignoring labour market reforms. In the case of financial market reforms (typically proxied by measures of financial deepening), one hypothesis is that greater liquidity allows households and businesses to better smooth their consumption and investment in response to income shocks. Working in the other direction, however, financial sector reforms could initially be associated with significant financial system instability and higher output volatility. Similarly, increased international integration of both goods and financial markets can provide diversification benefits, but at the same time it can also encourage greater specialisation in production, with greater exposure to sector-specific shocks; the net effect on output volatility in any given country is not clear. Empirical findings based on measures of international integration and financial system depth are mixed. Barrell and Gottschalk (2004) find that greater openness to trade and deeper financial systems are associated with lower output volatility, while Buch, Döpke and Pierdzioch (2002) and Easterly, Islam and Stiglitz (2001) find no such relationships, or unstable ones at best. Across OECD countries, there appears to be a positive relationship between changes in trade openness and output volatility over the past 20 years – that is, countries that became more open experienced a smaller decline in output volatility (Figure 5 and Table 1). There does not appear to be any consistent relationship between trend changes in the extent of financial liberalisation and output volatility.
One aspect of market reforms that has been somewhat overlooked is the combined effect of broad-based product and labour market reforms on an economy's responsiveness to shocks. Aggregate output volatility could fall if reforms encourage more efficient reallocation of resources across sectors and across firms in response to sector- and firm-specific shocks. Consistent with these, Comin and Philippon (2005) present evidence that firm-level volatility is positively related to product market competition, and link this to a decline in the volatility of aggregate output. However, it is also possible that significant reforms could raise output volatility in the short-run as productive resources are dislocated from previously protected industries/firms, and take time to shift into more productive uses (OECD 1997).
Reforms can encourage greater movement of resources across sectors/firms in a number of ways. Labour market reforms can reduce hiring and firing costs, including by allowing for more flexible work arrangements. They can also lead to increased wage flexibility, providing stronger market signals prompting labour to be allocated to its most productive use. Similarly, product market reforms can lead to price signals that better reflect profitable opportunities. In these ways, resources receive stronger signals of, and are better able to move in response to, shocks, allowing for greater dynamic efficiency. The global decline in the level and volatility of inflation potentially reinforces this effect by making relative price changes more apparent (Bernanke 2004).
Although shocks leading to cycles in activity will often be of an economy-wide nature, they will still encompass idiosyncratic elements. Consider a large negative aggregate shock, but with differential impacts across sectors. In a world with very limited (short-term) mobility of factors of production, those sectors suffering a relatively large negative shock will be left with a relative surplus of productive factors. If factors of production are able to move from less productive to more productive parts of the economy, the effects of the aggregate shock could be mitigated and output might not fall so far. Similarly, during a positive aggregate shock, output could be higher if resources moved to those areas benefiting from relatively larger gains in productivity and/or demand. Overall, flexibility can lead to a decline in aggregate output volatility if the gains of shifting resources during a downturn are larger than the gains of shifting resources during an upturn. This is possible in the case of decreasing aggregate returns to the mobile factors of production, as illustrated in a simple model presented in Appendix A.
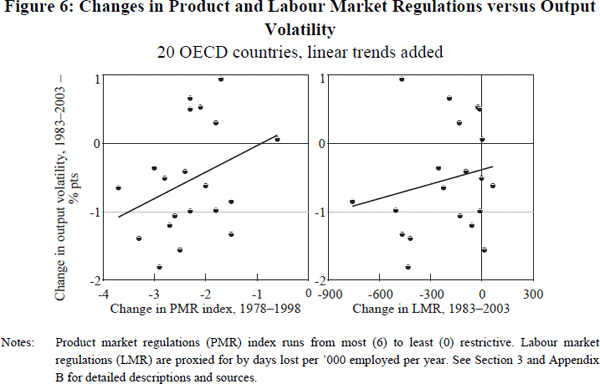
Whether output volatility falls in response to more liberalised markets remains an empirical question. A glance at the data suggests that it is plausible: countries that undertook more sizeable product and labour market reforms experienced larger declines in GDP volatility over the past 25 years (Figure 6 and Table 1).
Footnotes
See Section 3 for a description of the calculations underpinning this and other scatter plots. The start and end dates correspond to those used in the regression analysis later in the paper. [3]
The non-discretionary fiscal balance (as a ratio to GDP) is measured as the difference between the primary fiscal balance and the cyclically-adjusted primary balance. [4]
The real share of the goods sector in total value added – which tends to decline over time for most countries – was included in the regression analysis of Section 4 (results not reported). However, the coefficient on this variable was negative and statistically insignificant, and may have reflected a spurious trend; studies which focus on this factor suggest, if anything, the opposite sign (Maccini and Pagan 2005). [5]
For example, Kolev (2005) proposes that a relaxation of credit constraints reduces the value of inventories as a source of collateral. [6]