RDP 2002-02: Australian Use of Information Technology and its Contribution to Growth 1. Introduction
January 2002
- Download the Paper 187KB
During the stock market volatility of 1999 and 2000 much was made of whether certain economies were ‘new economy’ or ‘old economy’. ‘New economy’ countries were those that had a significant high-tech production sector, ‘old economy’ countries were the rest. In the hype surrounding the ‘new economy’ stock returns for high-tech firms soared.[1] Consequently, the stock markets of ‘new economy’ countries soared while ‘old economy’ stock markets delivered more pedestrian returns. It was generally assumed that stock market returns reflected the productivity of the broader economy and that high-tech production was delivering big productivity gains to certain countries while ‘old economy’ countries were largely being left behind. As the events since April 2000 demonstrate, however, equating stock market performance with real economy performance can be dangerous in the presence of an asset price bubble.
Australia, as an economy that was unequivocally dubbed ‘old economy’, makes an interesting case study. Australia does not have many specifically high-technology firms. Furthermore, Australian manufacturing of high-tech products is limited. Notwithstanding this, Australia is amongst the world's heaviest users of high-tech products. The use of new consumer electronic devices, most notably mobile phones, is high by world standards. The following two figures highlight these aspects of high technology in Australia. Figure 1 illustrates the imbalance between production and consumption, while Figure 2 compares Australian use of IT with the rest of the world.
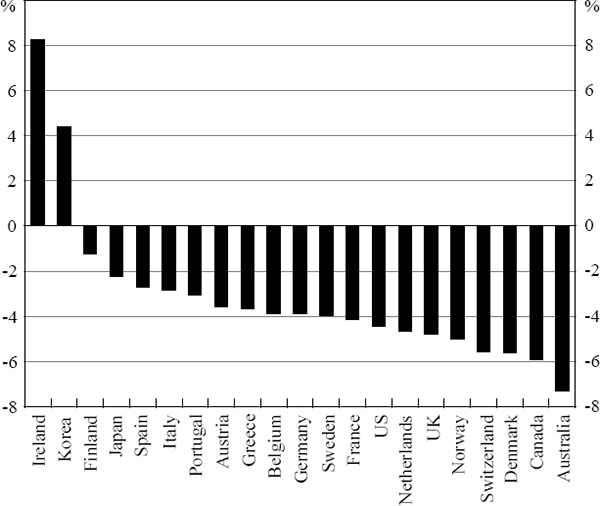
Notes: Data collected by International Data Corporation and provided to the authors via the OECD. Similar data have been published in the 1998 World Information Technology and Services Alliance (WITSA) report ‘Digital Planet: The Global Information Economy’ and the October 2001 IMF World Economic Outlook.
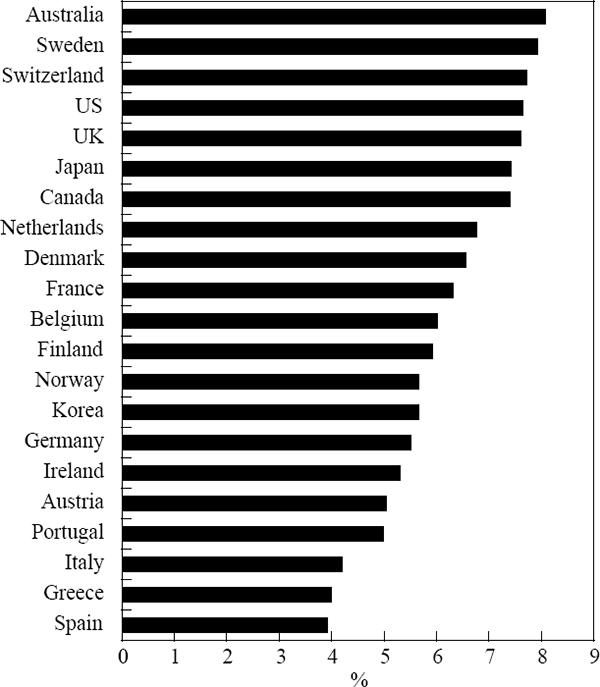
Note: As for Figure 1
The imbalance shown in Figure 1 has been a source of concern. If manufacturers and inventors of high-tech products capture much of the benefit from their products then Australia is largely missing out on the high-tech revolution. On the other hand, if users of high-technology goods capture much of the benefit, there are grounds for optimism. Australia, as one of the strongest adopters of IT, could also be one of the greatest beneficiaries from the high-tech revolution.
The view that users are large beneficiaries of the IT revolution has not enjoyed much currency. Nonetheless, a recent OECD report (OECD 2001) concluded that ‘The key to benefiting from ICT [Information and Communications Technology] is to focus on policies to foster its use, rather than its production’ – and it identified Australia as a country that had done exactly that.
In the hype surrounding the ‘new economy’ the distinction between simple production of a good and innovation was largely ignored. Production without associated gains in innovation, research and development has limited benefit. However, just as production may lead to greater innovation, so use of high technology may spur innovation. The difference is that the benefits to producers are likely to accrue within the industry while users may be more widely spread.
This paper looks at the historical gains from the use of information technology in Australia. Our analysis suggests that Australia has done well out of the ‘new economy’. However, while Australia has high overall use of computer technology, this is not evenly spread across industrial sectors. Figure 3 shows nominal investment as a percentage of gross value added (GVA) by sector for the financial years 1989/90 and 1999/2000.
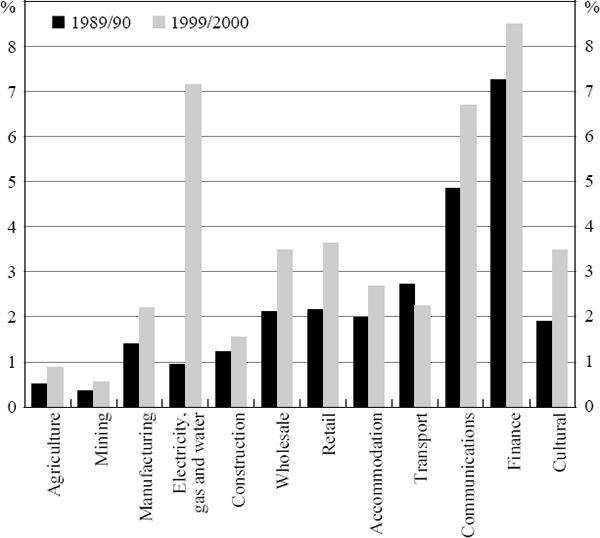
This dispersion reveals some interesting patterns. Traditional primary and secondary industries are not heavy direct users of information technology; instead service-based sectors have been the strongest adopters. Thus, the gains from information technology may not have been evenly distributed through the economy. We return to this issue when we discuss the industry results below.
The remainder of this paper is structured as follows. Section 2 provides a review of the previous literature before Section 3 discusses the relevant theory and some issues with the analysis. Section 4 discusses the data and other practical issues before Section 5 presents the results. Section 6 considers two interesting questions. The first, ‘What is the counterfactual?’ considers what would have happened if the computer industry had not been characterised by the rapid price falls that epitomise the industry. The second looks at whether there are any detectable spillovers from the use of IT to multifactor productivity (MFP) growth. Section 7 discusses the findings more generally and compares them with previous results before Section 8 concludes.
Footnote
Indeed, investors were so discerning that any company with a ‘dot com’ in its name did well. See Cooper, Dimitrov and Rau (1999) for details. [1]