RDP 2000-02: Forecasting Australian Economic Activity Using Leading Indicators Appendix D: Forecasting with the Gruen and Shuetrim Output Equation
April 2000
- Download the Paper 339KB
The version of the Gruen and Shuetrim (1994) (GS hereafter) output equation we consider is:

Where:
| yt | – Real GDP (chain linked series) |
| rt | – Real interest rate, defined as |
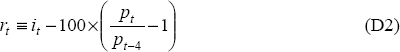
| it | – Unofficial cash rate (11am call) quarterly average for period 1979:Q3–1999:Q1. Prior to this, the Official cash rate is used. In contrast, GS (1994) uses the Official cash rate prior to 1982:Q3. |
| pt | – Treasury Underlying CPI |
| SOIt | – Southern Oscillation Index |
 |
– US Real GDP |
Estimating this equation over the sample 1980:Q1–1993:Q4, as in GS (1994), provides the coefficients presented below. It is expected that our results will differ to some extent from those in GS because of revisions to GDP, due to both standard revisions and the move to a chain linked series.[19]

The mean coefficient on the real interest rate is −0.023, which is very similar to the
result in GS, although the joint hypothesis that these coefficients are zero is not rejected.
The sum of the coefficients on the real interest rate is −0.112, again similar to GS's
results, and this sum is statistically significant. The coefficients on the domestic and foreign
output variables are also similar to those in GS and are all statistically significant. We do
not, however, obtain as good a fit as GS do for their estimated equation. Our results give an
 2 of 0.36 compared with GS's 2 of 0.47.
The sample periods used for estimating the GS equation in the forecasting exercises are explained in the text.
Footnote
Using archived data for domestic output does not substantially alter our results so we proceed as if we had the chain linked data prior to its availability. [19]