RDP 9405: External Debt and Liabilities of Industrial Countries 4. Summary Tables of External Assets and Liabilities
November 1994
- Download the Paper 562KB
This section contains summary statistics of the external assets and liabilities of industrial and selected developing countries. Both gross and net measures are presented.
4.1 External Debt
There is a wide range of variation in the gross indebtedness of the industrial countries in this sample. The least indebted countries (in gross terms) have external debt-to-GDP ratios of around 30 per cent, with the highest having a debt-to-GDP ratio in excess of 250 per cent (Figure 1 and Table 5). Australia's gross external debt-to-GDP ratio, at just over 50 per cent, is not unusually high by international standards, despite growing very rapidly in the 1980s. Many countries with high gross levels of external debt also have considerable holdings of external non-equity assets. Consequently, their net external debt is considerably lower than their gross indebtedness. Compared with the other countries in the sample, Australia has a very low level of external non-equity assets. Thus, while Australia's gross level of external debt is relatively low compared with other industrial countries, its net indebtedness is relatively high (Figure 1 and Table 6). Australia is among a group of nine industrial countries that has net external debt in excess of 30 per cent of GDP.
| Rank | Debt | Non-Equity Assets | ||
|---|---|---|---|---|
| 1 | Belgium-Luxembourg | 266.8 | Belgium-Luxembourg | 342.2 |
| 2 | Denmark | 113.2 | Switzerland | 199.3 |
| 3 | Ireland | 108.7 | Netherlands | 101.3 |
| 4 | Sweden | 104.8 | Denmark | 78.6 |
| 5 | Finland | 104.0 | Ireland | 64.6 |
| 6 | Switzerland | 92.0 | Germany | 63.0 |
| 7 | Netherlands | 88.0 | Austria | 60.2 |
| 8 | Iceland | 72.9 | France | 58.4 |
| 9 | Greece | 70.7 | Portugal | 49.3 |
| 10 | Canada | 69.8 | Norway | 46.8 |
| 11 | New Zealand | 68.4 | Sweden | 45.9 |
| 12 | Austria | 63.4 | Finland | 44.6 |
| 13 | France | 58.3 | Italy | 34.6 |
| 14 | Germany | 55.6 | Greece | 30.6 |
| 15 | Norway | 53.9 | Spain | 26.6 |
| 16 | Australia | 52.8 | Canada | 25.4 |
| 17 | Italy | 43.7 | United States | 18.2 |
| 18 | Portugal | 41.4 | Iceland | 12.2 |
| 19 | United States | 34.4 | Australia | 11.3 |
| 20 | Japan | 33.8 | New Zealand | 6.8 |
| 21 | Spain | 31.9 | Japan | – |
| Note: * For Austria, Belgium-Luxembourg, Greece, Italy, the Netherlands, Portugal, Spain and Switzerland the latest data available are for end 1992. For Australia and New Zealand the data refer to the financial year ending in June and March 1993, respectively. No data are available for the UK on external debt or non-equity assets. | ||||
| Rank | 1984 | 1993* | ||
|---|---|---|---|---|
| 1 | Ireland | 63.0 | New Zealand | 61.6 |
| 2 | Iceland | 60.5 | Iceland | 60.6 |
| 3 | Greece | 45.1 | Finland | 59.4 |
| 4 | Denmark | 37.8 | Sweden | 58.9 |
| 5 | Portugal | 29.1 | Canada | 44.4 |
| 6 | Canada | 24.8 | Ireland | 44.1 |
| 7 | Sweden | 23.1 | Australia | 41.5 |
| 8 | Finland | 20.5 | Greece | 40.1 |
| 9 | Norway | 16.7 | Denmark | 34.5 |
| 10 | Australia | 15.9 | United States | 16.3 |
| 11 | Spain | 8.1 | Italy | 9.1 |
| 12 | United States | 2.8 | Norway | 7.1 |
| 13 | Germany | −6.8 | Spain | 5.3 |
| 14 | France | −7.5 | Austria | 3.2 |
| 15 | Belgium-Luxembourg | −16.3 | France | −0.1 |
| 16 | Netherlands | −24.4 | Germany | −7.4 |
| 17 | Switzerland | −137.4 | Portugal | −7.9 |
| 18 | Italy | – | Netherlands | −13.3 |
| 19 | New Zealand | – | Belgium-Luxembourg | −75.4 |
| 20 | Austria | – | Switzerland | −107.4 |
| Note: * For Austria, Belgium-Luxembourg, Greece, Italy, the Netherlands, Portugal, Spain and Switzerland the latest data available are for end 1992. For Australia and New Zealand the data refer to the financial year ending in June and March, respectively. No data are available for Japan and the UK on net external debt. | ||||
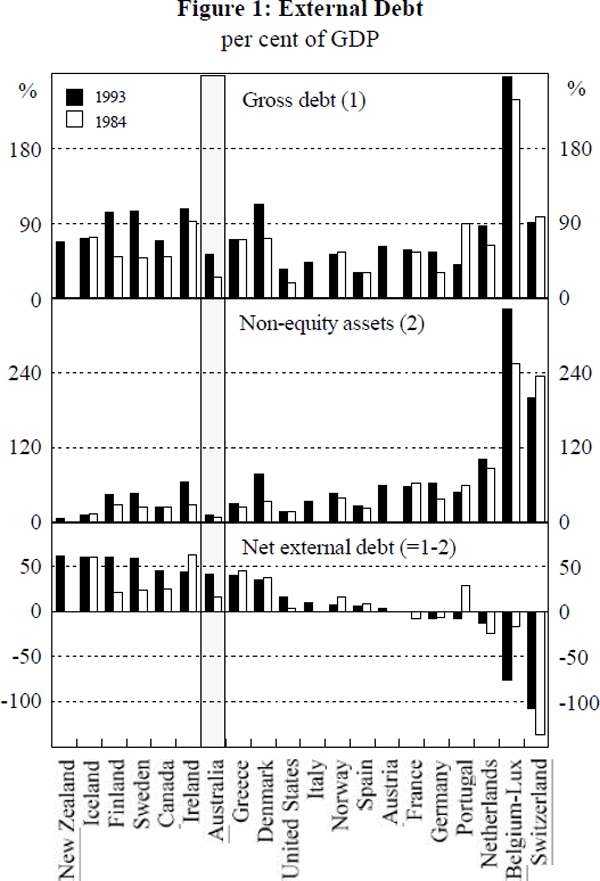
A characteristic of the Australian data is that much of the net external debt is owed by the non-official sector (Table 7). Net official external debt is relatively low in Australia. Over the past decade, Australia has consistently been ranked in the middle of the industrial countries in terms of net official debt. In 1993, net official debt was 8.4 per cent of GDP, up from a net asset position of 2.6 per cent of GDP in 1984. The net external debt of the Australian non-official sector has risen from 18.5 per cent of GDP to 33.1 per cent between 1984 and 1993. In the developing countries, net external debt tends to be concentrated in the official sector, though most recently there have been shifts towards the non-official sector (Table 8).[14]
| Rank | Non-Official | Official | ||
|---|---|---|---|---|
| 1 | Iceland | 40.3 | Denmark | 43.6 |
| 2 | New Zealand | 39.1 | Ireland | 38.8 |
| 3 | Sweden | 36.3 | Finland | 29.2 |
| 4 | Australia | 33.1 | Canada | 23.4 |
| 5 | Finland | 30.2 | Sweden | 22.7 |
| 6 | Greece | 25.8 | New Zealand | 22.5 |
| 7 | Canada | 21.0 | Iceland | 20.3 |
| 8 | Norway | 17.2 | Greece | 14.3 |
| 9 | Italy | 12.1 | Germany | 10.3 |
| 10 | Spain | 12.0 | Australia | 8.4 |
| 11 | United States | 9.7 | United States | 6.6 |
| 12 | Ireland | 5.4 | France | 3.7 |
| 13 | Austria | 3.2 | Austria | 0.0 |
| 14 | Portugal | 2.1 | Netherlands | −0.6 |
| 15 | France | −3.9 | Belgium-Luxembourg | −1.5 |
| 16 | Denmark | −9.0 | Italy | −3.1 |
| 17 | Netherlands | −12.7 | Spain | −6.6 |
| 18 | Germany | −17.7 | Portugal | −10.0 |
| 19 | Belgium-Luxembourg | −73.8 | Norway | −10.1 |
| 20 | Switzerland | −89.5 | Switzerland | −17.8 |
| Note: * For Austria, Belgium-Luxembourg, Greece, Italy, the Netherlands, Portugal, Spain and Switzerland the latest data available are for end 1992. For Australia and New Zealand the data refer to the financial year ending in June and March 1993, respectively. No data are available for Japan and the UK on net external debt. | ||||
| Net External Debt |
Net Official Debt |
Net Non- Official Debt |
|
|---|---|---|---|
| Argentina | 15.4 | 12.6 | 2.9 |
| Brazil | 17.8 | 12.2 | 5.6 |
| Chile | 15.7 | −1.6 | 17.4 |
| China | 4.0 | 4.3 | −0.2 |
| India | 21.7 | 16.5 | 5.1 |
| Indonesia | 48.2 | 29.4 | 18.8 |
| Korea | −7.1 | −14.2 | 7.0 |
| Malaysia | −1.5 | −13.4 | 11.9 |
| Mexico | 22.0 | 15.0 | 7.0 |
| Pakistan | 39.3 | 35.6 | 3.8 |
| Peru | 30.4 | 23.6 | 6.8 |
| Philippines | 39.9 | 35.5 | 4.4 |
| South Africa | 9.4 | 5.1 | 4.3 |
| Thailand | 13.5 | −15.5 | 29.0 |
| Turkey | 30.2 | 22.8 | 7.4 |
| Venezuela | 12.4 | 21.2 | −8.8 |
4.2 External Liabilities
Developments in Australia's overall external position (debt plus equity) mirror that of external debt discussed previously. Australia's gross external liabilities doubled between 1984 and 1993 to 82.3 per cent of GDP. This is around the middle of the range of estimates for the industrial countries (Figure 2 and Table 9). For a number of countries such as the United Kingdom, Switzerland and Belgium-Luxembourg, gross liability data are inflated by international banking. Table 10 attempts to adjust for this by subtracting from total gross portfolio and other liabilities those owed by banks and adding back net bank liabilities if positive. While this changes the absolute level of gross liabilities of a number of countries, Australia's relative position is little changed.
| Rank | Assets | Liabilities | ||
|---|---|---|---|---|
| 1 | Belgium-Luxembourg | 355.5 | Belgium-Luxembourg | 340.2 |
| 2 | Switzerland | 249.6 | UK | 216.5 |
| 3 | UK | 219.7 | Switzerland | 149.3 |
| 4 | Netherlands | 145.0 | Netherlands | 125.2 |
| 5 | Denmark | 94.0 | Denmark | 125.1 |
| 6 | Germany | 77.8 | Sweden | 120.6 |
| 7 | Sweden | 74.3 | Finland | 114.2 |
| 8 | France | 73.2 | New Zealand | 98.6 |
| 9 | Austria | 66.4 | Canada | 89.6 |
| 10 | Finland | 55.5 | Australia | 82.3 |
| 11 | Japan | 52.0 | France | 73.9 |
| 12 | Norway | 51.6 | Austria | 70.5 |
| 13 | Italy | 48.0 | Germany | 63.8 |
| 14 | Canada | 45.5 | Norway | 59.5 |
| 15 | United States | 41.5 | Italy | 57.7 |
| 16 | Spain | 30.3 | Spain | 52.4 |
| 17 | New Zealand | 28.2 | United States | 49.5 |
| 18 | Australia | 27.8 | Japan | 37.5 |
| Note: * For Austria, Belgium-Luxembourg, the Netherlands, Spain and Switzerland the latest data available are for end 1992. For Australia and New Zealand the data refer to the financial year ending in June and March 1993, respectively. | ||||
| Rank | Total | Net of Banks | ||
|---|---|---|---|---|
| 1 | Belgium-Luxembourg | 305.2 | Sweden | 97.3 |
| 2 | UK | 195.6 | Finland | 92.6 |
| 3 | Switzerland | 131.0 | Denmark | 92.4 |
| 4 | Denmark | 113.2 | UK | 88.0 |
| 5 | Sweden | 112.4 | Belgium-Luxembourg | 84.3 |
| 6 | Finland | 109.4 | Switzerland | 77.4 |
| 7 | Netherlands | 98.5 | Canada | 62.1 |
| 8 | Canada | 69.0 | New Zealand | 58.1 |
| 9 | Austria | 64.4 | Australia | 53.6 |
| 10 | France | 63.5 | Netherlands | 45.6 |
| 11 | New Zealand | 61.7 | Italy | 39.3 |
| 12 | Germany | 56.8 | Germany | 33.7 |
| 13 | Australia | 54.8 | Norway | 31.7 |
| 14 | Italy | 51.7 | Spain | 30.0 |
| 15 | Norway | 43.2 | Austria | 28.0 |
| 16 | Spain | 39.9 | United States | 27.8 |
| 17 | United States | 37.8 | France | 21.8 |
| 18 | Japan | 37.1 | Japan | 20.6 |
| Note: * Note: For Austria, Belgium-Luxembourg, Norway, the Netherlands, Spain and Switzerland the latest data available are for end 1992. For Australia and New Zealand the data refer to the financial year ending in June and March 1993, respectively. | ||||
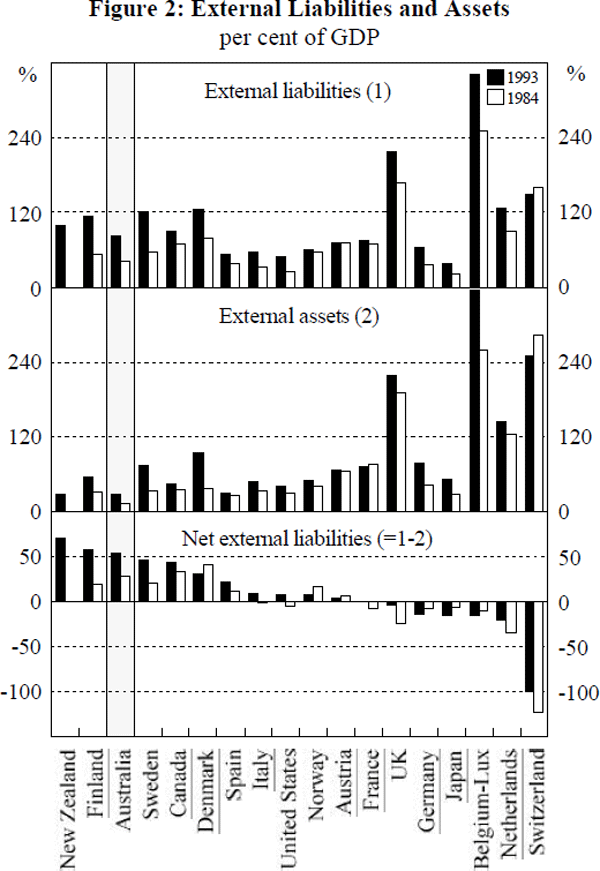
Australia's overall level of external assets is low compared with most countries despite doubling in the past decade (Figure 2 and Table 9). Consequently, while the gross level of external liabilities is currently in the mid-range of industrial countries, Australia has one of the highest net external liability positions (Figure 2 and Table 11). In 1993, Australia's net external liabilities were 54.5 per cent of GDP, with only New Zealand (70.4 per cent) and Finland (58.7 per cent) reporting larger figures. There were six countries with net external liabilities of at least 30 per cent of GDP in 1993.
| Rank | 1984 | 1993* | ||
|---|---|---|---|---|
| 1 | Denmark | 41.4 | New Zealand | 70.4 |
| 2 | Canada | 34.0 | Finland | 58.7 |
| 3 | Australia | 28.3 | Australia | 54.5 |
| 4 | Sweden | 21.4 | Sweden | 46.3 |
| 5 | Finland | 20.2 | Canada | 44.0 |
| 6 | Norway | 16.7 | Denmark | 31.1 |
| 7 | Spain | 12.5 | Spain | 22.1 |
| 8 | Austria | 6.3 | Italy | 9.6 |
| 9 | Italy | −1.3 | United States | 8.0 |
| 10 | United States | −4.5 | Norway | 7.9 |
| 11 | Japan | −6.2 | Austria | 4.1 |
| 12 | France | −7.7 | France | 0.7 |
| 13 | Germany | −7.6 | UK | −3.3 |
| 14 | Belgium-Luxembourg | −9.5 | Germany | −14.0 |
| 15 | UK | −24.0 | Japan | −14.6 |
| 16 | Netherlands | −34.0 | Belgium-Luxembourg | −15.3 |
| 17 | Switzerland | −123.0 | Netherlands | −19.8 |
| 18 | New Zealand | – | Switzerland | −100.3 |
| Note: * For Austria, Belgium-Luxembourg, the Netherlands, Spain and Switzerland the latest data available are for end 1992. For Australia and New Zealand the data refer to the financial year ending in June and March, respectively. | ||||
Ireland and Iceland may also fall into this group but there are no data available covering equity assets and liabilities to enable such a comparison[15]. Differences in valuation methods probably do not have a major impact upon the relative standing of Australia[16].
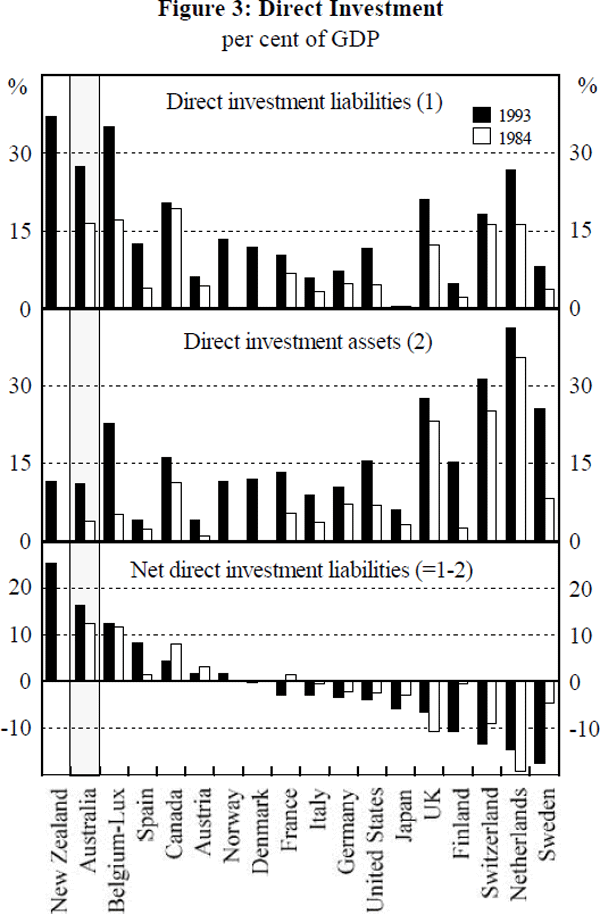
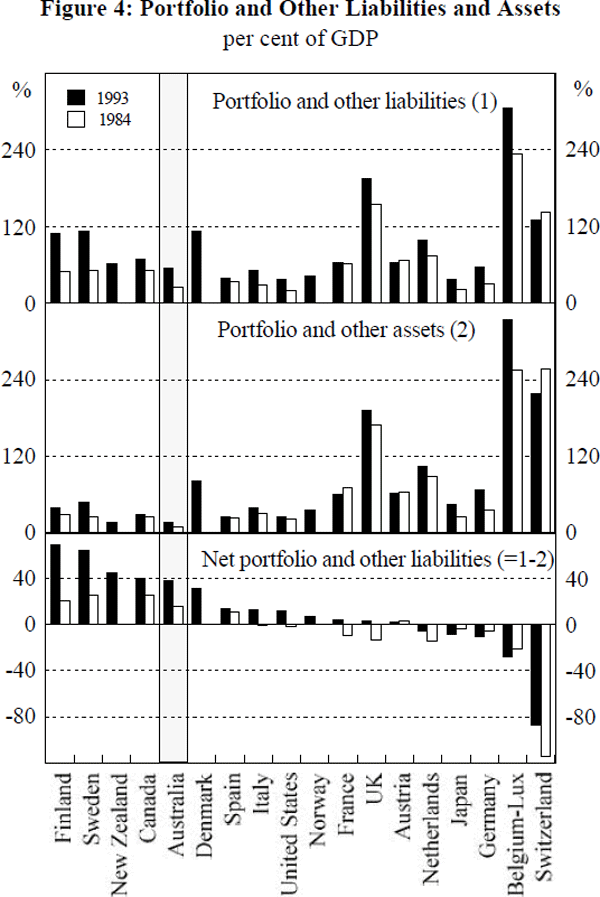
Disaggregating net external liabilities by function, Australia had the second highest level of net direct investment liabilities of the industrial countries in 1993 (Figure 3 and Table 12). Since 1984, net direct investment liabilities have risen by 4 percentage points of GDP to 16.3 per cent of GDP[17]. Once again, differences in valuation method are unlikely to be the cause of Australia's relatively high net liability position. In terms of net portfolio and other liabilities, Australia ranks fifth (Figure 4 and Table 12). The net level of liabilities has more than doubled to 38.2 per cent of GDP over this period.
| Rank | Portfolio and Other | Direct Investment | ||
|---|---|---|---|---|
| 1 | Finland | 69.4 | New Zealand | 25.2 |
| 2 | Sweden | 63.8 | Australia | 16.3 |
| 3 | New Zealand | 45.3 | Belgium-Luxembourg | 12.3 |
| 4 | Canada | 39.7 | Spain | 8.2 |
| 5 | Australia | 38.2 | Canada | 4.3 |
| 6 | Denmark | 31.4 | Austria | 1.8 |
| 7 | Spain | 13.9 | Norway | 1.7 |
| 8 | Italy | 12.6 | Denmark | −0.3 |
| 9 | United States | 11.8 | France | −2.9 |
| 10 | Norway | 7.5 | Italy | −3.0 |
| 11 | France | 3.6 | Germany | −3.5 |
| 12 | UK | 3.4 | United States | −3.9 |
| 13 | Austria | 2.3 | Japan | −5.8 |
| 14 | Netherlands | −5.3 | UK | −6.6 |
| 15 | Japan | −8.8 | Finland | −10.6 |
| 16 | Germany | −10.5 | Switzerland | −13.0 |
| 17 | Belgium-Luxembourg | −27.7 | Netherlands | −14.5 |
| 18 | Switzerland | −87.3 | Sweden | −17.5 |
| Note: * For Austria, Belgium-Luxembourg, the Netherlands, Norway, Spain and Switzerland the latest data available are for end 1992. For Australia and New Zealand the data refer to the financial year ending in June and March 1993, respectively. | ||||
Footnotes
For the developing countries the debt classified as official is that which is long-term and is either owed or guaranteed by the government sector. Short-term debt has no sectorial classification and is therefore grouped with the non-official sector. [14]
Data are not available for three industrial countries that have a high level of net external debt – Ireland, Iceland and Greece – due to a lack of information on equity stocks. (Also it must be remembered that for Ireland the external debt data do not include the non-bank private sector). A comparison of the net income deficits of these countries with other high net liability economies suggests that Ireland may have the highest net liability position of all. Its net income deficit in 1993 was almost 11 per cent of GDP compared with something closer to 4 per cent for the other highly indebted countries. The net income deficit for Greece is quite low at around 1/4 of a per cent of GDP, suggesting a large net equity asset position and/or a significant underestimation of non-equity assets. [15]
Canada's net equity liability position is in balance and therefore the valuation effects may net out. A similar situation exists for Denmark. Sweden has a large net asset position for both equity and direct investment, so we may expect that their net liability position may actually be lower. [16]
Australia has a similar high level (and ranking) in terms of net equity liabilities. [17]