RDP 9112: The Role of Superannuation in the Financial Sector and in Aggregate Saving: A Review of Recent Trends 4. Superannuation and Aggregate Saving
December 1991
- Download the Paper 961KB
It is widely recognised that the growth of superannuation assets in the 1980s did not coincide with an increase in private saving rates. There is some dispute as to whether saving rates actually fell during the decade or merely remained steady, with conclusions differing depending upon which of a range of savings aggregates is looked at. The behaviour of the main alternative aggregates was reviewed in recent studies by Edey and Britten-Jones (1990) and by EPAC (1988). Generally speaking, the narrower measures, which exclude households' claims on corporate earnings from the definition of income, or which deduct estimates of depreciation from private income, tend to show falling saving rates over recent years; the broader measures favoured by Edey and Britten-Jones show saving rates having remained fairly flat, particularly when measured in inflation-adjusted terms.
Their preferred measure, gross private sector saving adjusted for inflation, expressed as a ratio to GDP, is reproduced and updated in Graph 10.[9] These updated estimates continue the pattern of earlier years, with saving rates appearing to fluctuate around their long-term average in accordance with fluctuations in national income. Broadly consistent with some form of consumption smoothing by households, the saving rate generally falls when income is below its trend and rises when it is above trend. There seems to have been no obvious tendency, on this measure, for the average saving rate to shift significantly between cycles.
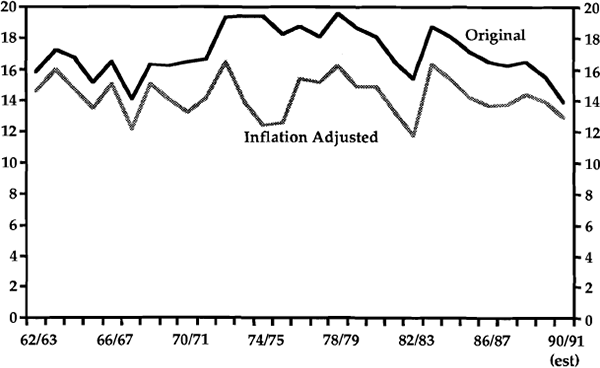
Source: See footnote 9.
This flatness of the saving ratio over the medium term may seem to conflict with the fact that households' assets, and their net worth, grew substantially during the 1980s. Table 4 reproduces estimates of household sector aggregate balance sheets provided by Callen (1991). Per capita real net worth is estimated to have risen by 41 per cent in the decade, compared with 15 per cent growth in per capita real GDP. Superannuation assets were the fastest growing of any of the major components of household wealth.
| Levels ($ billion) | % change | ||||
|---|---|---|---|---|---|
| 1981 | 1989 | nominal | real | real per capita | |
| Monetary Assets: | |||||
| Notes and Coin | 2.5 | 6.1 | 144 | 31 | 16 |
| Deposits | 50.0 | 142.3 | 185 | 53 | 36 |
| Other Financial Assets: | |||||
| Equities | 11.8 | 41.8 | 254 | 90 | 69 |
| Unit Trusts | 1.3 | 18.4 | 1,315 | 660 | 574 |
| Public Sector Securities | 4.2 | 3.6 | −14 | −54 | −59 |
| Superannuation and Life Insurance | 29.9 | 131.4 | 339 | 136 | 110 |
| Total Financial Assets | 99.7 | 343.6 | 245 | 85 | 64 |
| Physical Assets: | |||||
| Owner-occupied housing | 189.7 | 549.7 | 190 | 56 | 38 |
| Investment housing | 53.5 | 137.4 | 157 | 38 | 22 |
| Consumer Durables | 35.1 | 77.3 | 120 | 18 | 5 |
| TOTAL ASSETS | 378.0 | 1,108.0 | 193 | 57 | 40 |
| Mortgages | 25.7 | 68.9 | 168 | 44 | 28 |
| Other Borrowing | 14.1 | 38.9 | 176 | 47 | 31 |
| TOTAL LIABILITIES | 39.8 | 107.8 | 171 | 45 | 29 |
| NET WORTH | 338.2 | 1,000.2 | 196 | 59 | 41 |
There seem to be two main reasons why the rapid growth of households' superannuation assets did not lead to higher rates of private saving: one is largely definitional, and the other behavioural. The definitional reason is that a large part of the growth in superannuation assets was contributed by capital gains. Under national accounting conventions these do not count as income, and hence do not contribute to the recorded saving aggregates. A similar point could be made with respect to the effect of capital gains on owner-occupied housing. This definitional point partly explains why the household sector's net assets-to-income ratio could rise when their saving ratio did not.[10]
The behavioural reason is concerned with the other major contributor to superannuation growth – the high real interest rates of the 1980s. While high real interest rates add to household income from one source (the return on their interest-bearing assets), they correspondingly detract from the after-interest income of debtor households and of the corporate sector. The income-effect on saving by these groups would therefore tend to offset the addition to saving achieved through reinvestment of superannuation funds' earnings. Indeed, a plausible case could be made that the net of all these effects is close to zero, given that the private sector's net interest income position is a relatively small proportion of their total income.[11] This effect is reinforced, in the case of defined-benefit schemes, by the fact that high interest earnings can be offset by reduced employer contributions; the data presented in Section 2 suggest that this was an important effect in the second half of the 1980s.
These two sets of considerations suggest that changes in the growth of superannuation funds' assets, to the extent that they are due to changes in earning rates, are not likely to have a major impact on national saving aggregates. But the more fundamental question is whether or not aggregate saving is affected by changes in members' contributions. This is much harder to answer, because significant sustained shifts in contribution rates have not yet been observed. Overseas evidence reviewed by Stemp (1988) seemed to give some support to the proposition, although the debate there is far from settled.[12]
In the Australian context, the argument essentially boils down to two sets of issues: the substitutability between superannuation and other forms of saving; and the effect of the superannuation system (including its interaction with other aspects of the retirement incomes system) on behaviour around retirement. The first question asks whether households offset rises in superannuation contributions by simultaneously reducing other forms of saving; the second asks whether they are likely to offset their current superannuation saving by reducing saving later in life.
On the first issue, there is generally thought to be some degree of substitutability between the different forms of saving, particularly for high income households. Provided this substitutability is less than perfect, an enforced increase in private contributions would raise the private sector's saving rate, particularly if it brings in low income earners who would not otherwise have saved. Unfortunately the experience with award superannuation in the late 1980s cannot easily be used as a test case for this proposition, because it has not yet produced a significant lift in net contributions.
The second issue, concerning saving by those close to retirement age, has been raised as a matter of concern in several studies.[13] These have pointed out that the interaction of the income tax system with means-testing of age pensions, creates extremely high effective marginal tax rates for those at or near retirement. These high marginal tax rates apply both to income earned prior to retirement, and to the income yielded by assets accumulated as self-provision for retirement (with the exception of the family home).
Particularly for those in the middle income range or below, this is argued to have the effect of discouraging labour force participation in the ages around retirement, and encouraging the decumulation of assets in order to qualify for the age pension. The effects are exacerbated by the still-favourable treatment given to lump-sum superannuation benefits, which facilitate the phenomenon of “double dipping”.
Without going into the detailed arguments for or against these propositions, it can be seen that some of the more obvious facts do seem consistent with such effects. For example:
- about three-quarters of the pension-aged population receive an age pension, and for at least 60 per cent this is the predominant source of income;
- lump sums remain the preferred form of benefits among retirees, at least in the private sector;
- there has been a trend decline in labour force participation by males aged between 55 and 64 (see Graph 11).
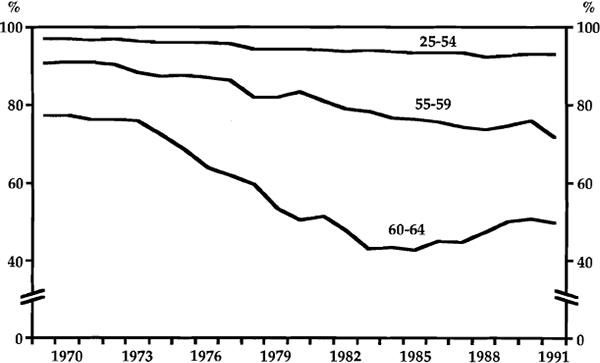
Source: The Labour Force, ABS 6204.0
As further evidence of significant incentives to qualify for the age-pension, Anstie and Freebairn (1989) note the unusual distribution of non-home assets among pension-aged households. Using Department of Social Security statistics for 1988 they report that 73 per cent of this group had assets below $50,000, 22 per cent had assets above $155,000, and only 5 per cent fell within the large middle range. This was interpreted as being strongly suggestive of incentives to qualify for the age pension by reducing assets. On the basis of such behaviour it could plausibly be argued that higher current contributions by younger workers would, to a large extent, lead to higher dissaving by those workers when they approach retirement, unless other aspects of the tax and benefits systems are also changed.
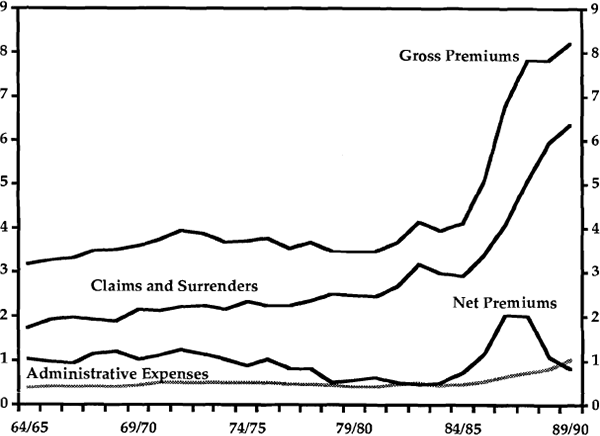
The recent introduction of rollover funds, designed partly to retain lump sum payouts within the superannuation system, seems to have had only temporary success in restraining these outflows, as has already been noted in section 2. Available data on gross flows, presented in Graph 12, suggest that the growth of rollovers has been associated with substantially increased gross flows in both directions (since a lump sum withdrawn from one fund and placed in a rollover fund would count as both an outflow and an inflow to the system); but there has not been a sustained change in the net flows. Growth of insurance bonds also contributed to the increase in gross flows. The rise in gross flows suggests that, at the margin, funds in the superannuation system have become much more mobile or discretionary from the point of view of the household sector.
Footnotes
The data sources and methods for this calculation are set out in Research Discussion Paper 9004, Reserve Bank of Australia. [9]
Whether or not capital gains should be included in national accounting measures of income is a matter for debate. Eisner (1988) supported their inclusion, but theoretical arguments by Hayashi (1989) and others suggest that households do not respond to capital gains in the same way as they do to other forms of income. Some empirical support for this view is reviewed by Edey and Britten-Jones (1990). [10]
The counterargument could perhaps be made that reinvestment of superannuation funds' earnings is a form of forced saving which cannot easily be offset by reducing saving elsewhere; hence the income effect of a change in interest rates on saving would be positive. However, empirical evidence reviewed by Edey and Britten-Jones shows little overall support for significant interest rate effects on saving. In a theoretical context, Summers (1981) makes a general case that net income effects on saving arising from changes in interest rates are likely to be small. [11]
Opposing views on this issue are propounded by Venti and Wise (1987) and by Gravelle (1991). [12]
See for example Freebairn, Porter and Walsh (1988), Anstie and Freebairn (1989), Carmichael and Plowman (1985) and Podger (1986). [13]