RDP 9112: The Role of Superannuation in the Financial Sector and in Aggregate Saving: A Review of Recent Trends 2. Growth of the Superannuation Sector
December 1991
- Download the Paper 961KB
Historical data on superannuation are subject to a considerable amount of imprecision due to the very large number of small funds not adequately covered by data collections[1], and the difficulty of avoiding double counting of funds' assets. The latter problem arises from the widespread practice of funds having part of their portfolios managed by other funds. In studying longer-term trends in this form of saving there is a strong case for ignoring distinctions between superannuation and life assurance. National accounts and flow-of-funds estimates have normally combined the two because of their conceptual similarity, and because of the difficulty of separating out that part of life offices' business that relates to superannuation. Clearly a significant part of the growth in superannuation has been at the expense of more traditional life assurance business, and for the most part this paper treats the two together (with the exception of the next paragraph).
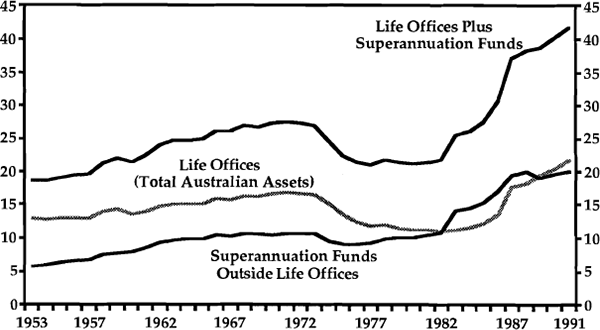
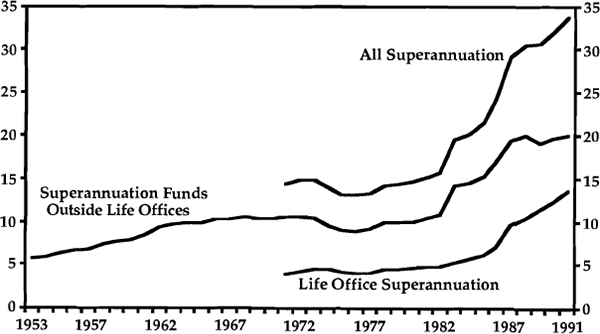
Graph 1 shows that by 1991 the total assets of superannuation and life office businesses amounted to 42 per cent of GDP ($160 billion). Currently, these assets are divided about equally between funds administered by life offices and others. The latter include those administered by banks, merchant banks and other specialist managers, as well as separately constituted funds (for example, company funds). Assets associated with the life offices' “ordinary business” have fallen from around 13 per cent of GDP in the early 1970s to around 8 per cent in 1991. Superannuation narrowly-defined has therefore grown more rapidly than the broader aggregate (Graph 2).
Source: See Appendix
Source: See Appendix
To some extent the available data may overstate growth of superannuation during the 1980s because of the increasing number of private sector funds brought into the data collections[2], and because there has been an increasing tendency during the 1980s for funds to value their assets at market prices rather than historical cost. On the other hand, exclusion of unfunded public sector schemes would contribute to some understatement of the size of superannuation throughout the period. It has been estimated, for example, that the Commonwealth Superannuation Scheme has unfunded liabilities of about $33 billion[3], and various State government schemes also have significant unfunded liabilities, thought to be at least as large.
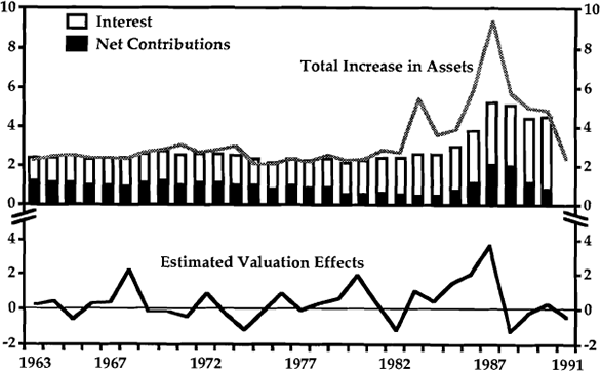
Major contributions to the growth of life insurance and superannuation assets are shown in Graph 3. Given the large swings that have occurred in total assets (relative to GDP), there has been surprisingly little variation in net contributions by members. These fell during the 1970s, following tightening of the very favourable taxation arrangements under which employee contributions had been tax deductible. The level of contributions picked up again during the middle of the 1980s. Although this pick-up occurred at around the time of the move to award-based superannuation, it seems to have been mainly due to something entirely different – the growth of “rollover” funds following the 1983/84 tax changes. These seem to have had the effect of retaining funds in the superannuation system for longer than would otherwise have been the case, thus bringing a temporary increase in net contributions as net outflows were slowed.
Source: Interest and net contributions, from Annual National Accounts, ABS. Assets and valuation effects, see Appendix.
The significance of this behaviour is discussed in more detail in Section 4. Here we note that from their inception in 1984/85, rollover funds have grown to have assets of over $20 billion, about 15 per cent of the aggregate assets of superannuation funds. In the four years to 1988/89, net contributions to such funds averaged close to 1 per cent of GDP, accounting for most of the rise in net contributions to life insurance and superannuation in that period.
The finding that award-based superannuation had little impact on aggregate contributions may seem surprising given the large increase in numbers of employees covered. Some relevant facts are summarised in Table 1.
| Percentage of employees covered |
Total employer contributions as percentage of wages and salaries bill |
|
|---|---|---|
| Private Sector | ||
| 1985/86 | 32.3 | 3.3 |
| 1986/87 | 31.8 | 3.4 |
| 1987/88 | 34.1 | 3.5 |
| 1988/89 | 40.7 | 3.2 |
| 1989/90 | 56.8 | 3.8 |
| Public Sector | ||
| 1986/87 | 63.4 | 7.7 |
| 1987/88 | 68.0 | 8.8 |
| 1988/89 | 90.4 | 9.5 |
| 1989/90 | 91.6 | 9.6 |
| Total | ||
| 1986/87 | 41.6 | 4.9 |
| 1987/88 | 44.0 | 5.3 |
| 1988/89 | 54.8 | 5.3 |
| 1989/90 | 66.8 | 5.6 |
Source: Major Labour Costs Australia, ABS 6348.0. For the public sector, average cost includes the cost of payouts by unfunded schemes. |
||
Consistent data on employee coverage are available for only a short period, but are sufficient to confirm that the increase in coverage has not had a substantial impact on the average level of saving through superannuation, particularly in the private sector. The second column of Table 1 is calculated as the ratio of total employer contributions to their total wages and salaries bill. This rose only from 3.3 to 3.8 per cent for private sector employers, despite a big increase in the proportion of employees covered. A major reason for this small impact was that there were widespread “contribution holidays” during this period by sponsors of over-funded defined-benefit schemes. High earnings rates enabled employers to reduce or suspend contributions to such schemes, and in some cases to withdraw surplus funds. Another factor is that there might have been some absorption of the 3 per cent award increase into existing superannuation arrangements in the private sector, even though the National Wage Case ruling stipulated that the increase was not to be absorbed.
It can be seen from a comparison of Graphs 1 and 3 that the fall in the ratio of superannuation assets to GDP in the 1970s was not a result of any fall-off in nominal asset growth, which continued steadily right through the decade. Rather, it was a result of the failure of asset growth to keep pace with inflation, which was itself mainly due to the fact that interest earnings did not rise sufficiently to maintain real returns. The fact that real interest rates were often negative in the 1970s (and that share prices did not regain their 1968 level until 1984) made it difficult for funds to continue growing in real terms.
The opposite situation occurred during the 1980s. The nominal interest earnings of funds rose considerably, to more than double those of the 1970s, while inflation fell. Rising asset prices also made a substantial contribution to growth, although to some extent the rise in book values of assets may have included belated recognition of asset price increases that had occurred during the 1970s. The residual gap between “contributions plus interest” and the rise in total assets, shown in Graph 3, implicitly represents the contribution of capital gains to the growth of funds' total assets; this was consistently a major contributor to growth during the decade and in some years was the largest contributor.
As a consistency check on this conclusion, the lower panel of Graph 3 calculates one important component of capital gains by applying changes in the All-Ordinaries Index to funds' aggregate equity holdings at the beginning of each year. The correlation between this estimate and the residual estimate of capital gains is quite close for most of the 1980s, but not in the earlier decades when it was common for funds to value their assets at historical cost.
The data thus point to the conclusion that much of the historically observed variation in the size of the superannuation sector has been driven by changes in real rates of return (i.e. a combination of real interest rates and capital gains) rather than in the level of members' contributions. Another way of illustrating this is to compare aggregate rates of return on superannuation funds with the rates of growth of their assets over the three decades, as in Table 2.
| Asset growth | Estimated earnings on assets | |
|---|---|---|
| 1960–1970 | 11 | 6 |
| 1970–1980 | 12 | 7 |
| 1980–1990 | 19 | 15 |
Note: The second column is, strictly speaking, the contribution to asset growth from earnings, estimated residually by deducting from total asset growth the net contributions of members (after administrative expenses), using national accounts figures. It seems broadly consistent with earnings rates obtained from industry sources. For example, the Noble Lowndes survey of 15 funds that operated over the 10 years to June 1990 showed a median return of 15.2 per cent. |
||
Thus in the 1980s, total assets of life insurance and superannuation funds grew at an average annual rate of 19 per cent; those assets were yielding rates of return of around 15 per cent, leaving a relatively small part of the funds' total growth to be explained by the net inflow of members' contributions. On this basis, the contribution from the latter was no higher than in previous decades. This sensitivity of superannuation funds' growth rates to their earnings rates is mathematically almost inevitable, once the funds have grown to a point where net contributions have become a relatively small proportion of the accumulated stock of assets.