RDP 8807: The Cost of Capital: Some Issues 5. A Cost of Capital Series
August 1988
- Download the Paper 803KB
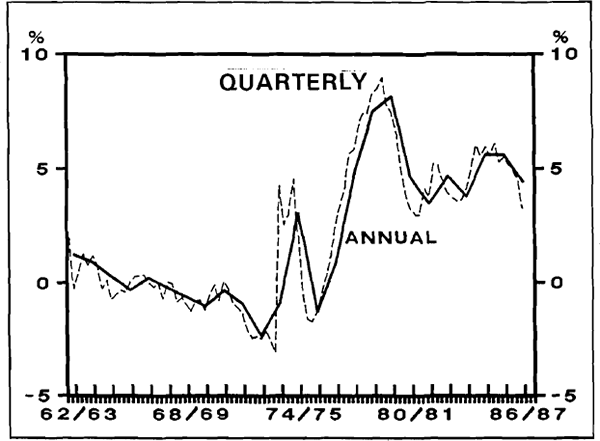
The debt-equity weighted average expected real cost of capital to the firm is shown in figure
5.1. It is an estimate of the expected (or ex ante) real net-of-tax cost of funds to the firm
based on the methodology described above. The exante measure of this variable (which simply
replaces e with its expected value, ê, and π with its expected value,  ) has been
chosen because fund raising decisions are essentially forward-looking. Further details of the
construction of the measure and data used are contained in appendix
II and III respectively.
) has been
chosen because fund raising decisions are essentially forward-looking. Further details of the
construction of the measure and data used are contained in appendix
II and III respectively.
Movements in the series reflect changes in:
- the real after-tax cost of debt;
- the real rate of return on equity; and
- the debt-equity ratio.
a. Movements in the Series
In aggregate, the cost of capital appears to have remained fairly flat throughout the 1960s; movements tend to mirror fluctuations in the cost of equity, while the real after-tax cost of debt remained fairly stable. The real costs of debt and equity financing appear to have been broadly similar during this period.[6]
Following a moderate rise in the early 1970s, the average cost of capital fell substantially during the middle of the decade as firms moved towards relatively low cost debt, in a high inflation environment. However, towards the end of the 1970s the cost of capital rose quite strongly – reaching its highest level for at least a quarter of a century. This reflected an increase in the cost of both debt and equity costs as inflationary pressures moderated and the demand for investment funds picked-up.
The cost of equity fell substantially through the mid-1980s, along with the debt-equity ratio. For the last couple of years, this shift towards equity has contributed to a decline in the average cost of capital, although still remains well above its levels during the early 1970's.
In December 1980, interest rate controls over bank deposits were abolished, in accordance with the preliminary findings of the Committee of Inquiry into the Australian Financial System (Campbell Committee). This marked the onset of an era of unprecedented financial system deregulation.[7] The influence of deregulation on the cost of capital and subsequently, investment is difficult to gauge. Difficulties in identifying the causal relationships empirically place a thorough analysis of the issues well beyond the scope of this paper.[8] However the few points which follow attempt to highlight areas of possible influence of deregulation on the cost of capital.
In general terms changes to the competitive structure of financial markets, as a result of deregulation, are likely to influence the cost and availability of capital to firms. Efficiency considerations are also likely to be affected by changes in government regulations (among other things) which, in turn, alter the cost of funds. Appendix I summarises some of the regulatory changes since the mid 1960's which may have altered the cost and availability of capital to firms.
The view of the Campbell Committee was clearly “… that various actions of government have had a significant distorting effect on the cost and availability of credit to business …” (Final Report, 1981, pp608–9). They cited various aspects of taxation which bore heavily on business balance sheet structures and funding patterns. The report suggested that lending and interest rate controls may have resulted in higher bank interest charges for larger customers and rationing of funds to small businesses, including increased resort by firms to more costly (and often less efficient) sources of finance as part of the rationing process.
For example, portfolio restrictions on financial institutions, such as the “30/20 rule” and the fact that household sector deposits in certain types of institutions were not generally available for on-lending to the business sector as either debt or equity, were suspected of affecting the cost and availability of funds to the business sector. Exchange controls and restrictions on forward cover were thought to limit financial choice available to firms.
In line with the recommendations of the report, many of these regulatory obstructions have been removed. For example, exchange controls and most bank interest rates, maturity and qualitative lending controls have been removed. The 30/20 requirements have been relaxed. Savings banks also have more scope to determine their asset structure, and most recently, there has been greater integration of company and personal income tax system (see Appendix I).
The main differences evident in the cost of capital series since the onset of rapid deregulation appear to be that, following the big fluctuations of the 1970s, the series may have become more stable but at a higher average level than was evident during the 1960s.
b. Some Limitations
There are a number of conceptual limitations of this measure of the cost of capital. These include the simplifying assumption upon which it is based. That is, the firm invests to the point where the marginal product of capital equals its marginal cost. Although this assumption may hold in the long term, there appears to have been significant deviations from this competitive equilibrium in the shorter term.
Carmichael and Dews (1987) found that broad trends in factor prices were consistent with the maintenance of a reasonable level of competition, but there appears to have been a number of periods during which actual factor payments have deviated from the competitive solution. They suggest that the marginal product of capital would have been closely associated with its “true” factor cost in the late 1960s and early 1970s, and again during the 1980s. However, in the mid 1970s, when labour was apparently being paid in excess of its marginal product, the gap between the return to capital and its cost increased. This raises some doubts regarding the accuracy of the measure through this period.
The concept measured is also not entirely appropriate for the purpose to which it is being put. What is strictly relevant to the firm's investment decision is not a comparison of the expected average rate of return with the average cost of capital, but rather the expected marginal rate of return on the proposed investment compared with the cost of the last tranche of funds supplied. The average cost (as measured) will not always equal the relevant marginal cost.
There are numerous other difficulties inherent in using a single price to represent this heterogenous aggregate. The implicit assumption that all firms have identical production functions may be an additional limitation. In fact, the cost of capital figures should probably be regarded as applying to “average firms”. Debt-equity ratios and earnings retention – divided payout decisions are taken as given, despite disparity amongst firms in practice. The cost of capital to firms of varying size and risk characteristics may be substantially different. For example, raising capital by selling equity is probably only a feasible proposition for the largest of small businesses or for those with obvious growth prospects. Also, while uncertainty exists, expectations tend to differ between firms so that the perceived cost of capital may also differ. No allowance is made for institutions with different tax treatments, and all firms are assumed to be profitable.
Short-run behaviour is heavily influenced by expectations which not only differ between firms but are also not fully captured in the measure. For example, institutional changes (such as the reforms to the tax system first announced in 1985) may be taken into account prior to their initiation, when decisions regarding the proportion of debt and equity financing to be undertaken are made. Although this measure is forward looking, these effects are not fully captured.
Footnotes
Results were particularly sensitive to the assumed average expected rate of retirement of debt. For this reason, the rate applied was the same as that used by Carmichael and Stebbing (1981) (2.2 per cent per quarter). The sensitivity of the level of the series to the rate assumed suggests caution should be applied when making comparisons between the level of interest rates and rates of return. However, broad trends in the movement of the series remain largely unaffected. [6]
For further details of the implementation of Campbell Committee recommendations, see Dews and Dwyer (1984). [7]
For further details of the overseas experience see Corcoran and Sahling (1982), Atkinson and Chouraqui (1985) and Johnson and Scanlon (1985). [8]