RDP 8704: The Role and Consequences of Investment in Recent Australian Economic Growth Appendix A: Estimated Production Functions
April 1987
| Constant | Share | Elasticity | Technological Progress | ||
|---|---|---|---|---|---|
| β / B | α / γ | σ | δ | R2 | |
| Cobb-Douglas:* | |||||
| 1. | 378.96 (0.576) |
0.36 (0.057) |
1.00 |
0.0028 (0.0003) |
0.995 |
| CES: | |||||
| 3. | 934.93 (241.75) |
0.20 |
1.09 (0.028) |
0.0028 (0.0003) |
0.984 |
| 4. | 533.37 (147.77) |
0.30 |
1.03 (0.025) |
0.0028 (0.0003) |
0.984 |
| 5. | 317.31 (91.74) |
0.40 |
0.98 (0.023) |
0.0028 (0.0003) |
0.984 |
| 6. | 191.05 (56.67) |
0.50 |
0.95 (0.022) |
0.0028 (0.0003) |
0.984 |
| 7. | 113.92 (34.18) |
0.60 |
0.91 (0.020) |
0.0028 (0.0003) |
0.984 |
| 8. | 65.70 (19.65) |
0.70 |
0.87 (0.018) |
0.0028 (0.0003) |
0.984 |
| 9. | 35.28 (10.31) |
0.80 |
0.84 (0.017) |
0.0028 (0.0003) |
0.984 |
| 10. | 16.03 (4.39) |
0.90 |
0.79 (0.015) |
0.0028 (0.0003) |
0.984 |
| * Estimated without imposing linear homogeneity (assuming δ = .0028) the capital share (α) = 0.355 and the labour share = 0.670. | |||||
| Constant | Share | Elasticity | Technological Progress | ||
|---|---|---|---|---|---|
| β / B | α / γ | σ | δ | R2 | |
| Cobb-Douglas: | |||||
| 1. | 278.11 (0.462) |
0.42 (0.049) |
1.00 |
0.0014 (0.0006) |
0.985 |
| CES: | |||||
| 2. | 2,091.99 (365.67) |
0.10 |
1.20 (0.030) |
0.0022 (0.0005) |
0.965 |
| 3. | 1,117.28 (222.42) |
0.20 |
1.09 (0.025) |
0.0022 (0.0005) |
0.965 |
| 4. | 660.82 (141.31) |
0.30 |
1.03 (0.022) |
0.0022 (0.0004) |
0.965 |
| 5. | 406.32 (90.86) |
0.40 |
0.98 (0.020) |
0.0023 (0.0004) |
0.965 |
| 6. | 252.56 (58.06) |
0.50 |
0.94 (0.019) |
0.0023 (0.0004) |
0.965 |
| 7. | 155.51 (36.24) |
0.60 |
0.91 (0.017) |
0.0023 (0.0004) |
0.965 |
| 8. | 92.77 (21.60) |
0.70 |
0.87 (0.016) |
0.0023 (0.0004) |
0.965 |
| 9. | 25.77 (19.42) |
0.80 |
0.87 (0.054) |
0.0023 (0.002) |
0.532 |
| 10. | 24.64 (5.28) |
0.90 |
0.78 (0.013) |
0.0023 (0.0004) |
0.965 |
| Constant | Share | Elasticity | Technological Progress | ||
|---|---|---|---|---|---|
| β / B | α / γ | σ | δ | R2 | |
| Cobb-Douglas: | |||||
| 1. | 120.00 (0.368) |
0.57 (0.034) |
1.00 |
−0.0066 (0.002) |
0.959 |
| CES: | |||||
| 2. | 2,747.60 (426.12) |
0.10 |
1.28 (0.020) |
−0.0074 (0.002) |
0.893 |
| 3. | 1,174.81 (199.65) |
0.20 |
1.17 (0.017) |
−0.0072 (0.002) |
0.894 |
| 4. | 596.34 (105.44) |
0.30 |
1.11 (0.015) |
−0.0070 (0.002) |
0.895 |
| 5. | 325.40 (58.44) |
0.40 |
1.07 (0.014) |
−0.0068 (0.002) |
0.895 |
| 6. | 183.28 (32.89) |
0.50 |
1.103 (0.013) |
−0.0067 (0.002) |
0.896 |
| 7. | 103.86 (18.35) |
0.60 |
0.99 (0.012) |
−0.0065 (0.002) |
0.896 |
| 8. | 57.77 (9.88) |
0.70 |
0.95 (0.011) |
−0.0064 (0.002) |
0.896 |
| 9. | 30.44 (4.92) |
0.80 |
0.91 (0.010) |
−0.0062 (0.002) |
0.897 |
| Constant | Share | Elasticity | Technological Progress | ||
|---|---|---|---|---|---|
| β / B | α / γ | σ | δ | R2 | |
| Cobb-Douglas: | |||||
| 1. | 235.46 (0.550) |
0.41 (0.057) |
1.00 |
0.0064 (0.0003) |
0.923 |
| CES: | |||||
| 2. | 1,346.69 (296.35) |
0.10 |
1.23 (0.036) |
0.0064 (0.0003) |
0.970 |
| 3. | 697.84 (172.44) |
0.20 |
1.12 (0.030) |
0.0064 (0.0003) |
0.970 |
| 4. | 404.98 (106.42) |
0.30 |
1.05 (0.027) |
0.0064 (0.0003) |
0.970 |
| 5. | 166.88 (60.18) |
0.40 |
1.04 (0.033) |
0.0063 (0.0004) |
0.946 |
| 6. | 151.34 (42.08) |
0.50 |
0.96 (0.022) |
0.0064 (0.0003) |
0.970 |
| 7. | 60.23 (92.55) |
0.60 |
0.95 (0.119) |
0.0064 (0.0017) |
0.04 |
| 8. | 55.16 (15.30) |
0.70 |
0.89 (0.019) |
0.0064 (0.0003) |
0.970 |
| 9. | 30.83 (8.309) |
0.80 |
0.85 (0.017) |
0.0064 (0.0003) |
0.970 |
| 10. | 14.86 (3.72) |
0.90 |
0.79 (0.015) |
0.0064 (0.0003) |
0.970 |
| Constant | Share | Elasticity | Technological Progress | ||
|---|---|---|---|---|---|
| β / B | α / γ | σ | δ | R2 | |
| Cobb-Douglas: | |||||
| 1. | 79.88 (0.756) |
0.64 (0.073) |
1.00 |
−0.0449 (0.010) |
0.753 |
| CES: | |||||
| 2. | 2,707.62 (84.91) |
0.10 |
1.35 (0.005) |
−0.0858 (0.007) |
0.973 |
| 3. | 897.13 (26.32) |
0.20 |
1.26 (0.004) |
−0.1051 (0.008) |
0.975 |
| 4. | 377.47 (10.47) |
0.30 |
1.21 (0.003) |
−0.1232 (0.009) |
0.977 |
| 5. | 171.55 (4.73) |
0.40 |
1.17 (0.002) |
−0.1426 (0.010) |
0.978 |
| 6. | 88.74 (2.30) |
0.50 |
1.14 (0.002) |
−0.165 (0.010) |
0.979 |
| 7. | 45.79 (1.17) |
0.60 |
1.12 (0.002) |
−0.1942 (0.011) |
0.980 |
| 8. | 23.87 (0.613) |
0.70 |
1.09 (0.001) |
−0.235 (0.013) |
0.981 |
| 9. | 14.91 (5.53) |
0.80 |
0.99 (0.044) |
−0.076 (0.037) |
0.921 |
| 10. | 22.04 (6.91) |
0.90 |
0.84 (0.020) |
−0.031 (0.005) |
0.921 |
| Constant | Share | Elasticity | Technological Progress | ||
|---|---|---|---|---|---|
| β / B | α / γ | σ | δ | R2 | |
| Cobb-Douglas: | |||||
| 1. | 47.83 (1.46) |
0.62 (0.162) |
1.00 |
0.0034 (0.0003) |
0.982 |
| CES: | |||||
| 2. | 700.38 (484.45) |
0.10 |
1.42 (0.155) |
0.0034 (0.0003) |
0.917 |
| 3. | 353.63 (261.21) |
0.20 |
1.26 (0.121) |
0.0034 (0.0003) |
0.917 |
| 4. | 205.83 (155.80) |
0.30 |
1.17 (0.105) |
0.0034 (0.0003) |
0.917 |
| 5. | 127.30 (96.80) |
0.40 |
1.11 (0.094) |
0.0034 (0.0003) |
0.917 |
| 6. | 80.95 (60.96) |
0.50 |
1.06 (0.085) |
0.0034 (0.0003) |
0.917 |
| 7. | 51.85 (38.15) |
0.60 |
1.01 (0.077) |
0.0034 (0.0003) |
0.917 |
| 8. | 32.82 (23.21) |
0.70 |
0.96 (0.070) |
0.0034 (0.0003) |
0.917 |
| 9. | 19.99 (13.25) |
0.80 |
0.91 (0.063) |
0.0034 (0.0003) |
0.917 |
| 10. | 11.02 (6.48) |
0.90 |
0.84 (0.054) |
0.0034 (0.0003) |
0.917 |
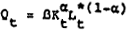
Cobb-Douglas:
CES:
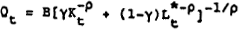
| where: | Q = the appropriate measure of GDP for the 4 quarters ended the current quarter in 1979/80 prices, consistent with ABS (1986); |
| L = the average number of people employed over the 4 quarters up to and including the current quarter; | |
K = the average 1979/80 price value of the appropriate measure of the capital
stock (excluding dwellings) over the 4 quarters ended:
|
|
| t = time. |
Figures in parentheses are standard errors.
Quarterly estimates of private sector output, employment and output by industry have been constructed using a number of assumptions. Details are contained in Appendix B; as are the sources, definations and copies of all data used in this study.