RDP 7904: Some Aspects of RBA76 and RBF1 3. Some Aspects of RBF1(M)
September 1979
3.1 The Model Under Consideration
The model used in this analysis combines a version of the model which is traditionally known as RBF1[38] with a monetary sector based on the work of Kiernan (1977) and is denoted RBF1(M). In general, the estimation technique is ordinary least squares with some price equations estimated using a non-linear regression programme. The OLS estimation procedure means that standard errors for all structural parameters cannot be obtained hence it is not feasible to group parameters by function as was done for RBA76.[39] An alternative criterion is to classify equations and their parameters by sectoral groupings. In the analysis eight groups are identified:[40]
- expenditure,
- supply,
- wages and prices,
- employment,
- balance of payments,
- financial,
- taxes, and
- incomes.
Like RBA76(T) the equations of RBF1(M) differ for some of the estimation periods. For example, the model estimated using 1974/75 constant price data excludes the equation for direct taxes payable on household incomes (TYPL). Further, several of the financial sector equations are exogenised for the first three sample periods (discussed below) because of problems with availability of data (DCDT, DPB, RCD, APB, LMAP).
The specification of the 61 core endogenous equations is given in Appendix D[41] and the 299 parameter estimates and their standard errors are given in Appendix E. The distribution of these parameters and equations into the equation groups listed on the previous page is given in Table 9.
| Sector | Number of Equations | Number of Parameters |
|---|---|---|
| 1. Expenditure | 10 | 70 |
| 2. Supply | 3 | 11 |
| 3. Wages and Prices | 14 | 51 (50) |
| 4. Employment | 3 | 17 |
| 5. Balance of Payments | 1 | 6 (5) |
| 6. Financial* | 15 (10) |
98 (66) |
| 7 Taxes* | 8 (7) |
21 (18) |
| 8. Incomes | 7 | 25 |
| Total* | 61 (55) |
299 (262) |
|
+ The number of parameters (constants from various equations) excluded from
the analysis is thirty (see footnote 2, page 23). Further the four first
order autocorrelation coefficients estimated in the ds, ic, Pid and Nu
equations are excluded. |
||
3.2 Parameter Stability
Similar tests to those conducted for RBA76(T) are carried out for RBF1(M). However, the estimation procedure used for RBF1(M) allows several other tests to be conducted. Again the central issue addressed is parameter stability and the impact this has on the simulation performance of the model. RBF1(M) is estimated over the following periods:[42]
- 1959(4) – 1971(2) (EST5971),
- 1959(4) – 1973(2) (EST5973),
- 1959(4) – 1975(2) (EST5975),
- 1971(3) – 1975(2) (EST7175),
- 1971(3) – 1978(4) (EST7178), and
- 1966(4) – 1976(4) (EST6676).
The first three of these sample periods correspond quite closely to three of the RBA76(T) estimation periods. Like RBA76(T) these three estimation periods use 1966/67 constant price national accounts data. The fourth estimation period uses the same data and the results from this estimation are used in conjunction with those from sample periods (i) and (iii) to carry out Chow tests on equation stability.
Recently the Commonwealth Statistician rebased the constant price national accounts data from 1966/67 prices to 1974/75 prices. These rebased data are used in estimation sets (v) and (vi). Under the assumption that the rebasing is only a linear transformation[43] the estimates from data set (v) can be combined with estimates from estimation period (i) to obtain two mutually exclusive sample periods over which parameter stability can be examined.
Estimation period (vi) is used to examine the within and out of sample properties of the model while multiplier experiments are conducted with the estimates from the first three sample periods.
The approach taken in the following subsections is to take the estimates to 1971(2) as representing those of a base or “consensus model”. Similar tests as were conducted for RBA76(T) in sections 2.4.1 and 2.4.2 are considered in sections 3.3.1 and 3.3.2.
3.3 Analysis of Parameter Stability
3.3.1 Test of Equality between Parameter Estimates and Population Values (EST5971 assumed equal to population)
Table 10 summarises the results of assuming that the estimates to 1971(2) are the true population values and then testing the null hypotheses that the estimates for alternative periods are equal to the population values.[44]
The results indicate that the null hypothesis is rejected for a minimum of 15% of the parameters – this occurring for the estimates from 1959(4) to 1973(2), that is with the addition of two extra years data. The number of parameters failing the test more than doubles with the addition of another two years data.
For the last two sets of estimates – where the data are dominated more by the 1970s – the proportion of parameters that fail the test are 40% and 42% respectively. The same trends are evident for the various equation groups except for the supply and tax sectors.
3.3.2 Tests for Equality Between Parameter Estimates
For EST5973, EST5975 and EST6676 it is assumed that the covariances between these estimates and EST5971 are zero. The null hypothesis is then whether the alternative estimates are equal to the EST5971 estimates.[45] For EST7178 it is not necessary to assume that the covariances are zero as the two estimation periods involved are mutually exclusive.[46]
| Sector/Number of Equations | Number of Parameters | Number (and proportions) of Parameters where the Null Hypothesis is Rejected | |||
|---|---|---|---|---|---|
| EST5973 | EST5975 | EST7178 | EST6676 | ||
| 1. Expenditure (10) | 70 | 8 (11%) |
17 (24%) |
24 (34%) |
24 (34%) |
| 2. Supply (3) | 11 | 2 (18%) |
6 (55%) |
1 (9%) |
3 (27%) |
| 3. Wages and Prices (14) | 50 | 8 (16%) |
22 (44%) |
28 (56%) |
30 (60%) |
| 4. Employment (3) | 17 | (6%) | 7 (41%) |
10 (59%) |
11 (65%) |
| 5. Balance of Payments (1) | 5 | – | 1 (2%) |
2 (40%) |
2 (40%) |
| 6. Financial (10) | 66 | 11 (17%) |
20 (30%) |
27 (41%) |
26 (39%) |
| 7. Taxes (7) | 18 | 1 (6%) |
8 (44%) |
3 (17%) |
2 (11%) |
| 8. Incomes (7) | 25 | 7 (28%) |
11 (44%) |
11 (44%) |
11 (44%) |
| Total (55) | 262 | 28 (15%) |
92 (35%) |
106 (40%) |
109 (42%) |
| Sector/Number of equations | Number of Parameter | Number (and proportions) of Parameters where the Null Hypothesis is Rejected | |||
|---|---|---|---|---|---|
| EST5973 | EST5975 | EST7178 | EST6676 | ||
| 1. Expenditure (10) | 70 | 1 (1%) |
8 (11%) |
13 (19%) |
14 (20%) |
| 2. Supply (3) | 11 | 3 (27%) |
4 (36%) |
1 (9%) |
2 (18%) |
| 3. Wages and Prices | 50 | 5 (10%) |
16 (32%) |
22 (44%) |
19 (38%) |
| 4. Employment (3) | 17 | 1 (6%) |
6 (35%) |
9 (53%) |
10 (59%) |
| 5. Balance of Payments (1) | 5 | – | 2 (40%) |
1 (20%) |
1 (20%) |
| 6. Financial (10) | 66 | 6 (9%) |
8 (12%) |
21 (32%) |
17 (26%) |
| 7. Taxes (7) | 18 | 3 (16%) |
7 (39%) |
6 (33%) |
8 (44%) |
| 8. Incomes (7) | 25 | 5 (20%) |
9 (36%) |
7 (28%) |
11 (44%) |
| Total (55) | 262 | 24 (9%) |
60 (23%) |
80 (31%) |
82 (32%) |
The results from this test are summarised in Table 11. For EST5973 and EST5975, 9% and 23% of parameters fail the test. For the non-overlapping sample period (EST7178) this percentage had grown to 31%. As with RBA76(T) the trend appears to be that with additional data (this being for the mid-1970s for RBF1(M)) parameter instability increases.
3.4 Other Tests
Table 12 indicates the extent to which parameters from the alternative estimation periods differ in an absolute sense from the estimates to 1971(2). Similar trends to those found earlier are identifiable.
| EST5971 Parameters Plus or Minus | Number (and proportions) of Parameters | |||
|---|---|---|---|---|
| EST5973 | EST5975 | EST7178 | EST6676 | |
| Less than 50% | 161 (61%) |
133 (51%) |
98 (37%) |
108 (41%) |
| Between 50% and 100% | 44 (17%) |
45 (17%) |
46 (18%) |
39 (15%) |
| Greater than 100% | 57 (22%) |
84 (32%) |
118 (45%) |
115 (44%) |
Table 13 identifies the number of parameters where there has been a significant change in sign while Table 14 gives the proportions of parameters which are insignificantly different from zero. This latter table indicates that the proportion of insignificant parameters is dramatically high for the RBF1(M) model.[47]
| Sector/Number of equations | Number of Parameters | Number of Parameters that have changed sign | |||
|---|---|---|---|---|---|
| EST5973 | EST5975 | EST7178 | EST6676 | ||
| 1. Expenditure (10) | 70 | – | – | 5 | |
| 2. Supply (3) | 11 | – | – | – | – |
| 3. Wages and Prices (14) | 50 | – | – | 3 | 2 |
| 4. Employment (3) | 17 | – | – | – | – |
| 5. Balance of Payments (1) | 5 | – | – | – | – |
| 6. Financial (10) | 66 | – | – | – | – |
| 7. Taxes (7) | 18 | – | – | 2 | 2 |
| 8. Incomes (7) | 25 | – | – | 1 | 2 |
| Total (55) | 262 | – | – | 7 (3%) |
11 (4%) |
| Sector/Number of Equations | Number of Parameters | Number (and proportions) of Insignificant Parameters | ||||
|---|---|---|---|---|---|---|
| EST5971 | EST5973 | EST5975 | EST77178 | EST6676 | ||
| 1. Expenditure (10) | 70 | 37 (53%) |
31 (44%) |
32 (46%) |
24 (34%) |
21 (30%) |
| 2. Supply (3) | 11 | 4 (36%) |
4 (36%) |
2 (18%) |
3 (27%) |
2 (18%) |
| 3. Wages and Prices (14) | 50 | 17 (34%) |
19 (38%) |
13 (26%) |
16 (32%) |
15 (30%) |
| 4. Employment (3) | 17 | 6 (35%) |
4 (24%) |
5 (29%) |
5 (29%) |
5 (29%) |
| 5. Balance of Payments (1) | 5 | 3 (60%) |
3 (60%) |
3 (60%) |
2 (40%) |
2 (40%) |
| 6. Financial (10) | 66 | 36 (55%) |
33 (50%) |
27 (41%) |
27 (41%) |
27 (41%) |
| 7. Taxes (7) | 18 | 5 (28%) |
4 (22%) |
4 (22%) |
5 (28%) |
4 (22%) |
| 8. Incomes (7) | 25 | 5 (20%) |
3 (12%) |
4 (16%) |
9 (36%) |
6 (24%) |
| Total (55) | 262 | 113 (43%) |
101 (39%) |
90 (34%) |
91 (35%) |
82 (31%) |
3.5 Test of Equation Stability
The stability of equations is considered by conducting Chow tests, the results of which are reported in Section 3.5.1.
3.5.1 Chow Tests of Equation Stability
Instead of testing the stability of individual parameters within an equation, Chow tests can be used to test the stability of the equation. Estimates over three sample periods are required for this test. The periods used are 1959(4)–1971(2), 1971(3)–1975(2) and 1959(4)–1975(2). The results from this test are given in Table 15. This table shows that 70% of the equations fail the Chow test.
An analysis of coefficients of variation can be used to supplement the Chow tests. Some information on coefficients of variation is given in Tables F.1 to F.3 of Appendix F. These results suggest that when the RBF1(M) model is simulated single equation errors are likely to be important.
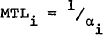
3.6 Behaviour of Particular Parameters – Mean time lags
In the RBF1(M) model there are 30 equations[48] modelled as stock or partial adjustment processes. The mean time lag (MTL) for these equations is determined by the ratio[49]
where αi is the adjustment parameter.
| Sector/Number of equations |
Number (and proportions) of equations that fail the Chow Test |
Equations that pass the Chow Test |
|---|---|---|
| A. Expenditure (10) | 9 (90%) |
cndo |
| B. Supply (3) | 2 (67%) |
ISVANF |
| C. Wages & Prices (14) | 11 (79%) |
Pcmv, Pcr, Pcg |
| D. Employment (3) | 3 (100%) |
– |
| E. Balance of Payments (1) | – | BKP |
| F. Financial (10) | 5 (50%) |
DPS, GSP, NCP, ATT, NCT |
| G. Taxes (6)* | 5 (83%) |
TXE |
| H. Incomes (7) | 3 (43%) |
YDR, YUNF, YDIV, YGOSD |
| Total (54) | 38 (70%) |
|
|
* The tax block includes TYPL but excludes the annual equations for TYPPNP and TYCP. |
||
Table 16 shows the time profile of the mean time lags. The dominant feature of these results is the variability of the mean time lags. There does not appear to be any general dominant trends in the size of the speed of adjustment parameters.
3.7 Simulation Experiments
Section 3.7.1 summarises some results from simulation experiments with RBF1(M). Section 3.7.2 considers some multiplier characteristics.
3.7.1 Within and Out of Sample Simulation Properties
Details of simulation properties with RBF1(M) are given in tabular form in Appendix F. In this section several features of these results are noted.
- Not surprisingly there is a strong correlation between those variables that have a high single equation coefficient of variation and those equations that have a high root mean square percentage error from within sample static and dynamic simulations.
- A comparison of static and dynamic simulations suggest some evidence of inappropriate lag structures.
- Errors increase with the lengthening of the sample period.
- Simulation performance deteriorates strongly when the model is simulated out of sample. Particularly crucial here is the behaviour of the labour market pressure variable (NVAC/NU) which plays a role in several areas. The unemployment equation simulates poorly and introduces instability to the labour market pressure variable which then leads to large errors in many equations.[50] The coefficients on the labour market pressure variable also show some signs of instability which may indicate the changing (NVAC/NU) usefulness of (NVAC/NU) as a measure of labour market pressure.
| Sector | Variable | Adjustment Parameter | ESTIMATION PERIOD | ||||
|---|---|---|---|---|---|---|---|
| EST5971 | EST5973 | EST5975 | EST7178 | EST6676 | |||
| Expenditure | cf | α1 | 1.68 | 3.30 | 5.35 | 2.73 | 1.33 |
| log (chd) | α2 | 5.98 | 10.05 | 11.13 | 1.22 | 1.66 | |
| kmv | α3 | 31.36 | * | 46.39 | 2.02 | 9.81 | |
| log(cndo) | α4 | 6.33 | 6.30 | 8.63 | 3.56 | 6.86 | |
| DCT | α5 | 17.08 | 9.09 | 9.85 | 17.59 | 7.35 | |
| 2. Supply | kinf | α8 | 2.40 | 6.70 | 5.41 | 3.22 | 3.41 |
| mgo | α9 | .28 | .31 | .29 | .43 | .52 | |
| 3. Wages and prices | J4P.WMA | α10 | 1.08 | .75 | 2.79 | * | .17 |
| PchdBT | (α11+α12)ø | 3.50 | 4.76 | 10.71 | .84 | 1.56 | |
| PcmvBT | α13 | 1.97 | 1.92 | 2.03 | 2.21 | 2.22 | |
| Pcndo | (α14+αl5)ø | 3.67 | 2.17 | 2.43 | 2.55 | 1.82 | |
| ΔPcr/Pcr | α16 | .08 | .11 | .18 | .14 | .49 | |
| Pid | (α17+α18)ø | 5.91 | 3.66 | 5.43 | 5.76 | 14.71 | |
| Pic | α19 | 1.58 | 3.55 | 1.56 | 1.41 | 1.25 | |
| Pie | (α20+α21)ø | 5.24 | 8.36 | 2.58 | 1.30 | 1.65 | |
| PEWA | α22 | .79 | .38 | .17 | .14 | .08 | |
| 4. Employment | NWCNF | α23 | 7.32 | 10.40 | 3.10 | 10.51 | 6.99 |
| NVAC | α24 | 4.22 | 3.89 | 4.10 | 3.78 | 4.42 | |
| 5. Financial | DFT/Pgdp | α25 | 20.79 | 27.25 | 3.57 | 1.00 | 2.65 |
| DCDT/Pgdp | α26 | + | + | + | 2.44 | 2.15 | |
| DPS/Pgdp | α27 | * | 61.11 | 25.88 | 13.27 | 7.01 | |
| DPB/Pgdp | α28 | + | + | + | 8.28 | 5.21 | |
| GSP/Pgdp | α29 | 9.41 | * | 67.03 | 19.37 | 17.32 | |
| NCP/Pgdp | α30 | 34.97 | 20.69 | 16.01 | 5.60 | 3.15 | |
| ATT | α31 | 6.92 | 1.45 | 3.90 | 3.09 | 3.48 | |
| APB | α32 | + | + | + | 2.02 | 2.38 | |
| LMAP | α33 | + | + | + | .96 | .93 | |
| RGS | α34 | 4.89 | 3.02 | 1.37 | 1.54 | .59 | |
| 6. Taxes | log TXC | α35 | 1.82 | 3.37 | 4.52 | 6.13 | 4.01 |
| 7. Incomes | YDIV | α36 | .34 | .61 | .84 | .18 | .38 |
|
* Not calculated due to (i) a. wrong sign, (ii) α1 >
1.0 |
|||||||
Some static and dynamic simulations are rerun with the financial and balance of payments sectors exogenous and alternatively with these sectors endogenous and all other sectors exogenous. In the former case the dwelling equations (id, DCT, ds) improve with the removal of errors in mortgage approvals. In the latter case mortgage approvals deteriorate. Overall, however, the implication of these simulations is that the links between the monetary and real sectors – in both directions – are weak. This is true for both impact effects and lagged effects.
3.7.2 Multiplier Characteristics
The shock considered is a sustained 10 per cent increase in nominal government current expenditure. The period over which this experiment is conducted is 1966(3)–1971(2) .
This experiment differs from that for RBA76(T) in two ways. First, the shock is to nominal rather than real government expenditure and second, the model structures differ and hence the responses will differ, in particular the exchange rate in RBF1(M) is exogenous.
Table 17 gives the output and price multipliers for RBF(M) for various estimates.
There are several interesting features of these results. First, the real output and price multipliers for EST5971 and EST5973 are broadly similar; each have the same impact multipliers (one for output and zero for prices) and very similar long run multipliers. The peak output multipliers are small particularly for EST5973. For both models the induced inflationary effects are slow to build up, with prices increasing by 1.3% and 1.1% after 5 years respectively.
| Variables/ Quarters Elapsed |
Model | |||
|---|---|---|---|---|
| EST5971 | EST5973 | EST5975 | ||
| Real Output | 1 | 1.0 | 1.0 | 2.1 |
| 4 | 1.2 | 1.0 | 0.5 | |
| 8 | 1.3 | 1.2 | 0.5 | |
| 12 | 1.5 | 1.2 | 0.6 | |
| 16 | 0.6 | 0.7 | 0.0 | |
| 20 | 0.6 | 0.6 | 0.0 | |
| Prices | ||||
| 1 | 0.0 | 0.0 | 0.1 | |
| 4 | 0.2 | 0.3 | 1.0 | |
| 8 | 0.5 | 0.6 | 1.2 | |
| 12 | 0.8 | 0.9 | 1.4 | |
| 16 | 1.1 | 1.0 | 1.4 | |
| 20 | 1.3 | 1.1 | 1.5 | |
|
* The multiplier for variable X is approximated as 100 (log XS – log XC) , where XC is the control solution and XS the shock solution. |
||||
For EST5975 the story is quite different. The peak output effect occurs in the first quarter and then quickly declines. The output multiplier only remains above one for the first 2 quarters. Prices respond much more quickly but then level off.
The plausibility of all these results is again open to question. The differences in the results for the various estimates is closely related to the response of inventories. Unlike RBA76(T), inventory (investment in non-farm stocks) behaviour is determined by a behavioural equation rather than as a residual.[51] The time profile of parameters β13, σ7 and σ8 are such as to change the inventory response between estimates. For EST5971 and EST5973, investment in non-farm stocks initially decreases in a buffer stock fashion and then gradually increases with demand pressures. For EST5975 investment in non-farm stocks implausibly increases very strongly from the outset.
Footnotes
See RBF1 Model Specification, July 1976, Reserve Bank of Australia, mimeo, 1976. [38]
This is because OLS estimates the parameters for the single equation reduced forms whereas in RBA76 the structural parameters are estimated. [39]
This grouping is similar to that used by Hymans and Shapiro (1974). [40]
The equations are written in structural form as distinct from the single equation reduced form specifications usually presented. This structural interpretation is solely the current author's and not necessarily shared by current or previous workers on the RBF1 model. [41]
These are the general estimation periods, for some equations starting points differ from 1959(4) due to lag structures or data availability. [42]
This means that for equations using constant price data the rehasing Only influences the equation's constant term. [43]
That is H0 : P1 = 
H1 : P1 ≠
where is the predetermined parameter set, P1 the
alternative parameter set, and the normalised test statistic is (P1 −
)/ .
[44]
.
[44]
That is H0 : P1 = P2
H1 : P1 ≠ P2
where P1 in the estimates from the alternative estimation period and
P2 are the EST5971 estimates. The normalised test statistic is (P1
− P2)/ .
[45]
.
[45]
In fact, some covariances may be non-zero as some lagged values for Almon variables etc. for EST7178 were obtained by using pre 1971(3) data. [46]
It will be remembered that this refers to single equation (only) reduced form parameters. It is possible that a reduced form parameter, which is a function of several structural parameters, is insignificant due to just one of the structural parameters being insignificant. [47]
The investment equations, ic and ie, are excluded from the analysis as they are not strictly stock adjustment models. Further, the estimation procedure does not allow the adjustment parameters from these equations (α6 and α7) to be identified. [48]
The out of sample simulation for EST5971 is cut short relative to other models (see Table F.7) because of this problem. In particular, the behaviour of (NVAC/NU) is such that the iterative procedure for determining solutions fails to converge. [50]
RBA76(T) can treat inventories as a residual because the model incorporates an output supply equation. [51]