RDP 2021-04: Monetary Policy, Equity Markets and the Information Effect 4. Data and Method
April 2021
- Download the Paper 1,551KB
4.1 Data
To calculate monetary policy surprises I use data from the OIS market. An OIS is an over-the-counter agreement between two parties where one party agrees to pay the other a fixed interest rate in exchange for receiving the average cash rate over the term of the swap.[4] The OIS market therefore captures expectations of the cash rate. OIS contracts have various tenors and for this study I use 8 contract tenors (1 month, 2 months, 3 months, 4 months, 5 months, 6 months, 9 months and 12 months). This helps to capture the forward looking nature of monetary policy. For these contracts, I use the OIS rate on monetary policy announcement days and a window of 30 minutes before announcements and 90 minutes after announcements to capture the monetary policy surprise component.[5] The data run from April 2001 to May 2020.[6]
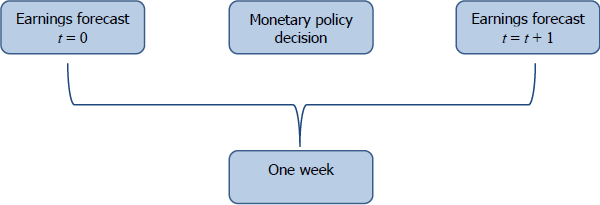
To capture equity market information I use two data series: the ASX 200 index and equity earnings growth expectations. Specifically, I use high-frequency ASX 200 price data from Refinitiv, which are measured every 10 minutes. The sample used is from April 2001 to May 2020. To capture earnings expectations I use the Institutional Brokers Estimate System (I/B/E/S) database from Refinitiv and extract weekly forecasts for earnings growth of the ASX 200 and Australian Global Industry Classification Standard (GICS) sectors. A stylised time line of an earnings forecast is shown in Figure 1. Forecasts are done on a weekly basis and I consider the forecasts where a monetary policy decision occurred between the weekly forecasts. The forecasts are done on a rolling window basis, meaning that the forecast window shifts by a week between the forecasts. Though ideally the forecast end date would be fixed for this analysis, a one week shift should not materially change the results. The earnings growth forecasts have 2 horizons, one-year-ahead and ‘long-term’, and the data are available from February 2006 to February 2020.
4.2 Method
4.2.1 Information effect regression
To evaluate the information effect of monetary policy I run the following regression:
where:
- is the change in the outcome variable of interest (the natural log of the ASX 200 index and equity earnings growth forecasts)
- mpst is a measure of monetary policy surprises (details in Section 4.2.2)
- is a constant and is an error term.
To measure the dependent variable, this analysis uses both high-frequency equity price data and weekly revisions to equity earnings growth forecasts. For equity prices, I take the change in the ASX 200 index around monetary policy announcements. I use the same time window used to calculate the monetary policy surprises. While for equity earnings growth forecasts, I take the weekly revision of the ASX 200 earnings growth forecasts following the monetary policy announcement as the dependent variable.
For Equation (3) to provide well-identified and unbiased results on the effect of monetary policy on the dependent variable there are 2 key assumptions:
- The monetary policy surprises only reflect changes in the expectations of the nominal interest rate, that is, no omitted variable bias.
- The monetary policy surprises are uncorrelated with relevant known information, that is, no reverse causality.
If assumption (1) is violated, the effects identified would not represent the pure effects of monetary policy on the dependent variable. That is, it would be identifying the effects of monetary policy and additional variables, such as risk premia, on the dependent variable. This could happen if a change in the cash rate also resolves some uncertainty in the market, thereby reducing risk premia. In this example, any observed change in the OIS curve could include the monetary policy surprise and the change in risk premia. While, if assumption (2) is violated, this would confound the results by introducing reverse causality to the analysis. Reverse causality could be introduced if the monetary policy surprises are a function of the dependent variable itself.
The frequency of the data used ameliorates concerns of omitted variable bias and reverse causality. The high-frequency nature of equity prices and the monetary policy surprises means that relevant information should already be accounted for prior to the monetary policy announcement. While for earnings forecasts, the relatively high frequency of the data (weekly) also reduces (but does not eliminate) the chance that there is news between the initial forecast period and the monetary policy announcement that would confound the results. Though useful in addressing assumption (2), the high-frequency nature of the data does not preclude the possibility of assumption (1) being violated.
4.2.2 Monetary policy surprises
Monetary policy actions are not random but rather a response to prevailing economic conditions. This often makes monetary policy actions predictable, giving agents time to adjust behaviour before the monetary policy announcement has been made. In the case of equity markets, agents will ‘price in’ anticipated changes in monetary policy and will only respond to unanticipated or surprise changes in monetary policy. This highlights the need to use a measure of monetary policy surprises. I exploit the information within financial markets to extract the ‘unexpected’ or ‘surprise’ component of monetary policy. This measures the difference between the actual and the expected change in monetary policy. As this measure of monetary policy surprises should not be incorporated into equity markets, I can hence measure the subsequent movements of the variables of interest against these measured surprises.
To capture monetary policy surprises, I take changes in the OIS contracts 30 minutes before and 90 minutes after monetary policy announcements over 8 horizons, ranging from one month to one year.[7] In principle, the changes in one OIS contract around monetary policy announcements could constitute a monetary policy surprise (e.g. Kuttner 2001; Cochrane and Piazzesi 2002). However, taking a surprise in a single contract may not adequately capture the forward-looking nature of monetary policy. To capture these dynamics I follow Gürkaynak et al (2005) and estimate factors using principal component analysis on the changes in all 8 OIS contracts around RBA Board announcements.[8] Hence, I estimate the following:
where:
- X is a T-by-n matrix of OIS contract changes around monetary policy announcements, where T represents the number of time observations and n is the number of OIS contracts
- F is a T-by-m matrix of unobserved factors, with
- is a matrix of factor loadings
- is a white noise error.
In the analysis on the information effect, I only use the first factor (F1) to measure monetary policy surprises (mpst ) defined in Equation (3). This is because the first factor captures the vast majority of the variation in the contracts, explaining 95.7 per cent of total variation across all contracts.
This factor aligns closely to level shifts in the OIS curve, principally because every contract contributes similar amounts to the factor (11.7 to 12.9 per cent). One drawback with only using one factor is that it may be that actions such as forward guidance would lead to ‘twists’ or changes in the slope of the OIS curve, and these changes in monetary policy could have different informational content. However, given that the first factor explains such a large amount of the data variation, additional factors are unlikely to be well identified or lead to externally valid estimates.
To aid interpretability I scale the first factor to the one-month OIS contract; hence a one unit change in this factor can be roughly interpreted as a 100 basis point level shift in the OIS curve.
Figure 2 presents the generated monetary policy surprise series (after scaling). The size of the surprises are generally small, with a standard deviation of around 6 basis points. However, there are notable spikes in the series, especially around the global financial crisis (GFC).
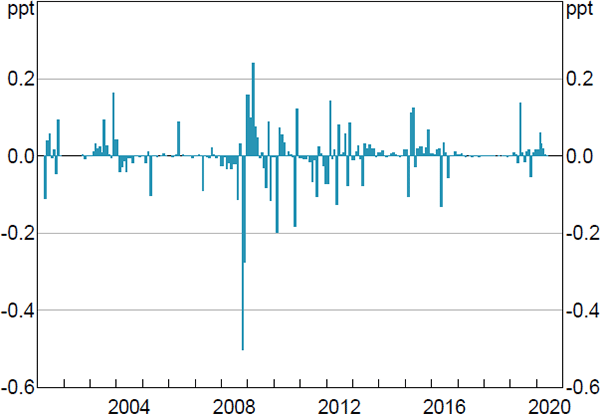
Sources: Author's calculations; RBA; Refinitiv
Footnotes
RBA (2002) provides details on the OIS market in Australia. [4]
This window is wider than other similar work from the United States, this is because the Australian OIS market is relatively small. Expanding the window gives time for the OIS market to price in the announcement. Varying the size of this window does not meaningfully change the results. [5]
There are a few missing data points from late 2001 to mid 2002. See Appendix A for more details. [6]
Prior to 2008, the RBA announced monetary policy decisions at 9.30 am. Since 2008, the RBA's monetary policy announcements have been delivered at 2.30 pm. [7]
Gürkaynak et al (2005) use 2 factors from 5 contracts: current and 3-months-ahead fed fund futures, and 2‐, 3‐ and 4-quarters-ahead eurodollar futures contracts. [8]