RDP 2020-04: The Apartment Shortage 4. The Effect of Height Restrictions
August 2020
- Download the Paper 3,815KB
4.1 Major Data Sources
In the following paragraphs we give a brief summary of our major data sources, then turn to some of the more interesting and difficult assumptions. We discuss details of data construction in Appendix A. We view these details as important – perhaps as the main contribution of the paper – but no conceptual issues are involved and we recognise that data technicalities are primarily of interest to specialists. For both prices and costs we use the ABS definition of an apartment: a unit in a multi-dwelling structure that shares a common entrance and does not have private grounds. Contrary to some usage, an apartment need not be in a tall building.
Our estimates for apartment prices are based on transaction-level data from CoreLogic for 2016. The raw data provides prices from a very large sample of unit sales in 2016. These estimates, comparable to those widely discussed in the media, are shown in row 1 of Table 2. Conceptually, we are more interested in apartments than units (which include townhouses) and in new sales than the average price. In practice, data anomalies are of comparable, if not more, importance. We adjust the data to provide estimates of the average price of new apartment sales in 2018, shown in row 2.[3] The multiple filters and adjustments are explained in Appendix A.1. Several of the individual adjustments raise or lower prices by a few per cent, and hence affect overall conclusions for Brisbane but not Sydney or Melbourne. In net terms they tend to be offsetting. As can be seen in Table 2, our final estimates are quite similar to the original data.
| Sydney | Melbourne | Brisbane | |
|---|---|---|---|
| Unfiltered average unit price (2016) | 884 | 578 | 475 |
| New apartment prices (2018) | 873 | 588 | 470 |
| Note: Data sources, details and estimates are explained in Appendix A | |||
Our main data source for costs is the ABS Building Activity Survey. The ABS has published estimates of average construction costs for apartments by state in 2017/18 in ABS (2019a), reproduced in row 1 of Table 3. We use unpublished estimates for major cities, adjusted to be in 2018 prices, shown in row 2.[4] These data are somewhat volatile, in part because building height varies from year to year. As it is expected costs that affect building decisions, we smooth through the data as discussed in Appendix A.2 and focus on predicted average cost, shown in row 3.
| NSW/Sydney | Victoria/Melbourne | Queensland/Brisbane | |
|---|---|---|---|
| Average state construction cost (published, 2017/18) | 342 | 310 | 312 |
| Average capital city construction cost (2018) | 323 | 295 | 285 |
| Predicted average construction cost (2018) | 340 | 312 | 287 |
| Marginal construction cost(a) | 364 | 350 | 316 |
| Professional fees (3 per cent of total costs) | 12 | 12 | 11 |
| Marketing and sales (5 per cent) | 20 | 20 | 18 |
| Finance (7 per cent) | 29 | 28 | 26 |
| Developer's margin (17 per cent)(b) | 74 | 71 | 64 |
| Infrastructure charges(c) | 18 | 10 | 26 |
| Total cost of building up(d) | 519 | 491 | 460 |
|
Notes: Sources for most entries are discussed in the accompanying text, with further details in Appendix A |
|||
The average cost estimates include the cost of building the primary structure, GST, the cost of constructing internal parking, foyers and other common areas, architect fees and builder's margins. They exclude costs of land acquisition and preparation, demolition and moveable furnishings. We suspect that some costs are not included by survey respondents such as legal and management fees, marketing costs and infrastructure contributions. We add these to the totals presented in Table 3, based on the estimates in Urbis (2011) and CIE (2011). These are reports by industry consultants commissioned to examine the cost of supplying housing. We have crosschecked these estimates with financial statements from developers and – with a few qualifications discussed in later sections – they line up. Two more important adjustments, the costs arising from increased height and developer's margins, are discussed in the following subsections. The final row of Table 3, the total cost of building up, is also shown in Table 1.
4.2 The Role of Building Height
Extra apartments can be supplied by raising the height of future buildings. This increases average costs due to a need for stronger reinforcing, more space for lift wells and extra safety requirements. Partially offsetting these, larger construction projects benefit from economies of scale such as specialisation in labour and machinery and the sharing of utility connections, walls and other fixed costs. Some of these factors might be expected to give rise to discontinuities – for example, sprinklers are required in buildings above three storeys (FPAA 2018) – but these are not evident in our data. The relationship between height and costs is a major determinant of housing density, and the data surprise some readers, so we discuss this in some detail.
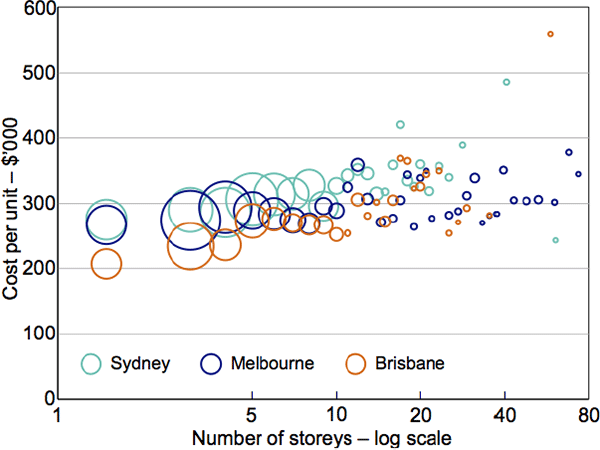
Figure 2 shows average construction cost per apartment for different building heights for our three cities from 2013 to 2018. The data are an unpublished disaggregation of the average capital city construction cost estimates in Table 3, discussed in ABS (2019b). The size of each circle reflects the number of building completions at each height. The horizontal axis is on a log scale, to focus on shorter buildings, which are more numerous. Three important relationships are clear:
- Average construction cost does not change much with building height. So large increases in housing are possible without a substantial increase in the cost of supply.
- Nevertheless, there is a small positive correlation. Apartments do tend to become a bit more expensive to supply as building heights increase.
- It costs slightly more to build apartments in Sydney than in Melbourne, followed by Brisbane.
We summarise these relationships with the following rule of thumb:
where the base cost is $316,337 for Sydney, $273,450 for Melbourne and $258,470 for Brisbane. These estimates are from a regression of the 85 observations (representing 3,732 buildings) plotted in Figure 2.[5] The regression sample is 2013–18; we scale the coefficients to 2018 prices using changes in the other residential producer price index (PPI). We have relatively few tall buildings in Sydney or Brisbane. For example, in Sydney fewer than 1 per cent of apartment building completions in our sample are above 30 storeys. Accordingly, we assume that costs in Melbourne provide a guide to what tall buildings would cost in Sydney or Brisbane. Specifically, we constrain the slope coefficients to be the same, though intercepts are allowed to vary. This constraint is significantly rejected, but extrapolating unrestricted coefficients would imply large differences in costs of very tall buildings across cities which would be inconsistent with other data sources, such as Rider Levett Bucknell (2017). Moreover, similar slope coefficients would be expected given that construction techniques, architectural design and the cost of labour and materials are similar across cities. We weight the regression observations by the number of buildings, on the assumption that each building provides an independent observation on the relationship. We show some alternative specifications in Appendix E. A regression that is unweighted or weighted by the number of apartments would have a flatter slope. Excluding the tallest buildings would increase the slope estimate slightly, but this approach seems like ignoring relevant information.
Source: ABS (unpublished)
A more complicated model could allow for the possibility that apartment characteristics vary with building height. If these characteristics also varied with costs then our slope coefficient would be biased. Apartment size, as measured by gross floor space per apartment, is weakly correlated with building height and is not statistically significant when included in our regression (p-value = 0.99). We do not have good data on how costs might vary with location or other dimensions of quality. We expect that future research using information on building characteristics could develop a more detailed model.
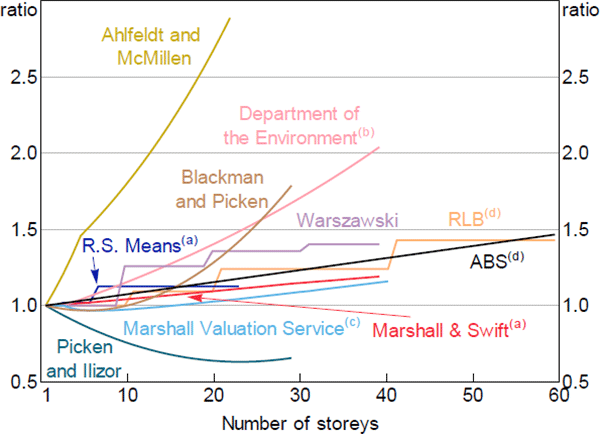
Figure 3 compares our estimates with others. The thicker black line labelled ABS is an unweighted average of our estimates for Sydney, Melbourne and Brisbane. Alternative estimates come from a range of countries and are estimated with different methods. The ABS figures appear to be broadly in line with most of these other data sources. Most importantly, they are close to the estimates from Rider Levett Bucknell (the orange line, labelled RLB), the other data source we have for Australia. The RLB estimates, like several others, hold quality constant.[6]
The flatness of the empirical cost profiles shown in Figure 3 contrasts with the steep profiles assumed in calibrated models of urban structure. For example, in an Alonso-Muth-Mills model of Australian cities, Kulish et al (2011) assume, following the international literature, that the elasticity of housing production with respect to the capital-to-land ratio is 0.6. Given some simple assumptions, that implies the average cost of supplying an apartment increases by 6.7 per cent with every 10 per cent increase in height, which would be steeper than any of the empirical estimates in Figure 3. These models may be attributing the flat, sprawling nature of our cities to unrealistically high costs of building up instead of to planning restrictions. (Though Kulish et al also find planning restrictions to have large effects).
The cost schedules in Figure 3, or marginal costs derived from them, can be interpreted as representing a relatively flat short-run supply curve for apartments in the absence of planning restrictions. We discuss this interpretation further in Section 8. In contrast, empirical estimates of the actual supply of apartments find it to be highly price inelastic. For example, Saunders and Tulip (2019, Figures 4 and 7) estimate that a sustained 10 per cent increase in price would temporarily boost construction of high-density housing by 30 per cent. However, this response is short-lived and the housing stock only increases by 0.7 per cent. So the estimated medium and longrun price elasticity of supply is only 0.07 (not a typo). Planning restrictions do not prevent all building, but they do make it much less responsive to relative prices than it would be otherwise.
Notes:
(a) As cited in Glaeser et al (2005)
(b) As cited in Seeley (1976)
(c) As cited in Arnott and MacKinnon (1977)
(d) Simple average of Sydney, Melbourne and Brisbane construction costs
Sources: ABS; Ahlfeldt and McMillen (2018); Arnott and MacKinnon (1977); Authors' calculations; Blackman and Picken (2010); Glaeser et al (2005); Picken and Ilozor (2003); Rider Levett Bucknall; Seeley (1976); Warszawski (2003)
Multiplying Equation (1) by the number of apartments then differentiating gives marginal construction cost, the cost of supplying an extra apartment by adding a storey:
We evaluate Equation (2) at the trend building height of the average apartment.[7] In 2018 this was 10 storeys in Sydney, 17 in Melbourne and 13 in Brisbane. Evaluation at this point gives consistent comparisons with the price of the average apartment and the cost of building out in Section 6. Estimates are shown in row 4 of Table 3.
We allow construction costs to increase with height and assume that most other costs (with the exception of infrastructure charges) increase in proportion. Finance and equity costs should arguably increase more than proportionately, reflecting the longer construction time and complexity of taller buildings. Offsetting this, sale prices also increase with height. We suspect the net effect of these complications is small and we ignore them.
4.3 Financing Costs and Developer's Profit
Construction cost estimates above are for the ‘tender price’ and include builder's margins. Table 3 makes additional allowances for interest and developer's margins. These returns reflect compensation for the risks taken by creditors and equity holders respectively. (It is often convenient to combine returns to equity and debt because there are large variations in leverage among developers). The risks (and hence profit) are greater for spending on land than for spending on the structure. Land is often purchased when planning approval, demand conditions and so on are uncertain, so is highly speculative. In contrast, construction spending occurs after legal permission to build has been granted and apartments have been pre-sold, so is less risky. Accordingly, we assume developer's margins are greater for land and hence building out than for building up.
Following industry discussions and the estimates in Urbis (2011, pp 42–44) and CIE (2011, p 40), we assume finance costs are 8 per cent of structure costs for ‘building up’ while developer's margins are 17 per cent.[8] These are larger estimates than the 15 per cent (covering both finance and equity) in Kendall and Tulip (2018), 10 per cent for developer margins in Kelly, Weidmann and Walsh (2011) or 10 to 14 per cent for developer margins in Hsieh, Norman and Orsmond (2012, Table 2). Based on industry discussions, we assume finance adds 10 per cent and equity 25 per cent to the cost of land acquisition. Several industry participants use a rule of thumb of 20 or 25 per cent of total costs (both land and construction) for developer's margins, which fall between our estimates for land and structures. This rule of thumb is often used in residual land valuation, discussed in Appendix B.
Returns to finance and equity is perhaps the element of costs with the greatest uncertainty. Part of the difficulty is quantification, given the absence of broad-based evidence and the variety of industry estimates. This is especially difficult as the relevant measure for our purposes is ex ante or planned returns, not the ex post or actual returns that are often documented. The greater difficulty is conceptual. To what extent are these costs separate from the effect of planning restrictions?
Many developers argue that the risks in housing supply (and, by implication, compensation for those risks) should be attributed to the planning system. A major source of losses is rejection of development proposals after property has been purchased at prices that reflected a positive probability of approval. Profits need to be high on completed projects to compensate for these losses. CIE (2011, p 46) suggest that, based on estimates for the United States, a less risky planning environment could reduce margins by about 5 percentage points. Moreover, the delays in gaining approval substantially increase financing costs.
Glaeser et al (2005) assume that developer's margins should not be counted as a cost of supply. They argue that the planning system generates large rents which are dissipated in efforts to get around them. It is not clear that losses incurred on lobbying or on rejected rezoning applications represent social costs or resources requiring compensation. Rather, rent-seeking expenses represent part of the effect of planning restrictions on housing prices.
In principle, developers also require compensation for bearing the risks of variations in demand and costs. Unexpected variations in demand are typically small relative to uncertainty about planning. Most apartments are pre-sold before construction, with buyers putting down deposits of around 10 per cent. A small share of these fail to settle (RBA 2019). The cost of these failures is initially borne by buyers forfeiting their deposit. Developers make losses when prices fall by more than deposits, but this is infrequent. Likewise, cost overruns are a smaller risk than they may appear. The ABS estimates of construction costs are for actual – not planned – expenditures so include the average overrun. While uncertainty about overruns creates a risk that requires compensation, this is a primary role of the builder's margin, which is also in the ABS estimate.
In short, we consider our assumptions, especially the 17 per cent developer's margin for building up, to be generous. Some industry contacts suggest a lower margin for construction costs and a higher margin for land costs might be realistic. That would further strengthen our main conclusions, so our results may be conservative. We are also told, but are unable to quantify, that margins are substantially higher in Sydney than in Brisbane. More research and data on this topic would be useful.
Footnotes
2018 is the most recent period for which we have many disaggregated data series. [3]
We are very grateful to Bill Becker and Daniel Rossi of the ABS for their assistance in providing this data and helping us with its interpretation. The ABS data we use – both published and unpublished – are available in the supplementary information published with this paper. [4]
The ABS data are generally available at an individual storey level up to 20 storeys. Beyond this height, buildings are grouped into larger categories to preserve confidentiality and we use the midpoint of the range. [5]
Some other comments. Picken and Ilozor (2003) for Hong Kong and Blackman and Picken (2010) for Shanghai contain substantial literature reviews, including discussion of papers we do not show. We estimate costs increase slightly faster than estimates for Manhattan by R.S. Means and Marshall & Swift discussed in detail by Glaeser et al (2005). However, their estimates of marginal cost are much higher, reflecting the lower height of Australian buildings. Ahlfeldt and McMillen (2018, Table 5) is high profile and thorough, however, their focus is on super-tall skyscrapers. Their estimates for small and moderate buildings are from a large international survey that we suspect is heterogenous: taller buildings within a country are more likely to be built in relatively expensive cities. The Department of Environment (Seeley 1976) rule of thumb that costs increase by 2 per cent per floor is widely cited, but old. Warszawski's (2003) engineering-based estimates assume that buildings above 10 storeys need to provide undercover parking whereas shorter buildings do not. In contrast, our ABS estimates reflect actual expenditure on undercover parking. [6]
This admittedly awkward expression represents the average building height when weighted by the number of apartments. It is substantially higher than the unweighted average building height because more apartments are in taller buildings. [7]
Taking unweighted averages across the three cities, Urbis estimates that finance and profit comprise 8 per cent and 17 per cent respectively of total costs, while CIE estimates 7 per cent and 17 per cent. [8]