RDP 2019-11: China's Evolving Monetary Policy Framework in International Context 5. Monetary Policy Transmission
December 2019
- Download the Paper 358KB
The transmission of monetary policy is heavily influenced by the structure of the economy, the stage of development of the financial system, and as earlier discussed, the nature of institutional arrangements. Empirical analysis of the transmission of monetary policy in China is made difficult by various issues. Included among them are changes in the use and emphasis of targets and instruments; the framework comprising elements of both a quantity- and a price-based system and the associated difficulties in capturing the suite of monetary policy shocks; and short sample periods in which to assess their impact. With these limitations in mind, the analysis below seeks to take stock of the main features of the transmission of China's key price and quantity target variables (principally interbank repo rates and M2 respectively) through to macroeconomic and financial outcomes. We begin by highlighting some simple statistical features of the data before turning to a more formal treatment of monetary policy transmission in a structural vector autoregression (SVAR) framework. To the extent possible, emphasis is placed on how transmission channels have evolved over time.
5.1 Transmission of Money Supply and Interest Rate Shocks: Preliminary Analysis
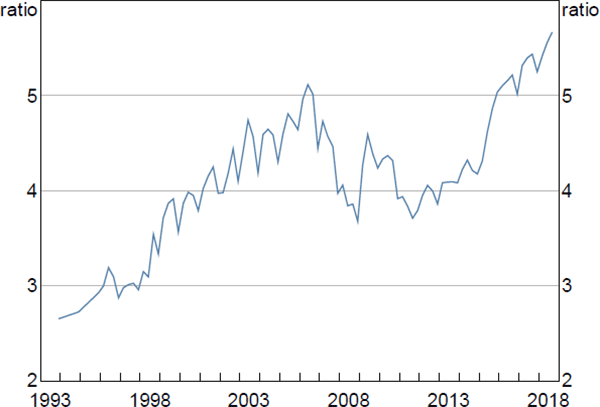
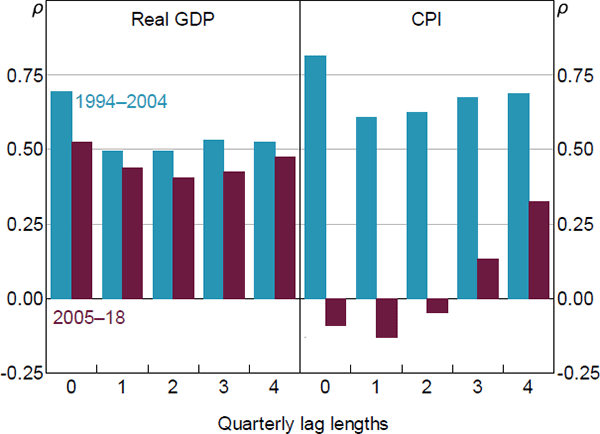
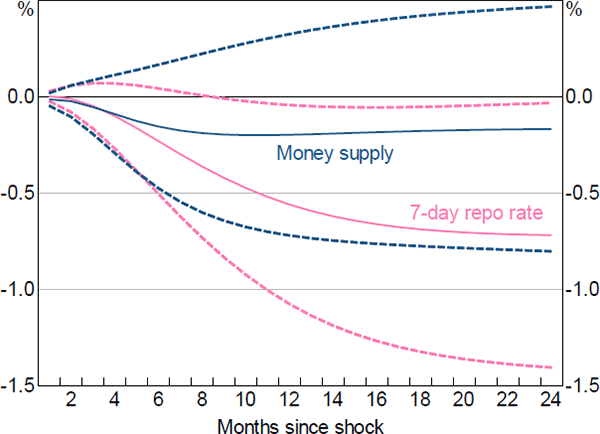
To be effective, the operational targets of a central bank need to be controllable and display a reliable relationship with intermediate targets. Money base targeting in China was first employed in 1984, but started to raise concerns in the mid 2000s as the relationship between it and broader monetary aggregates started to become more unpredictable (Figure 8). It was also around this time – when financial liberalisation accelerated and the hard US dollar peg was abandoned in favour of a managed float – that the relationship between money supply and both activity and inflation outcomes started to be called into question (Figure 9).
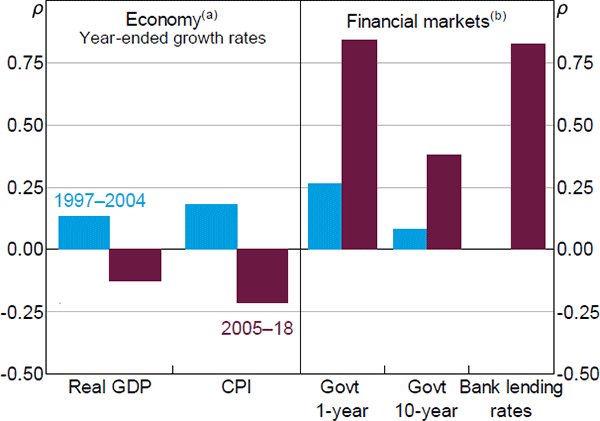
In contrast, cursory correlation analysis suggests that the relationship between the price-based operational target – 7-day interbank repo rates (hereafter repo rates) – and economic and financial outcomes may have strengthened somewhat over time. Higher repo rates now generally appear to be associated with lower subsequent GDP growth, lower CPI, higher bond yields and higher bank lending rates (Figure 10).
Note: M2 multiplier is calculated as M2 divided by reserve money
Sources: Authors' calculations; CEIC Data
Sources: Authors' calculations; CEIC Data
Notes:
(a) Economic variables are lagged by six quarters
(b) Correlation analysis with government bond yields is estimated from 2002, and bank lending rates from 2008, due to data availability
Sources: Authors' calculations; Bloomberg; CEIC Data
Nevertheless, simple regression analysis suggests that the transmission of changes in the repo rate through to bank lending rates remains constrained (Figure 11; Table 9). Only around one-quarter of the change in repo rates is passed through, and this reduces by half (and becomes marginally statistically significant) after controlling for the impact of benchmark lending rates.[36] Discussed in more detail below, this tentatively suggests that while repo rates have become a more important component of the Chinese financial system, interest rate pass-through remains a work in progress. Indeed, the PBC announcement that it was replacing benchmark loan rates with the LPR as the reference rate for new bank loans in late 2019 was motivated in part to improve the transmission of repo rates to bank lending rates.
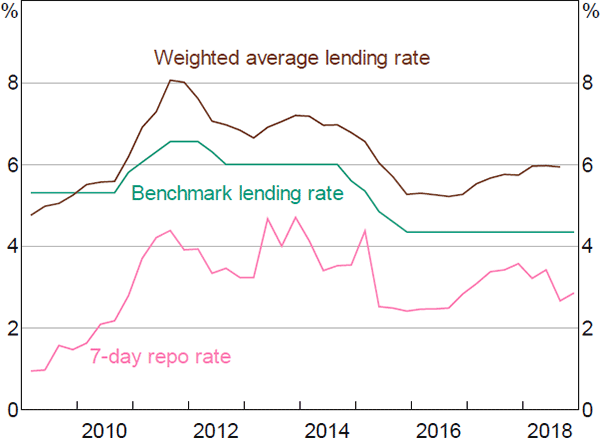
Note: Based on the 1-year benchmark lending rates and quarterly average 7-day repo rate
Sources: CEIC Data; RBA
| Baseline | With benchmark rates | |
|---|---|---|
| 7-day interbank repo rates | 0.24*** (0.07) |
0.12* (0.06) |
| Benchmark lending rates | 1.03*** (0.22) |
|
| Bank lending rates (t – 1) | 0.39*** (0.07) |
0.13 (0.11) |
| Constant | 0.01 (0.04) |
0.04 (0.03) |
| Adjusted R squared | 0.39 | 0.62 |
|
Notes: ***, ** and * denote statistical significance at the 1, 5 and 10 per cent level, respectively; standard errors are in parentheses Sources: Authors' calculations; CEIC Data |
||
5.2 Transmission of Money Supply and Interest Rate Shocks: A SVAR Approach
Our analysis uses the SVAR framework as it can account for some endogenous relationships and summarise empirical relationships without requiring an extensive set of restrictions to be imposed on the structure of the model. Impulse responses are assessed to draw out the relationships implied by the large number of estimated coefficients in the SVAR, and more specifically, to identify how shocks to key monetary policy variables transmit through to macroeconomic and financial outcomes in China.
In relation to the existing literature, our methodology is most similar to Kim and Chen (2019), who examine interaction effects of different monetary policy instruments and their effect on the broader economy. But our analysis differs in a number of ways: our sample is longer and includes more recent data, the empirical results are tied back to the earlier analysis of China's institutional arrangements, our model focuses on the key PBC price- and quantity-based target variables (making identification more straightforward), and we also add a larger range of controls (including for commodity prices, the exchange rate and the US federal funds rate). These controls speak to the value that the PBC places on ‘keep[ing the] RMB exchange rate basically stable at an adaptive and equilibrium level’ (Yi 2018a). Reflecting that model results can be sensitive to assumptions, we also perform a range of robustness checks and extend the baseline model in various ways.
The topic of monetary policy pass-through in China has attracted growing interest from researchers in recent times, but differences in methodology and/or emphasis limits the applicability of some of this analysis to the present paper. For instance, other studies consider the effect of various types of monetary policy instruments on the economy, but do not allow for interactions between them (Harjes 2017). Fernald et al (2014) employ latent factors to represent estimates of activity and inflation, reflecting some of the difficulties in dealing with smoothed and missing Chinese data. However, their shorter sample (2000–13) precludes analysis of how transmission has evolved over time and they focus much attention on reserve requirements as a policy tool which have instead been viewed by the authorities principally as a foreign exchange sterilisation instrument (reflected in their sustained uptrend in the decade from 2003, when reserves were growing rapidly, and sustained downtrend since, following the peak in reserve holdings).[37] Kamber and Mohanty (2018) examine monetary policy transmission in China through an event study by constructing a monetary surprise series using changes in China's interest rate swap (IRS) market in order to focus on the impact of certain types of monetary policy shocks. However, by its construction, this approach is focused exclusively on interest rate movements (just one element of monetary policy in China) and the results pertain to a shorter sample period (2004–16) as a result of the IRS market only commencing in 2004 (it was not until late in this period that trading activity in these instruments accelerated). Others create synthetic indices in an effort to aggregate various aspects of monetary conditions into a single measure (Sun 2015; Girardin et al 2017). This acknowledges that changes to the stance of monetary policy in China can take different forms. However, it also requires significant assumptions to be made when translating policy changes of various forms and magnitudes into comparable standardised units (interest rate basis points), and in any case is less relevant to the present analysis given we are most interested in comparing the impact of price (interest rate) and quantity (money supply) shocks on macroeconomic and financial outcomes over time.
5.2.1 Data
Monthly data spanning the October 1997 to December 2018 period are used in the SVAR model. Data limitations restrict a longer time horizon, with the repo rate only available from 1997. The following variables are included in the baseline set-up:
- Domestic economic activity – this is proxied by real industrial production (IND, as it tracks real GDP data closely while the latter are only available on a quarterly basis), headline inflation (CPI), and bank credit (CRED, as it provides an important conduit between fiscal policy, banking conditions and the domestic economy). Industrial production, inflation and bank credit are standard inclusions in macroeconomic SVAR models, and all are included in seasonally adjusted terms.
- Target variables – the price-based operational target is proxied by the daily average of the 7-day interbank repo rate (which includes bank and non-bank transactions using a variety of collateral) measured over one month (R007).[38] The primary quantity-based target is represented by M2 growth in line with the existing literature, but in robustness checks, base money is also included.[39] The inclusion of bank credit can also be considered analogous to a target variable (‘reference indicator’) in China's monetary policy context.
- External sector – the nominal trade-weighted exchange rate index (TWI) is included to capture the interaction of the exchange rate and domestic monetary policy. The exchange rate has served as a nominal anchor in China and continues to feature prominently in the characterisation of overall monetary conditions. International commodity prices are also included (COMM), captured by the well-known CRB index, as they can contain information about the global business cycle (to which China is linked) and can have implications for Chinese inflation given China's role as a significant importer of commodities. The inclusion of international commodity prices has also been found to help solve the ‘price puzzle’ in SVARs, in that the price level tends to increase in response to a contractionary monetary policy shock (e.g. Christiano, Eichenbaum and Evans 1998).
Discussed in more detail below, this baseline set-up is subsequently augmented or extended with other variables, including: total social financing (in place of bank credit), fiscal expenditure, house prices, the GDP deflator (in place of the CPI), base money, benchmark lending rates, and the US federal funds rate.[40]
5.2.2 Model set-up
Structural shocks in a SVAR can be identified by placing restrictions on contemporaneous relationships. Previous studies and stylised facts are used to determine the identification restrictions outlined in this section. The restrictions placed on the contemporaneous relationships among the variables included are shown in Equation (1), which is the left-hand side of the standard SVAR representation.
The non-zero coefficients bij indicate the variable j affects variable i instantaneously. For example, b21 captures the contemporaneous impact of industrial production shocks on the consumer price index. The coefficients on the diagonal are normalised to one, while the zero coefficients indicate that those entries in the matrix are constrained to be zero.
The main features of the restrictions are as follows. Industrial production and inflation are assumed to respond to monetary policy variables and the exchange rate with a lag, reflecting that firms do not instantaneously change their output and price in response to unexpected changes in monetary policy due to inertia and adjustment costs (e.g. Sims and Zha 2006). Credit is assumed to respond to industrial production, inflation and the repo rate contemporaneously. As the repo rate reflects the opportunity cost of holding money, economic agents are assumed to respond quickly to changes in this cost. Credit does not respond contemporaneously to M2 as shocks driven by say changes in the reserve requirement ratio will likely take longer than one month to filter into increased credit supply. The factors that are assumed to contemporaneously impact credit are also assumed to apply to M2, as money is created through a rise in credit in a fractional reserve banking system. Conversely, the 7-day repo rate is assumed to only respond to changes in domestic financial variables as policymakers don't have access to information on industrial production, inflation, credit or money supply within a given month. International commodity prices are assumed to respond to Chinese economic data given China's role as a significant source of demand and importer of worldwide commodities. Finally, the exchange rate is assumed to respond contemporaneously to all variables, as is common in SVAR models.[41]
The remaining elements of the estimation approach are as follows. The model is estimated using two lags and a constant term, as guided by lag length criteria tests.[42] Unit root tests suggest that most of the variables included in the model are integrated of order 1.[43] We transform variables into log differences and multiply them by 100 to produce growth rates, with the exception of interest rates which are entered into the model in levels, as these transformations can help reduce the possibility of spurious relationships and are more aligned with the targets set by authorities (which are typically expressed in growth rate terms).[44] Standard errors for the impulse response functions are calculated using the Monte Carlo method.
5.2.3 Impact of monetary policy shocks on macroeconomic outcomes: full sample results
Figure 12 displays the cumulative impulse responses to a one standard deviation shock to the repo rate and money supply growth. The monthly units approximate the cumulative percentage impact on the growth of each variable, with the exception of the repo rate which shows the percentage point deviation from the baseline. The results are as follows:
- Repo rate – a one standard deviation (upward) shock to the repo rate (equivalent to around 50 basis points) is shown to generate directionally intuitive results: it is associated with lower subsequent growth in industrial production, lower inflation (but only with a lag of two years), lower credit growth (with most of the impact felt in two years), lower money supply growth and a persistent appreciation of the exchange rate. In numerical terms, industrial production and money supply are 0.5 and 0.4 percentage points lower after two years and the impact is statistically significant.[45]
- Money supply – the macroeconomic effects stemming from a one standard deviation shock to money supply growth (equivalent to 0.55 percentage points) are generally more mild (smaller and/or less persistent) relative to repo rates. Positive money supply shocks appear to have no impact on inflation, the exchange rate or repo rates, and a positive but statistically insignificant impact on industrial production and credit in the medium-to-long run.
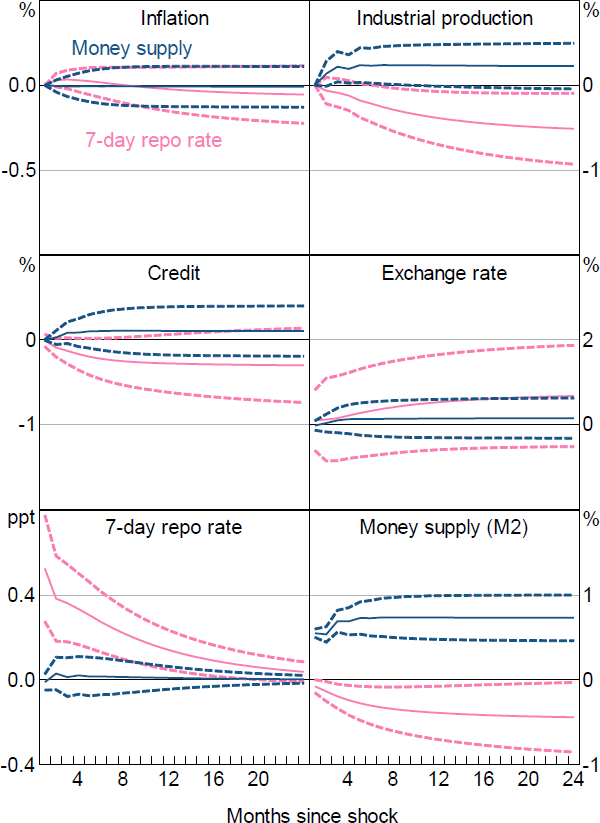
Notes: Dashed lines show respective 95 per cent confidence intervals; impulse response shown for the 7-day repo rate
5.2.4 How the impact of monetary policy shocks has evolved: split sample results
To examine whether the transmission of shocks has changed over time, the data are split into two sub-periods of equal length: 1997 to 2008 and 2009 to 2018 (Figures 13 to 15). Alongside repo rate and money supply growth shocks, we also report the impact of credit growth shocks given the more expansive role of credit in the economy since the global financial crisis and the attention that the release of credit growth figures has since attracted from market participants partly as a proxy for fiscal policy in China.
The main results are as follows:
- Repo rate (Figure 13) – in the most recent sub-period, upward shocks to the repo rate are associated with a stronger (contractionary) impact on credit and money supply growth, with most of the impact occurring in the first two years. The repo rate itself reverts faster to the baseline in the most recent sub-period. The impact of repo rate shocks on inflation, industrial production and the exchange rate appear little changed over the two sub-periods.[46] The impact on industrial production remains negative, though not statistically significantly so.
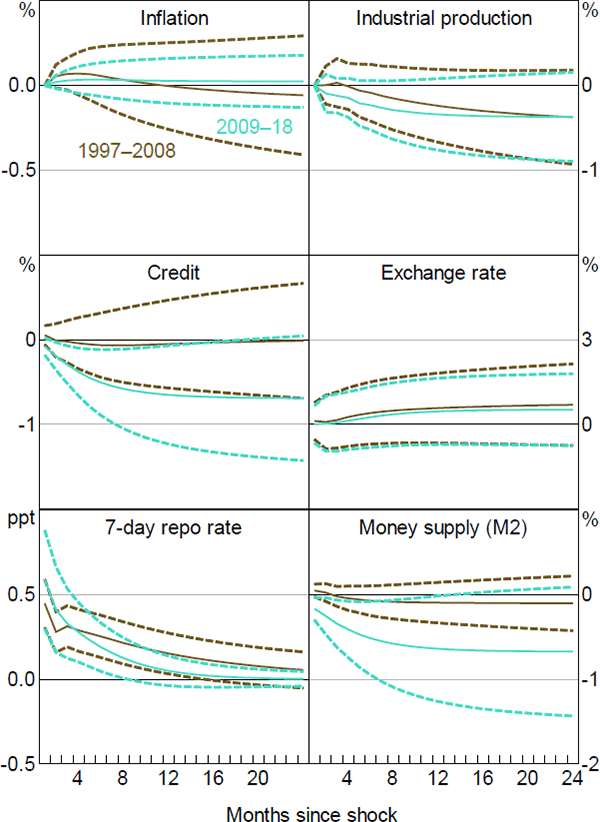
Notes: Dashed lines show respective 95 per cent confidence intervals; impulse response shown for the 7-day repo rate
- Money supply (Figure 14) – there appears to be little impact from money supply shocks on inflation, industrial production, the exchange rate and the repo rate in either period. The impact on bank credit has strengthened somewhat, with most of the effect felt in the first six quarters.
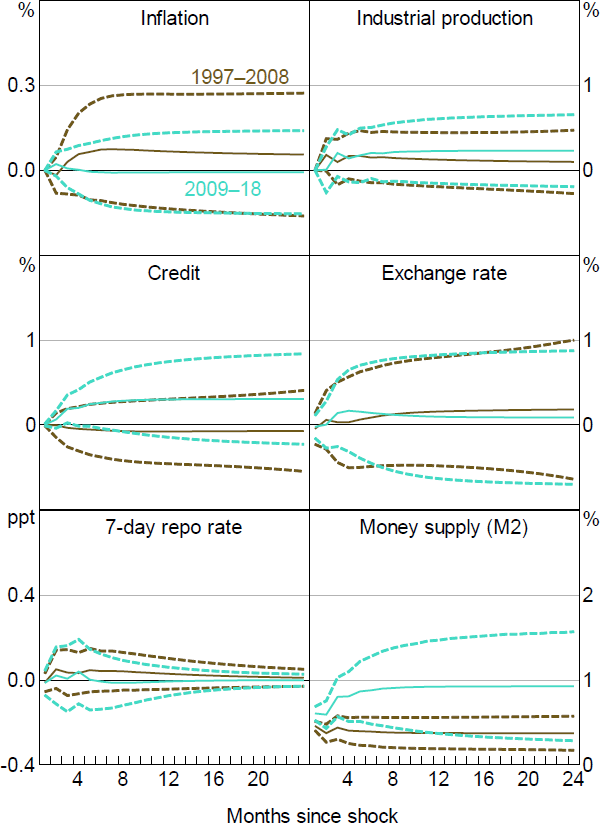
Notes: Dashed lines show respective 95 per cent confidence intervals; impulse response shown for the 7-day repo rate
- Credit growth (Figure 15) – as with repo rate and money supply shocks, the impact of shocks to credit growth on inflation appears economically and statistically insignificant. The transmission through to industrial production and money supply has however picked up over time, possibly reflecting the significant increase in leverage in the Chinese economy since the global financial crisis.
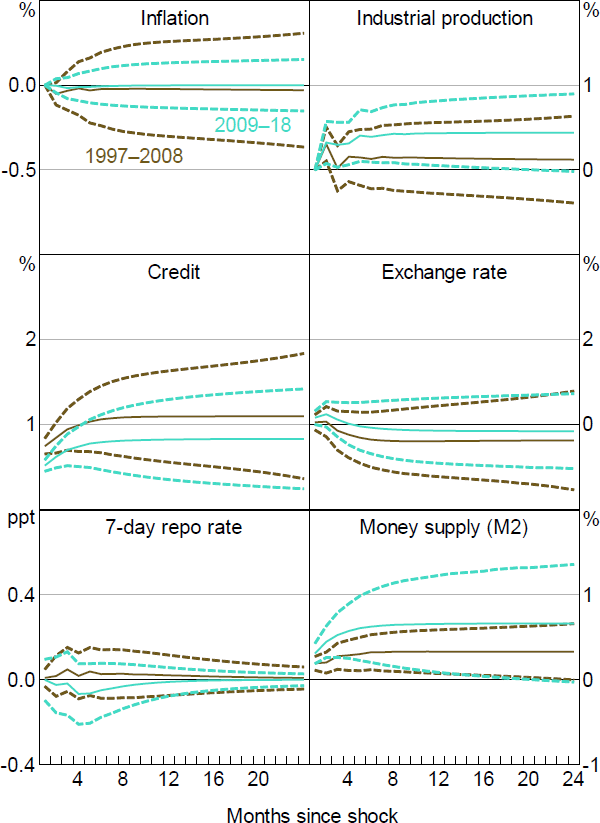
Notes: Dashed lines show respective 95 per cent confidence intervals; impulse response shown for the 7-day repo rate
5.2.5 Impact of monetary policy shocks on the bond market
The experience in advanced economies has generally demonstrated that a well-developed bond market provides an important conduit through which changes in monetary policy can flow through to financial markets, and ultimately, the broader economy. We examine how this transmission channel has evolved over time in China by extending the baseline SVAR model to assess the impact of changes in repo rates and money supply (M2) growth on 1-year, 5-year and 10-year maturity central government bond yields (expressed as the monthly average of daily yields).[47]
The main results are four-fold. First, the pass-through of repo rates to bond yields is larger compared with money supply shocks (Figure 16). Second, in terms of magnitude, the impact has become more pronounced in the most recent sub-period. Third, in economic terms, the degree of pass-through is still modest compared to industrial countries (Ma 2017). Fourth, as in Kamber and Mohanty (2018), the impact of repo rate shocks is strongest at the front end of the yield curve, consistent with standard term structure theories of interest rates which provide for larger term premia in longer-maturity bonds.
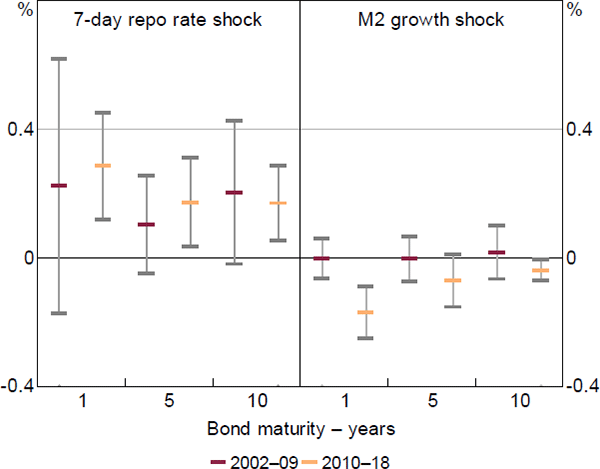
Note: Grey bars show 95 per cent confidence intervals
5.2.6 Impact of monetary policy shocks on house prices
As in all countries, developments in the residential housing market attract close scrutiny from Chinese policymakers owing to their potential implications for the macroeconomy and financial stability. While a thorough treatment of this issue is beyond the scope of the paper, we undertake a brief assessment of the impact of monetary policy changes on house prices by extending the baseline SVAR model to include a new residential price index over the June 2005 to December 2018 period (this relatively short sample precludes splitting the data into sub-periods).[48]
The results suggest that a one standard deviation shock in the repo rate (equivalent to a 0.6 percentage point increase) has an impact on house price growth that is statistically significantly negative from two to four years, while money supply shocks of the same size have virtually no impact (Figure 17). In economic terms, the impact of a repo rate shock is equivalent to less than 1 percentage point on housing price growth. These findings, which are broadly consistent with those reported in Kim and Chen (2019) despite differences in methodology, imply that repo rate adjustments (along with other measures) may have a countercyclical role to play in stabilising swings in the housing market, consistent with the PBC's recently strengthened financial stability mandate.
Note: Dashed lines shows respective 95 per cent confidence intervals
5.2.7 Robustness checks, extensions and limitations
We next consider a range of robustness checks and extensions in assessing the role of repo rate and money supply changes in the transmission of monetary policy in China. Broadly speaking, the original results reported above were little changed. Identification assumptions and detailed results arising from the robustness checks and extensions are presented in Online Appendices B and C.
To gauge the sensitivity of the initial results to the baseline model set-up, a range of robustness checks were performed including alternative identification assumptions,[49] the use of an additional lag and the addition of a global financial crisis dummy spanning the September 2008 to August 2009 period. None of these checks yielded a material change to the results reported for the baseline model.[50]
The baseline model was then augmented with different variables, with bank credit replaced with a broader measure of financial conditions represented by total social financing (TSF), and CPI inflation replaced with the implicit GDP deflator.[51] The initial results are qualitatively unchanged when TSF takes the place of bank credit. In the case of the GDP deflator replacing the CPI, money supply shocks continue to have few implications for activity or asset prices, but a repo rate shock now appears to be associated with a negative impact on the deflator (this was not the case for the CPI).[52] We caution, however, against overstating the latter result. First, it could be impacted by measurement issues beyond just that the volatility of the deflator is depressed and is much lower than the CPI (partly due to it being linearly interpolated into a monthly series for our purposes).[53] Second, and of more relevance, to the extent that the authorities care about inflation as a monetary policy objective, it is the CPI, not the implicit GDP deflator measure that serves as the operational target and therefore matters most in terms of monetary policy transmission.
The baseline model is also extended in several ways. In recognition of the difficulty associated with accurately capturing the stance of monetary policy in China, we assess whether the initial results reported for the repo rate and M2 growth are materially altered after incorporating additional quantity- and price-based measures in the baseline SVAR. This is achieved through the inclusion of base money (over which the PBC has more direct control than M2 and may reflect RRR adjustments) and benchmark lending rates (which our preliminary analysis suggests still has a significant impact on bank lending rates). In short, the earlier described transmission of shocks from the repo rate or M2 growth to asset prices, activity and inflation does not appear to be affected by the inclusion of bank reserves or benchmark lending rates in the expanded SVAR, and these variables themselves to do not appear to have an effect on industrial production or inflation (see Figure 18 and Online Appendix C for more details).
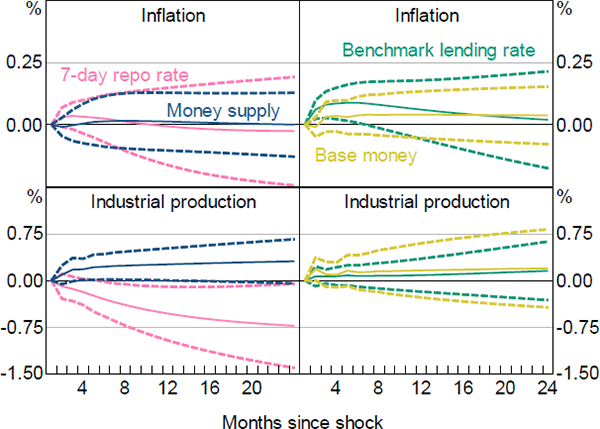
Note: Dashed lines show respective 95 per cent confidence intervals
We also extend the baseline model via the inclusion of monthly government expenditure (to allow for fiscal developments to be captured at a timely frequency), and separately include the US federal funds rate to account for international monetary conditions and the evolution in the exchange rate regime over the sample. The earlier reported results were again little changed with the addition of these variables to the baseline SVAR.[54]
Nevertheless, we suggest a degree of caution is warranted when interpreting the econometric results given numerous data challenges in the Chinese monetary policy context. These challenges are not limited to the short sample period under review, the inherent difficulties in accurately capturing and disentangling changes in the stance of monetary and fiscal policy in China, and the near-constant state of change in the structure of the Chinese financial markets and wider economy.
5.3 Summary Discussion and Implications of the Empirical Findings
Observation 1: The pass-through of short-term repo rate shocks to asset prices and real activity appears stronger compared to money supply shocks
Changes to repo rates appear to be associated with stronger macroeconomic and financial transmission properties than changes to money supply. This is irrespective of whether the latter is measured as broad money (M2) or bank reserves, or whether the sample is broken into sub-periods. Repo rate pass-through appears strongest for the bond markets, followed by real activity and house prices. Money supply shocks seem mainly to affect the path of credit growth in our model.
A diminished role for money supply pass-through relative to short-term interest rates is consistent with the experience in advanced economies.[55] Indeed PBC officials have acknowledged that the decline in transmission between money supply and growth and inflation outcomes is not unique to China (e.g. Yi 2018a; Ma forthcoming). This is likely to reflect a confluence of factors, not limited to ongoing financial market development, increased flexibility in the exchange rate (affording the authorities more autonomy over the setting of interest rates) and refinements in the PBC's toolkit, including the introduction of an interest rate corridor system. These factors may also help to explain why in 2018, the authorities refrained from setting clear M2 growth targets for the first time in more than two decades. Despite differences in methodology and the sample period under review, these results for the repo rate are broadly consistent with those reported in Fernald et al (2014), Chen et al (2017), Harjes (2017) and Kamber and Mohanty (2018), who find that monetary policy is generally becoming more effective under an interest rate-based framework vis-à-vis the earlier emphasis on quantities.
Observation 2: While the transmission of short-term repo rates through bank credit channels has improved, impediments to pass-through remain
Despite the official liberalisation of bank lending and deposit rates in 2012 and 2015 respectively, the transmission of repo rate adjustments through bank credit channels remains a work in progress. Our analysis points to pass-through of less than one-quarter. By comparison, Gambacorta, Illes and Lombardi (2015) estimate that the pass-through of policy rates to bank lending rates in the United States is around 80 per cent. While a thorough treatment of this issue is beyond the scope of our analysis, there are a number of possible reasons for the modest degree of pass-through (see also Chen et al (2011); He and Wang (2012, 2013); Chen et al (2017); Chen and Kang (2018); Kamber and Mohanty (2018); Ma (forthcoming)):
- In China's ‘dual-track’ interest rate system, financial market-based interest rates still diverge from bank deposit and lending rates as the latter have been anchored by official benchmarks set by the State Council (albeit this may diminish going forward as benchmark rates were replaced with the LPR as the reference rate for bank loans in late 2019).
- Borrowing rates for state-owned enterprises and local governments may not be particularly sensitive to bank-based or financial market-based interest rates. That is, implicit guarantees introduce a soft borrowing constraint for the two largest sets of borrowers in China.
- The mortgage market was only introduced in 1997 and remains in the early stages of development. This means that a standard component of the monetary transmission mechanism in advanced economies has not yet had a significant effect in China.
- The flow of credit in China continues to be strongly influenced by the authorities' use of administrative guidance.
While some of these factors are likely to abate over time, it is reasonable to expect others will be more persistent owing to political economy considerations and the nascent stage of financial system development in China.
Observation 3: Recent inflation performance in China has been similar to advanced economies, while its monetary policy framework remains substantially different
While it remains difficult to disentangle how much of the improved inflation and growth performance recorded in advanced economies since the early 1990s can be attributed to instrument independence vis-à-vis the adoption of inflation targeting as a clear and ultimately effective nominal anchor, it is broadly accepted that both elements played a part. Furthermore, it is widely recognised that inflation outcomes are determined, at least in part, via the transmission of monetary policy. It is interesting to observe that while average inflation outcomes in China have been similar to a number of advanced economies (Figure 19), these outcomes have been generated in very different institutional contexts. For instance, the PBC does not have instrument independence, has not established a clear nominal anchor, and encounters material impediments to monetary policy transmission. The finding that CPI inflation is not significantly correlated with repo rates or money supply in China is broadly consistent with most of the related literature (see most recently, Kim and Chen (2019)), with the possible exception of Kamber and Mohanty (2018) who find stronger evidence of repo rate pass-through to the CPI excluding food series based on a shorter (post-2004) sample period.[56] Moreover, the recent Chinese experience might offer another example that price stability is possible in a variety of institutional set-ups, at least for a period of time where circumstances are most conducive.[57]
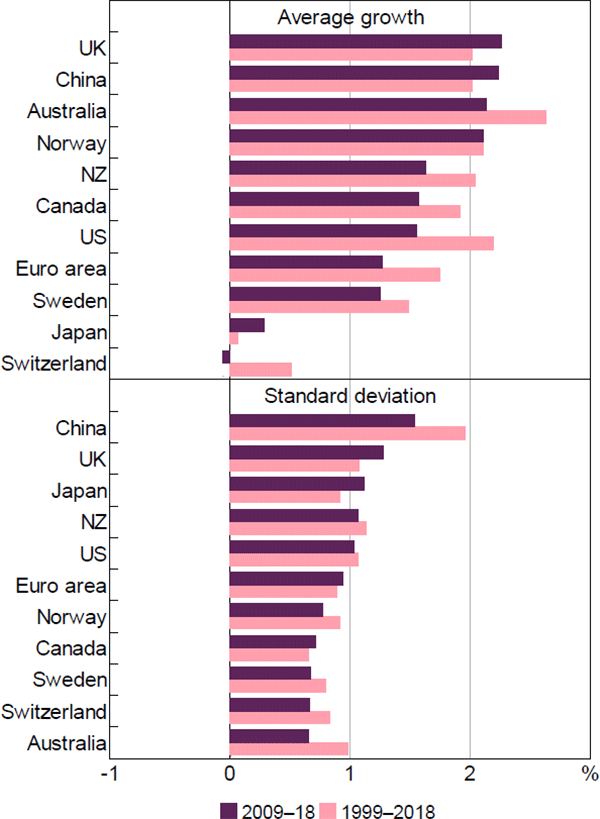
Note: Based on the average annual change in consumer prices
Sources: Authors' calculations; IMF
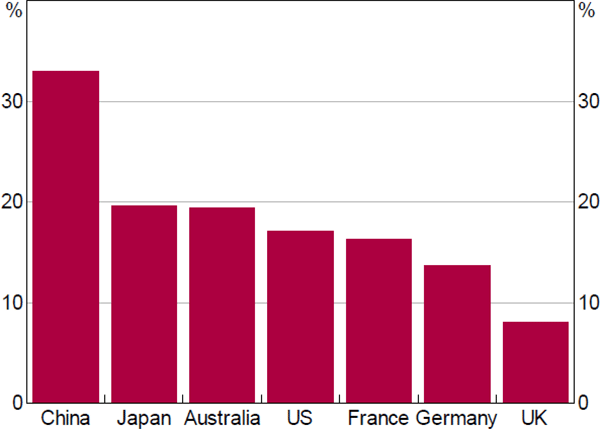
A forensic examination of this issue is beyond the scope of this paper, but to help stimulate further research, we offer two tentative explanations for China's ability to generate low and stable inflation outcomes. The first relates to the measurement of inflation in China, and in particular, the composition of China's CPI basket. Around one-third of the weight in China's CPI headline basket is comprised of administered prices. This is more than double the average weight (15.7 per cent) of administered prices reported across select advanced countries (Figure 20). As the government retains substantial powers over the setting of goods and services prices in China,[58] and can implement desired changes at relatively short notice, it may be possible to influence reported inflation outcomes in either direction. For instance, during the inflationary outbreaks of 2003–04 and 2007–08, the National Development and Reform Commission adopted temporary price controls on a range of agricultural products. More generally, the Chinese authorities have frequently responded to inflationary pressures by increasing their use of discretionary price controls (e.g. Geiger 2010). This might be effective in keeping inflation expectations anchored when the authorities use temporary controls to ‘buy time’ until an effective supply-side response can be initiated. This said, the international experience with price controls in the 1970s casts some doubt as to the amount of control that authorities can wield over the medium term, unless effective supply responses can be mobilised while price controls are in place.
Sources: Eurostat; RBA; Shintani et al (2016)
A second (and possibly more plausible) explanation relates to the coordinated whole-of-government response that can be efficiently mobilised in response to concerns over high inflation or deflation. Conducted largely through the State Council, the formulation of aggregate supply and demand management policies is more tightly coordinated compared with other economies. Fiscal, monetary, macroprudential, exchange rate, sectoral (including real estate) and national development policies can each be adjusted in a timely, reinforcing manner in support of desired inflation outcomes. If the prospect of high inflation and deflation is viewed by the authorities as sufficiently grave to warrant a swift countercyclical mobilisation of all the arms of government (including supply-side policies), it may be that standard incentive misalignment and commitment problems cited in the literature on central bank independence and inflation targeting may be less pressing in China's unique institutional setting. The Chinese authorities appear to have displayed both the willingness and the ability to deliver on the objective of low and stable inflation, albeit through different means than observed in advanced economies.
Footnotes
This is broadly in line with the results in Chen et al (2011) and Chen et al (2017). [36]
Our robustness checks also incorporate a different measure of inflation than the CPI (one of the intermediate targets for monetary policy), and issues with the construction of China's CPI (and how these might impact transmission) are discussed in Section 5.3. [37]
The 7-day interbank repo rate, which captures bank and non-bank repo activity (‘interbank’ is something of a misnomer), is considered highly informative in terms of reflecting the monetary policy stance of the PBC. This series is used in this study despite the PBC more recently targeting the repo rate exclusively between banks (where only risk-free collateral is used), as the former has a much longer sample. [38]
See Sims (1992) for the difficulties in econometrically disentangling the impact of shocks to money supply and money demand. [39]
See Online Appendix A for a list of the variables included in the baseline, augmented and extended models. [40]
The degree to which China's exchange rate has been determined by market forces has varied over time. [41]
Lag length is selected using Akaike information criteria (AIC). [42]
Kim and Chen (2019) estimate their SVAR model in log levels and found similar results. [43]
While estimating SVARs in log differences may increase the possibility of incorrect restrictions being imposed on the model, we account for this by conducting a number of robustness checks. [44]
A permanent response of industrial production to a temporary repo rate shock is somewhat surprising, albeit similar results were found by Harjes (2017) and Kim and Chen (2019). [45]
Cross-period comparisons on the exchange rate impact are complicated by the fact that the renminbi was pegged to the US dollar for much of the first sub-period. [46]
Consistent with the related literature, we assume that all domestic economic and monetary variables contemporaneously affect government bond yields but not the other way around. See Online Appendix B for details. [47]
We assume that all domestic economic and monetary variables contemporaneously affect house prices but not the other way around. See Online Appendix B for details. [48]
We consider an alternative identifying assumption so that identification follows a lower triangular matrix (a simple Cholesky decomposition). [49]
See Online Appendix C, Figures C4, C5 and C6. [50]
The use of TSF in place of bank credit restricts our estimated sample to start from 2002. The quarterly implicit GDP deflator is converted into a monthly series using a simple linear interpolation. [51]
See Online Appendix C, Figures C7 and C8. [52]
the implicit deflator bear[s] the brunt of the revisions to nominal data. But revisions to implicit deflators are not plausible. [Given that p]rice indices are final in the year in which they are published … as are deflators derived from the data on directly reporting enterprises.[53]
See Online Appendix C, Figures C10 and C11. [54]
For a summary of the advanced economy experience, see most recently, Liao and Tapsoba (2014). The lack of a substantive effect of innovations in M2 on activity and inflation is also consistent with typical findings for the United States, where much of the variation in quantity aggregates reflects idiosyncratic shocks to money demand rather than fundamental changes in monetary policy (e.g. Bernanke and Blinder 1992). [55]
Guo (2013) argues that interest rates may only be effective in dampening high inflation, but not in arresting low inflation. [56]
For instance, gold and silver standards, and in some countries, fixed exchange rates, have proven capable of delivering price stability (in the absence of instrument independence) over periods of time where prevailing economic, financial and political conditions were most propitious. [57]
Broadly, there are three types of prices in China: (i) market determined, which have little-to-no government input; (ii) government guided, which are based off published (typically central) government benchmarks and/or administrative guidance, and (iii) government controlled, which are fixed prices set by the responsible government authorities which can include the central government as well as provinces and municipalities. [58]