RDP 2018-11: Consumer Credit Card Choice: Costs, Benefits and Behavioural Biases 5. Distribution of Monetary Costs and Benefits
October 2018
- Download the Paper 1.7MB
The net monetary benefit that cardholders receive from their credit card varies widely across individuals. Overall, I estimate that around 30 per cent of respondents incur a net monetary cost – meaning that their annual fee and interest payments were larger than the value of any benefits they receive from their interest-free period and from rewards points. Around 40 per cent gain a net monetary benefit, and around 30 per cent break even (defined as a net monetary benefit between −$50 and $50; Figure 3).
This section describes the distribution of the net monetary benefit across the demographic and stated preference variables that are the most economically and statistically significant predictors of the value of the net benefit (based on a simple regression framework, see Appendix C for regression results).
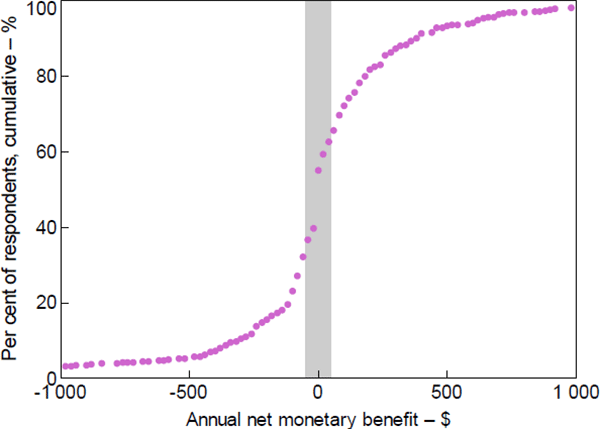
Note: Shaded area denotes the break even range
Source: Author's calculations, based on data from Ipsos and RBA
5.1 Distribution by Demographics
There are clear demographic patterns in the distribution of net monetary benefits. Consumers who receive the largest benefit tend to be those with relatively high incomes; half of those in the top quarter of the income distribution for their age received a benefit of $50 or more, around 25 per cent made a loss of $50 or more, and around 25 per cent broke even (Figure 4). Conversely, in the lowest income quartile, around 40 per cent of cardholders made a net monetary loss, under 20 per cent made a net gain, and around 40 per cent broke even.
While larger losses among lower-income cardholders were partly driven by a higher probability of borrowing, the overall pattern shown in Figure 4 persists even after excluding respondents who incurred interest charges; the distribution of benefits from credit cards across income groups also reflects higher average spending by higher-income respondents, which means they earn more rewards points and derive more value from their interest-free period.
A similar pattern is evident when we instead consider a measure of liquid wealth. Respondents with higher values of bank deposits generally receive larger net monetary benefits from their credit card. As with higher-income respondents, high-wealth respondents were less likely to use their card to borrow and to incur interest charges. They also tended to spend more, leading to larger benefits from their card's interest-free period and from any rewards program (Figure 5).
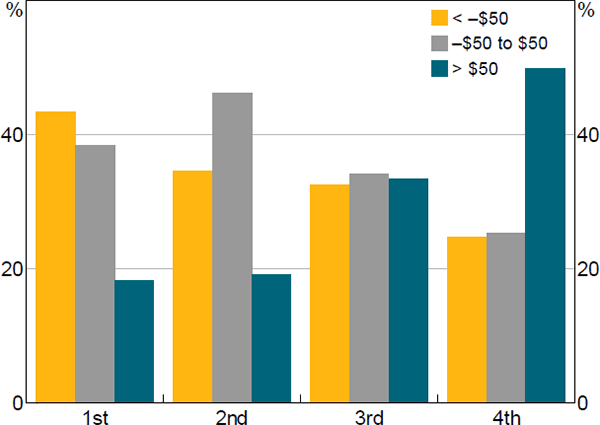
Source: Author's calculations, based on data from Ipsos and RBA
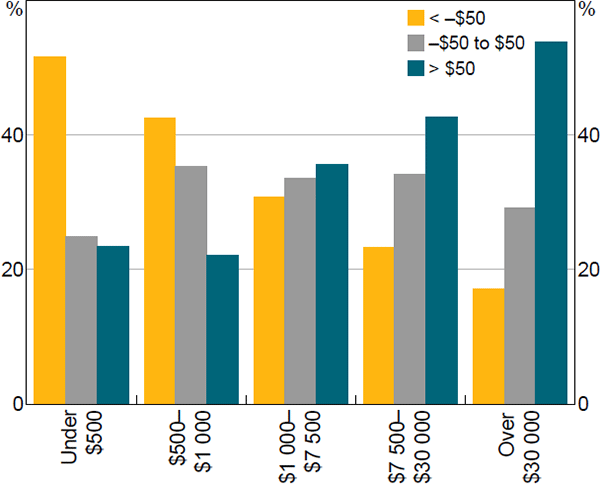
Source: Author's calculations, based on data from Ipsos and RBA
The value of consumers' net monetary benefit also varies with other demographic factors such as their age, education and employment status; in particular, those with positive net benefits tend to be employed, more highly educated and in the middle-age groups (Table 1). However, these demographics are also strongly correlated with income and bank deposits, and therefore they lose significance within a regression framework (see Appendix C).
| Loss greater than $50 | Break even (−$50 to $50) |
Benefit greater than $50 | |
|---|---|---|---|
| Age (years) | |||
| 18–29 | 24 | 48 | 29 |
| 30–39 | 27 | 28 | 45 |
| 40–49 | 26 | 25 | 49 |
| 50–64 | 38 | 30 | 32 |
| 65+ | 29 | 38 | 33 |
| Employment status | |||
| Employed | 26 | 31 | 43 |
| Not employed | 43 | 26 | 32 |
| Retired | 33 | 38 | 29 |
| Education | |||
| Did not complete year 12 | 44 | 39 | 17 |
| Year 12 | 36 | 29 | 35 |
| Certificate/diploma | 34 | 34 | 33 |
| University degree | 21 | 29 | 50 |
|
Source: Author's calculations, based on data from Ipsos and RBA |
|||
5.2 Distribution by Motivation for Holding a Credit Card
Different consumers have different reasons for holding a credit card (see Section 4.1). Based on respondents' stated initial motivation for choosing their card (see Figures 1 and 2), and other relevant survey questions, I identify four prominent ‘types’ of credit card holders: those motivated by borrowing; those who see their card mainly as method of payment; those motivated by rewards points; and those motivated by other benefits that carry a financial value, such as the interest-free period and travel or rental car insurance.
Eleven per cent of cardholders were motivated to use their card to borrow – that is, these cardholders stated that the most important reason for having a credit card was either to borrow money and smooth spending or the interest-free period, and they reported that if they did not have a credit card they would want to borrow money in some other way. As may be expected, these respondents were substantially more likely to use their card to borrow outside of the interest-free period, and as a result incurred higher interest charges. The median respondent in this group made a net loss of $50, with many making substantially higher losses.
The largest group, making up almost 30 per cent of cardholders, were those who said they primarily value their credit card as a method of payment. These were respondents who appear to view and use their card in the same way as a debit card (for instance, reporting they have a credit card because it is a ‘convenient way of paying’), and stated they would not want to borrow money if they did not have a credit card. The median respondent in this group effectively broke even, with an annual net monetary benefit of $11.
A further 43 per cent of cardholders were motivated by either rewards points or other benefits such as the interest-free period and insurance, and stated they would not want to borrow money if they did not have a credit card. Cardholders who were primarily motivated by rewards points received the largest benefits – with just over 60 per cent receiving a net monetary benefit, with a median value of $105 – while the median respondent motivated by other benefits broke even (Figure 6).
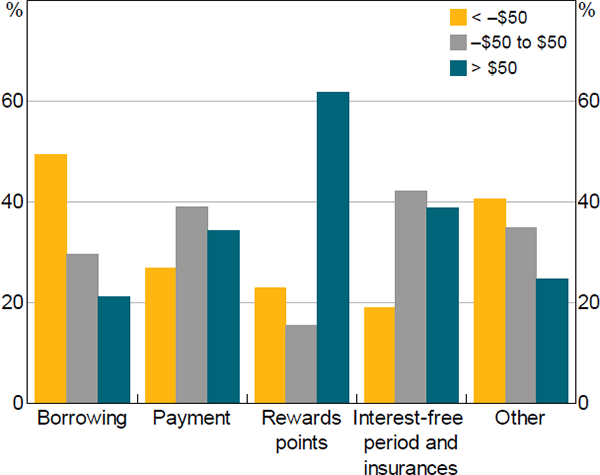
Source: Author's calculations, based on data from Ipsos and RBA
Around 20 per cent of respondents do not fit into any of these groups – the ‘other’ category includes, for instance, those who stated that they were primarily motivated by rewards points or other benefits, but would also want to borrow money if they did not have a credit card. These respondents typically made a net loss, though the average value of losses was smaller than for those motivated by borrowing.
5.3 Distribution Relative to ‘Optimal’ Card Choice
The monetary benefit that consumers receive from their credit card depends both on the features of the specific card they hold and on the way they use their card. To understand the relative contributions of these two factors on the overall distribution of costs and benefits, I estimate the net monetary benefit that respondents could receive if they had chosen the credit card that would maximise their net monetary benefit (their ‘optimal’ card).
To estimate the ‘optimal’ net benefit, I first calculate the net monetary benefit that each respondent would receive from the range of available cards, based on the way they use their actual card. I then assign to respondents the value of the card that would maximise their net monetary benefit.[25]
This ‘optimal’ net benefit should be seen as an upper limit on the monetary benefit that respondents could receive from a credit card, as it assumes that all respondents would be eligible and approved for their optimal card. The difference between respondents' actual net benefit and their ‘optimal’ net benefit also likely overstates the potential gains from switching cards, as I do not account for search or switching costs.[26] Further, consumers may rationally choose a card other than their ‘optimal’ card due to difficulty in precisely predicting their card use patterns at the time of choosing their card, or because they value other card features not included in my calculation. Nonetheless, these estimates provide a guide for the magnitude of potential gains respondents could receive from choosing a card that is better suited to their actual use patterns.
I estimate that cardholders could be made better off by choosing a card that is better suited to their use patterns (Figure 7; assuming that holding a different card would not change behaviour).[27] The median cardholder's actual net monetary benefit was around $120 lower than it would be if they held their ‘optimal’ card.
Of those who made an actual net monetary loss, around 65 per cent could have avoided that loss altogether by choosing a different card. For these cardholders, the median difference in net monetary benefit between their optimal and actual card was around $150.
Most loss-making respondents who reported that they usually or often pay interest would continue to make a net monetary loss even with an ‘optimal’ card, but these losses would be substantially smaller.[28] Of the 10 per cent of cardholders who would make a net loss under the ‘optimal’ card distribution, the median value of those losses would fall to around $280, down from an actual median loss of around $530 (a reduction of $250).
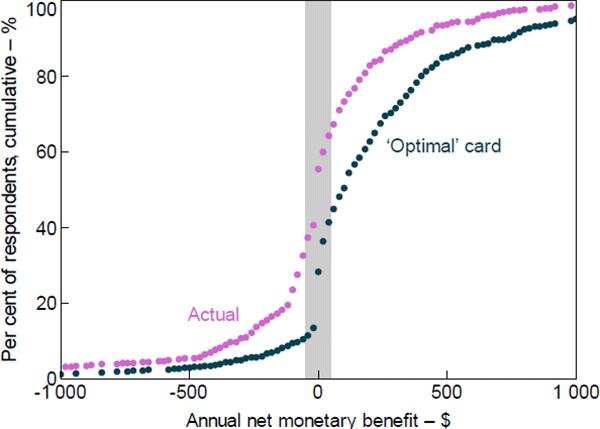
Note: Shaded area denotes the break even range
Source: Author's calculations, based on data from Ipsos and RBA
Footnotes
The ‘optimal’ net benefit is calculated based on advertised card features. Note that in the Australian credit card market, cardholders incurring interest generally pay the advertised interest rate. This differs from other markets, such as the United States, where, for the same card product, different individuals may be offered individualised interest rates based on their credit history. [25]
Note also that the potential gain from choosing an ‘optimal’ card is estimated here for the marginal individual. Card issuers would likely adjust their pricing models if a large portion of consumers were to behave in this way. [26]
The estimated ‘optimal’ net benefit makes some simplifying assumptions (for instance, the value of rewards points is based on points required for a $100 gift card, and not on the respondent's actual method of redeeming rewards points). I re-estimate the actual net benefit with these same assumptions to ensure comparability. As a result, the distribution of the actual net monetary benefit in Figure 7 is slightly different from the preferred estimate shown in Figure 3. [27]
28 ASIC (2018) estimated that consumers carrying balances on higher-rate cards could save an average of roughly $340 if they held a lower-rate card (that is, ASIC estimate that around 1.8 million cardholders could save an aggregate of $621.5 million in interest charges). My estimated potential savings for interest payers is close to, but slightly below ASIC's estimate, likely due to methodological differences. One important difference is that ASIC's figures are based on potential interest savings for cardholders carrying balances on cards with an interest rate of 20 per cent or higher, while my estimates relate to all interest-paying cardholders for whom a lower-cost card is available. I estimate a mean saving of $245 (and a median of $145) for respondents who usually or often pay interest. [28]