RDP 2018-06: The Effect of Minimum Wage Increases on Wages, Hours Worked and Job Loss 4. Flat Dollar Adjustments over 1998–2008
May 2018
- Download the Paper 1,216KB
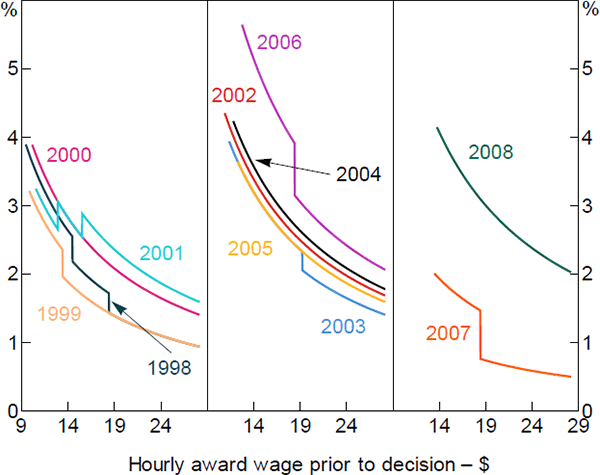
The decade leading up to 2008 is useful for studying the effects of award wages on other labour market outcomes. During this period, the FWC were routinely granting flat dollar increases to all awards each year, irrespective of the existing wage rates contained in those awards. For example, in May 2000, the FWC increased all award wages by 39 cents per hour.[6] This meant that employees on relatively low award wages received larger wage increases in percentage terms than those on higher award wages.
Figure 2 shows the percentage increase in award wages in each year from 1998 to 2008 across different award wage levels. The flat dollar increases are what generates the downward slope in each profile. On some occasions the FWC also granted smaller flat dollar increases to higher award wage ranges, rather than a single flat dollar increase. For example, in 2003, the FWC announced an increase of 45 cents per hour for all award wages up to $19.26 per hour, and 39 cents per hour for all wages above this level. This created a discontinuity in the profile of percentage wage increases at $19.26 per hour (Figure 2). These discontinuities tend to exacerbate the differences in the size of the award wage increase between low- and high-award-wage employees. The only exception was in 2001, when the FWC awarded a series of larger flat dollar increases to higher award-wage earners. Further details on each decision are available in Appendix A.
The decision to announce flat dollar increases each year (and often in smaller amounts to higher wage brackets) led to a significant compression of the distribution of minimum wages over time. This was a deliberate policy decision intended to ‘allocate the greater share of wage rises to those in greatest need’ (FWA 2011, p 61). The rationale was that a flat dollar increase gave ‘appropriate emphasis to the needs of the low paid whilst moderating the overall economic impact’ of the minimum wage decision (AIRC 2003). Policymakers also sought to encourage higher wage earners to negotiate wages directly with firms, rather than remain on awards, and believed that granting smaller wage rises would encourage this to happen (AFPC 2006).
Sources: Author's calculations; Fair Work Ombudsman
Although the FWC had been announcing flat dollar increases to all awards as early as 1993, I focus on the period after 1998 due to data availability. I also omit the flat dollar increase announced in 2010 from my analysis as it may lead to results that are contaminated by the effects of award modernisation.[7] Since 2011, the FWC has been granting flat percentage increases to all awards each year (in addition to any adjustments associated with award modernisation between 2010 and 2014), thus preserving the existing wage differentials between awards.
Footnotes
The FWCs award adjustments were often stated in terms of a flat dollar increase to the full-time weekly award wage. Since weekly standard hours vary slightly from award to award, all references to hourly rates in this paper assume a 38-hour workweek. [6]
In 2010, the FWC began a process of consolidating 1,500 ‘pre-modern awards’ into 122 ‘modern awards’. The main objective of this award modernisation process was to reduce the regulatory burden on firms by creating a set of awards that were ‘simple to understand and easy to apply’ (Gillard 2008, p 1). [7]