RDP 2016-01: Measuring Economic Uncertainty and Its Effects Appendix E: Extra VAR Results
February 2016
- Download the Paper 1.07MB
- Data
E.1 Monthly VAR Robustness
The monthly VAR results are reasonably robust to ordering uncertainty second-last ahead of sentiment and to alternative lag selections (Figure E1). With both two and three lags, there is a somewhat anomalous spike in employment in the two months immediately following the uncertainty shock, but growth is depressed thereafter – consistent with the preferred one lag specification used in Section 4.1.
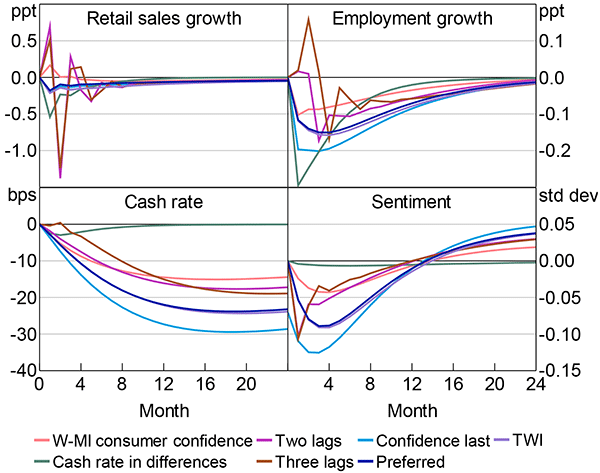
Notes: Retail sales growth and employment growth are annualised; all lines in the cash rate panel show changes in the level of the cash rate, except the ‘cash rate in differences’ series, which shows the change in the cash rate
The results are also robust to using the W-MI measure of consumer sentiment instead of the ANZ-Roy Morgan measure. I also tried including the nominal trade-weighted index, or the US dollar-Australian dollar exchange rate; these made little difference. The results are also robust to using the unemployment rate rather than employment growth.
E.2 Alternative Ordering: Monthly
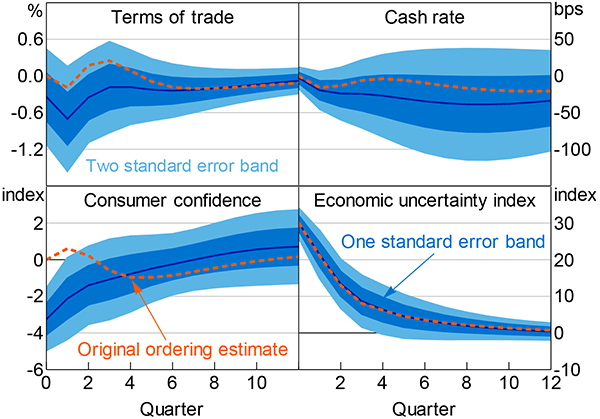
As discussed in Section 4, I use a conservative identification strategy for the main results of the paper: I order the economic uncertainty index last. This means that the only variation that remains in the uncertainty shocks is that which cannot be explained by other variables in the VAR. The estimates presented in Figures 11 and 13 thus represent a kind of lower bound on the effect of uncertainty.
In this section, I flip that identification assumption and order the economic uncertainty index first in the monthly VAR. This restriction assumes that uncertainty contemporaneously affects all other variables, but itself responds only with a lag. Much of the empirical literature uses this ordering.
Unsurprisingly, this alternative identification assumption increases the estimated effects of uncertainty for the monthly VAR. Reassuringly, the differences between these estimates and the main results presented in the paper are small (Figure E2). The close similarity of the responses suggests that little is lost in taking the more conservative identification strategy I use in the text. With either choice of assumptions the broad story that uncertainty matters in Australia does not change.
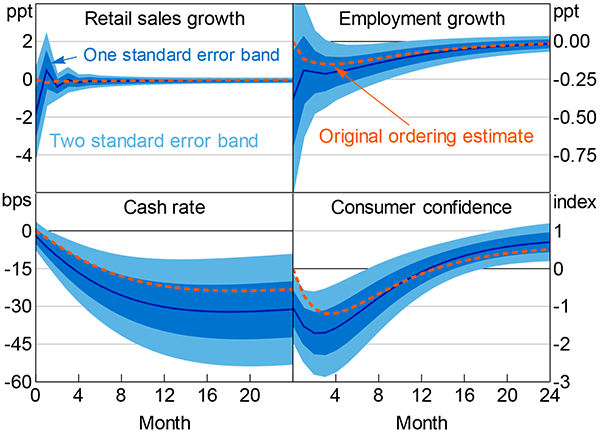
Notes: See notes to Figure 11; the ‘original ordering estimate’ series show the impulse responses from Figure 11
E.3 Other Quarterly Responses
The quarterly responses are reasonably similar to those in the monthly VAR (Figure E3). Consumer confidence has a similar shape, although the response is about half as large in the quarterly VAR and displays an initial peak, similar to investment. The response is much less precisely estimated than in Figure 11 because it is at quarterly frequency. Similarly, the decrease in the cash rate is a little smaller than in the monthly VAR – about one-fifth of a percentage point at peak – although it displays somewhat odd dynamics initially. The terms of trade barely respond to uncertainty shocks. At peak, the change is about one-quarter of a per cent (about a tenth of a standard deviation). Moreover, the response bounces either side of zero.
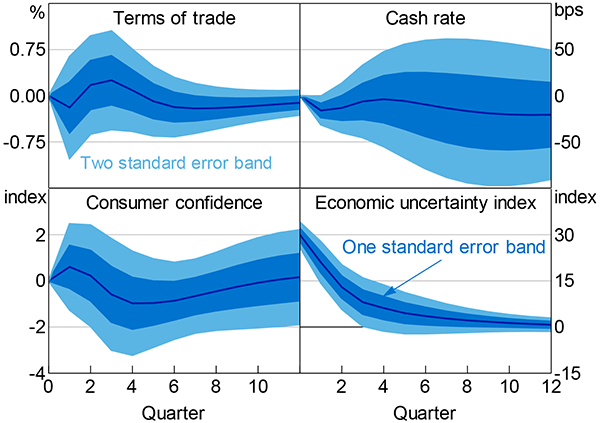
Notes: Consumer confidence (ANZ-Roy Morgan), cash rate and the economic uncertainty index are all quarterly averages; estimation covers June quarter 1987 to December quarter 2014
E.4 Alternative Ordering: Quarterly
As with the monthly VAR, ordering uncertainty first somewhat increases the size of the responses, but does not materially alter the story about how uncertainty affects the Australian economy (Figure E4). The differences in estimated responses are reasonably small between the original ordering and the alternative ordering, although the surprisingly initial increases seen in Figure 13 all but disappear. Naturally, the differences are largest in the first few quarters, where the short-run restrictions of the Cholesky ordering are most binding. After about four quarters the differences between the two sets of estimates are negligible. Again, the similarity of these responses supports the view that taking the more conservative approach in the text carries little cost.
The same is true for the responses of the other variables not shown in Figures 13 and E4. Ordering the economic uncertainty index first in the VAR increases the magnitude of the effects, particularly initially (Figure E5). However, with the possible exception of the cash rate, the differences are neither large nor economically interesting.
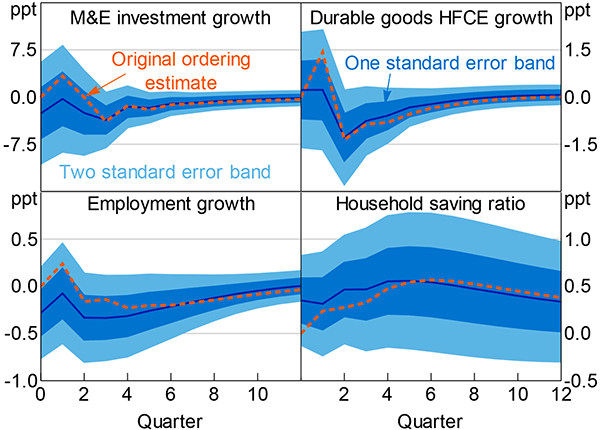
Notes: See notes to Figure 13; the ‘original ordering estimate’ series show the impulse responses from Figure 13
Notes: See notes to Figure E3; the ‘original ordering estimate’ series show the impulse responses from Figure E3
E.5 Quarterly VAR Robustness
The quarterly responses are robust to alternative lag specifications, orderings and measures of sentiment (Figure E6). They are also robust to including the nominal TWI, or excluding the terms of trade. There is little variation across the responses, although some measures of sentiment exacerbate the first-quarter spikes.
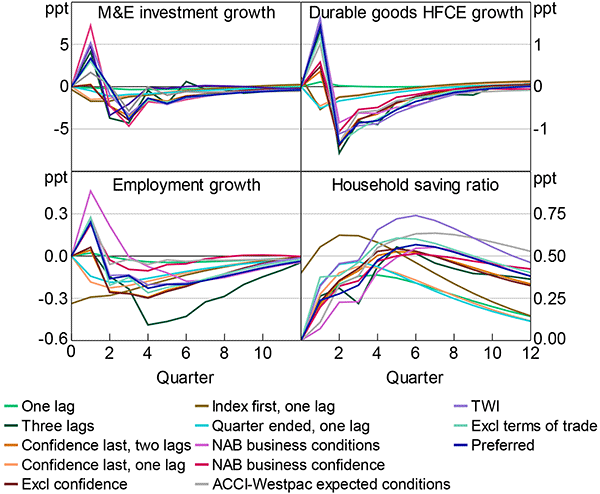
Notes: See notes to Figure 13; the ‘quarter ended, one lag’ series uses the in-month reading for the final month of the quarter; all series use ANZ-Roy Morgan consumer confidence as the measure of sentiment, except the ACCI-Westpac expected conditions, NAB business confidence and NAB business conditions series, which use those measures
The only exception is the ‘one lag’ specification. This specification eliminates the responses of investment, consumption and employment growth (and flips the sign of the response of durable goods HFCE growth). However, the response of the saving ratio is little changed.
This occurs because, with only one lag, the coefficients on uncertainty in the reduced form equations for investment, consumption and employment growth are very close to zero. As a result, uncertainty has little to no direct effect on these variables in this specification. With uncertainty ordered last, sentiment barely responds to an uncertainty shock because the coefficient is also very near zero. However, with uncertainty ordered ahead of sentiment, the uncertainty shock induces a modest-sized contemporaneous fall in sentiment. This fall in sentiment is sufficient to reduce investment, consumption and employment growth. With longer lag structures, uncertainty has a direct effect. This explains why the one-lag uncertainty-last specification produces little to no response, while all the other specifications do – including those with uncertainty ordered last, but longer lag structures.