RDP 2014-08: The Effect of the Mining Boom on the Australian Economy 5. Sectoral Responses
August 2014 – ISSN 1320-7229 (Print), ISSN 1448-5109 (Online)
- Download the Paper 2.02MB
5.1 Household Income and its Components
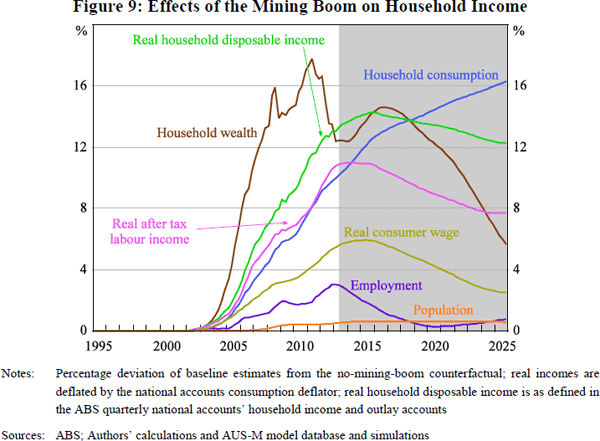
The mining boom is estimated to raise household income through several different channels, shown in Figure 9. As of 2013, the population is about 1 per cent larger than in the counterfactual, reflecting the response of net migration flows to relative job opportunities and higher real wages. Employment is 3 per cent higher, largely due to the boost to aggregate demand. Real consumer wages are about 6 per cent higher, reflecting the effect of the higher exchange rate on import prices. A larger tax base leads to lower average tax rates, which help raise household disposable income by about 13 per cent. Household income is also supported by higher property income, reflecting higher wealth, in turn attributable to higher equity prices and higher saving (discussed below). Capital gains would boost broader measures of income, though not the national accounts definition.
5.2 Foreign Income Outflows
An important issue in assessing the contribution of the mining boom to national income is the extent to which the profits of mining companies accrue to foreigners. Sheehan and Gregory (2012) and Edwards (2014) emphasise that some foreign-owned projects will have little impact on the domestic economy apart from the tax paid. This is especially the case for some large LNG projects, where the platforms and processing plants are manufactured overseas and towed to sites off the coast of Western Australia, with little domestic input in either the investment stage or in production. A large part of the return from such projects flows overseas in higher profits. More broadly, many projects have a large domestic input in the investment phase but not in production. Reflecting these concerns, Sheehan and Gregory worry that the domestic benefits from the mining boom may have largely passed.
Estimating the effect of the mining boom on net investment flows is difficult, for several reasons. First, the ABS balance of payments estimate flows of retained earnings where there is an investment stake of 10 per cent or more (foreign direct investment), but not for portfolio investments that fall below this ownership threshold. This means that income accruing to foreigners is understated and national income is overstated. These omissions do not affect data on household disposable income, but will affect the model's projections.
Second, the share of foreign ownership by industry, specifically mining, is even harder to gauge. On the basis of a sample of company publications, Connolly and Orsmond (2011, p 38) calculate that the foreign ownership share might have been around 80 per cent a few years ago, with the share for iron ore producers being a little lower and that for coal and LNG producers a little higher. Given the rise, fall and mergers of many key players in the industry over the past decade or two, the share is unlikely to have been constant.
Third, even if we knew the foreign ownership share of Australian mining, this would only tell us how much of the benefit of a change in Australian export prices remains in Australia. For our purposes, the more realistic experiment is a change in world mining prices. This also requires an estimate of the benefit Australians gain from their ownership of mines overseas. Balance of payments estimates suggest that Australian foreign mining assets are worth 11 per cent of GDP and foreign mining liabilities are worth 21 per cent of GDP. These estimates can be difficult to interpret as many financial claims are allocated to the finance industry. But it is clear that Australian ownership of overseas mining assets is substantial. For example, it includes a large share of BHP-Billiton's overseas assets following their merger in 2001. And Australian superannuation funds are likely to own significant equity in foreign mining companies.
In the absence of a clear or easy solution to these difficulties, AUS-M's treatment of net foreign investment income is fairly simple. Changes in the industry composition of profits do not explicitly affect net income flows. Higher mining prices lead to moderately larger net dividend payments abroad, though much less than a simple application of Connolly and Osmond's (2011) estimates might suggest. A more subdued response seems appropriate given offsetting dividends from overseas and the financing of investment from retained earnings. This is an issue on which more research and better data are needed.
5.3 Consumption and its Components
As can be seen in Figure 9, household consumption (the blue line) is estimated to initially rise more slowly than real household disposable income (the green line). That is, the saving rate increases. This reflects inertia in consumption, coupled with a default assumption that households initially view the boom as temporary. In the medium to long run, as it becomes apparent that the change in incomes is permanent, savings return toward normal and consumption rises further. In the long run, consumption will adjust to be consistent with the rise in household disposable income, which is around 11 per cent higher per capita.
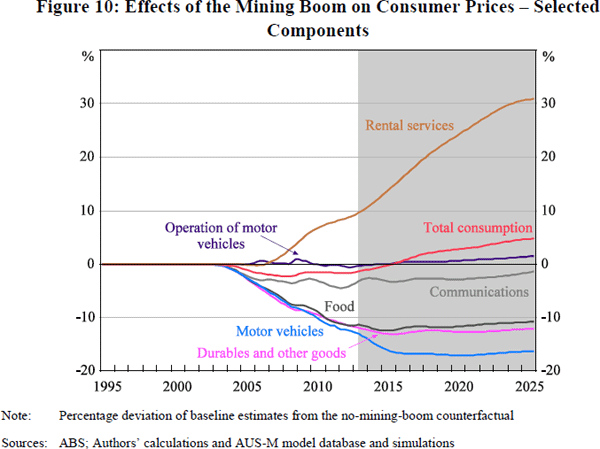
Changes in the composition of consumption are an important determinant of how the mining boom affects different industries. These compositional changes, in turn, reflect how households react to relative price movements and changing income. Figure 10 shows estimated changes in prices. The higher exchange rate drives the prices of imported goods like motor vehicles and durables lower but has relatively little effect on the prices of most goods and services produced domestically.
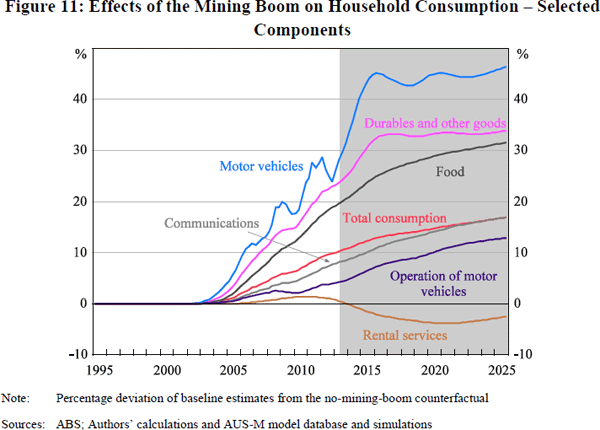
Consumption of durables and motor vehicles also respond strongly to the increase in real household disposable income. The combination of the substitution and income effects mean that motor vehicle purchases may have been 30 per cent higher as a result of the mining boom, and durables 25 per cent higher (Figure 11).
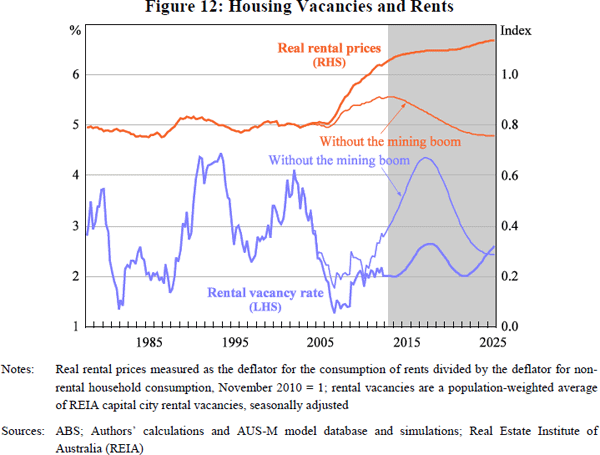
The increase in household disposable income has involved a surge in demand for housing. However, whereas most other elements of consumption are supplied elastically, the supply of housing is relatively fixed in the short run. Thus the mining boom results in a substantial reduction in vacancy rates and rapidly rising rents, as shown in Figures 10 and 12. Although high rents and house prices encourage housing construction, these effects are more than offset by higher interest rates after 2009 (relative to the counterfactual), shown in Figure 8, which depress dwelling investment. So despite strong demand, the supply of housing contracts, compounding the downward pressure on vacancies and upward pressure on rents. We estimate that, without the mining boom, the vacancy rate would barely have fallen below 2 per cent during 2006/07 and rents would have roughly kept pace with inflation.
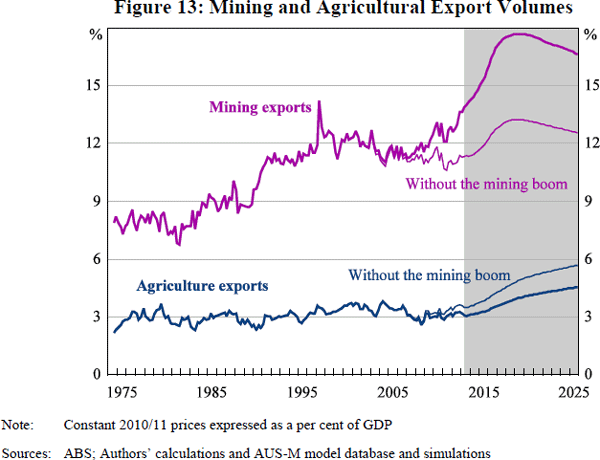
5.4 Export Volumes
Exports are modelled in different ways in AUS-M. For commodity exports (agriculture and mining), we assume that goods are reasonably homogenous and that producers are price takers on the world market. Supply is price-inelastic in the short run but responds with a lag to ‘internal competitiveness’ (the world price expressed in A$ relative to local costs), and hence profitability, which induces investment. For agricultural exports (Figure 13), prices are reduced by the exchange rate appreciation, an effect that is partially offset by the assumed increase in world demand, the latter effect being relatively small. With lower profitability and investment, supply decreases and exports are about 20 per cent lower after a decade.
In contrast, manufacturing and service exporters are assumed to face a downward sloping demand curve, and only supply part of their output to the export market. They are consequently driven by ‘external competiveness’ (the price of exports in foreign currency on the world market relative to world prices) and are directly affected by fluctuations in world activity (shifts in the demand curve). Strong foreign demand raises the demand for manufacturing and service exports, shown in Figure 14. The effect of strong demand is offset, to varying degrees, by the exchange rate appreciation. For manufacturing exports, the two effects are broadly offsetting and hence there is not a great deal of change. Service export demand is more price sensitive and declines substantially. Although AUS-M does not explicitly include this level of detail, exports of tourism and air transport services seem to have been particularly affected.
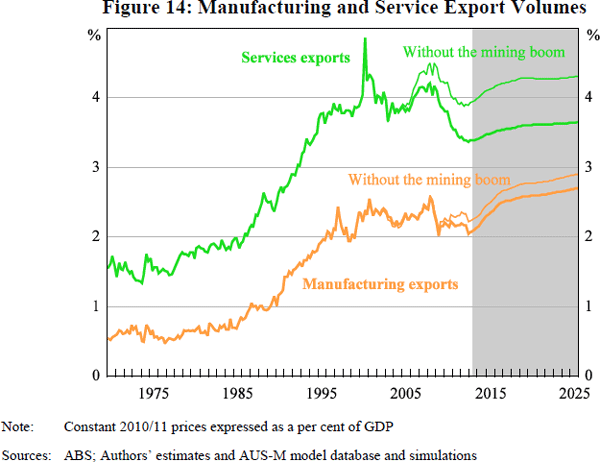
In short, the major effect of the mining boom on the volume of exports occurs in services and agriculture rather than manufacturing. Although manufacturing exports increased through the 1990s, Australian manufacturing still mainly services the domestic market. The main impact of the mining boom on manufacturing is therefore felt via import substitution from the higher exchange rate, particularly after the investment boom phase, which we discuss further below.
5.5 Output and Price by Industry
AUS-M's treatment of industry responses can be broken down into several stages. First, changes in components of demand, such as disaggregated consumption, investment and exports are estimated, typically on the basis of time-series regressions. Many of these estimates are shown above. These expenditure changes are then mapped to individual supply categories (that is, industry outputs and imports) via input-output coefficients. This approach is very similar to that outlined by Rayner and Bishop (2013) for example. As we illustrate below, this can be presented as an ‘input-output weighted demand’ for each industry. Then, substitution between different industry outputs and imports is driven by relative prices, in particular the higher exchange rate. Appendix A has further details.
Effects of the mining boom on industry output are shown as deviations from the counterfactual in Figure 15 and as shares of constant price GDP in Figure 16. Consistent with previous studies such as Stoeckel (1979), the largest impact of the boom, outside mining, is on agriculture. It is an industry heavily dependent on the export market and gains little benefit from the surge in domestic incomes and demand associated with the mining boom. However, the result is dependent on the assumption that world agricultural prices are little affected by higher global activity and industrial production.
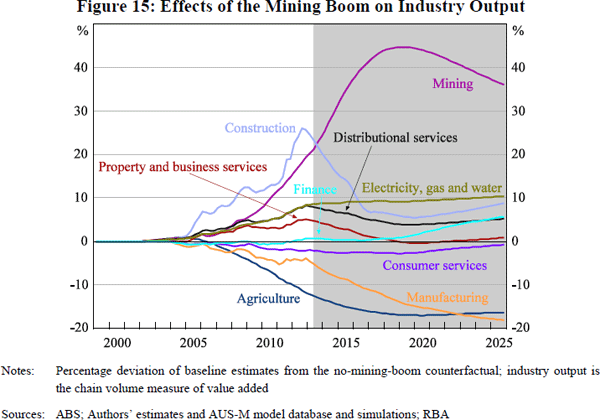
The industries that are estimated to benefit most from the boom, outside mining itself, are construction; electricity, gas and water; and distributional services. These industries sell a disproportionate share of their output to the mining industry. The effect on electricity, gas and water reflects in part the heavy use of electricity in the production of aluminium. AUS-M classifies aluminium exports within the mining category, though elsewhere it is often considered as part of manufacturing. The aluminium industry has not grown as quickly as some other resource industries, so a more disaggregated analysis would presumably show weaker demand for electricity.
Figure 17 shows the effect of the mining boom on industry output (value-added) prices. The main changes in prices are for industries selling tradeable goods, such as mining, agriculture and manufacturing. For domestic non-commodity industries, price changes are relatively small.
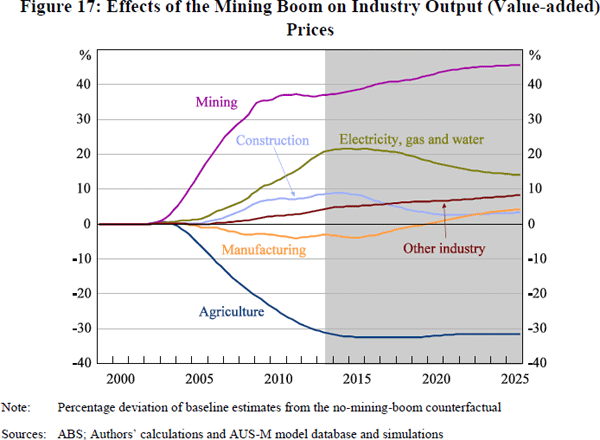
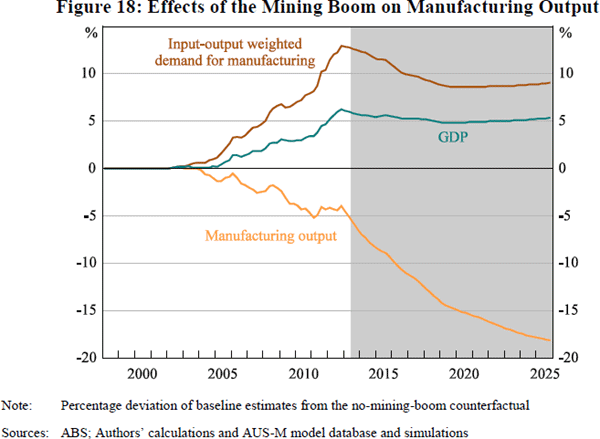
The manufacturing sector has been the focus of concern about the ‘Dutch disease’ and ‘deindustrialisation’. In the short term, manufacturing output is supported by the higher incomes and expenditure associated with the mining boom. In particular, manufacturing benefits from strong demand for equipment and material used in construction. This can be seen in the line labelled ‘input-output weighted demand’ in Figure 18, which is somewhat stronger than GDP. As a result, investment by manufacturing (not shown) is higher in the first few years of the boom, a result that Bean (1987) found in his study of the effects of North Sea oil in the United Kingdom. However, this effect is more than offset by the 40 per cent appreciation of the exchange rate, which makes manufacturing less competitive. In the first decade of the boom the net effect is moderate, with manufacturing output estimated to be about 5 per cent lower in 2013 than it would have been in the absence of the boom. Then, as the investment boom fades, and with it the demand for manufacturing inputs, the relative price effects increasingly dominate. By 2016, manufacturing output is about 13 per cent lower, an effect that continues to increase over time.
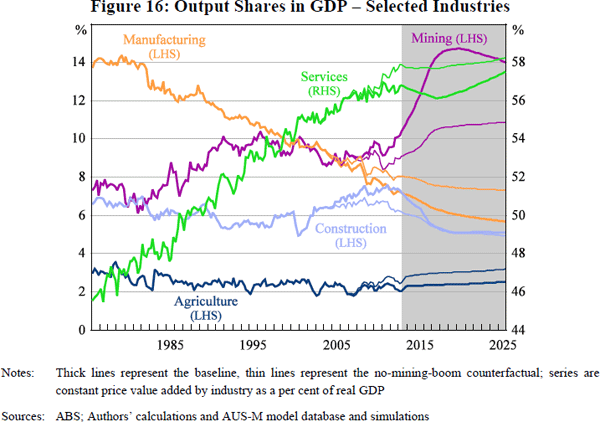
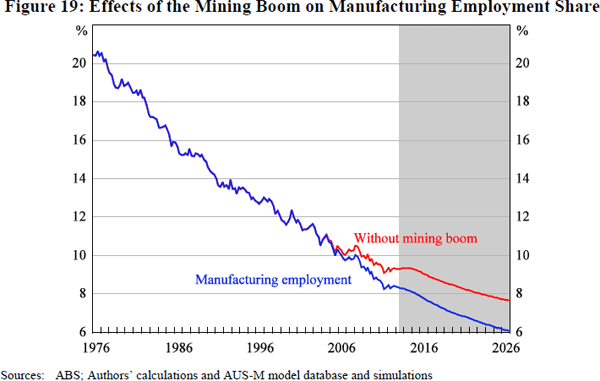
However, as Giesecke (2004), Downes and Stoeckel (2006) and Minifie et al (2013) argue, it would be wrong to conclude that the mining boom is the main source of the manufacturing sector's troubles. As shown in Figures 16 and 19, manufacturing has been declining as a share of the Australian economy for decades. The mining boom accentuates this trend, but its contribution is small compared to the changes that have come before.
5.6 Employment by Industry
The estimated pattern of deviations of employment by industry (Figure 20) is largely driven by the pattern of output by industry (Figure 15). The boom induces large increases in employment in mining and construction and reduces employment in agriculture and manufacturing.
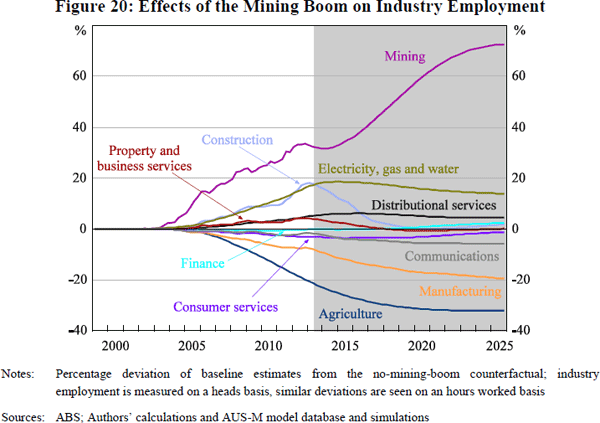
Differences in the responses of output and employment by industry (that is, changes in industry productivity) largely reflect changes in real producer wages. These in turn are mainly the result of large deviations in output prices (Figure 17) that are slightly offset by fairly small changes in wages.[4] For example, mining employment rises noticeably before the increase in mining output, because mining output prices are higher (by 37 per cent in 2013), partially offset by a 4 per cent increase in hourly earnings in mining. Similarly manufacturing employment is 9 per cent lower by 2013, compared to an output deviation of 5 per cent. This is because manufacturing output prices are lower, producer real wages are higher and hence there is substitution away from labour for a given level of output.
These substitution effects have an impact on measured labour productivity. For example, labour productivity fell in the mining sector when commodity prices rose in the mid 2000s, something the model attributes to a substitution effect rather than a decline in underlying labour efficiency. Similarly, if or when commodity prices decline measured labour productivity in mining should rise. The same applies to other industries where there are large movements in output prices relative to labour costs.
Footnote
In contrast, Plumb et al (2013, Section 3.2.4) describe the variations in wages by industry as ‘substantial’. That characterisation reflects different data sources and a perspective of reallocation of labour across industries. [4]