RDP 2012-04: Chinese Urban Residential Construction to 2040 3. Methodology and Components
September 2012 – ISSN 1320-7229 (Print), ISSN 1448-5109 (Online)
- Download the Paper 1.17MB
To better understand the prospects for urban residential construction, this section of the paper attempts to model the construction process.
3.1 Methodology
To begin, we note that urban construction is the change in the stock of urban residential floor space plus demolitions:[3]

The stock of urban floor space is the product of urban residential floor space per capita and urban population:

Therefore, the path of construction is determined by the following factors:
- urban population;
- floor space per capita; and
- demolitions.
Each of these factors is considered below.
3.2 Urban Population
The Chinese urbanisation rate has been rising rapidly over the past two decades and we expect it to continue to do so for some time (Figure 3). In 1990, just over one quarter of the Chinese population lived in urban areas, today over a half do. Large flows of rural immigrants to urban areas and large scale land reclassification have driven this trend (Woeztel et al 2009; Henderson 2011). Our urban population projections are calculated using a similar methodology to the United Nations' (UN) World Urbanization Prospects and, as Figure 3 shows, the projections are close to the UN's.[4] We project an urbanisation rate of almost 70 per cent by 2030 and around 73 per cent by 2040.
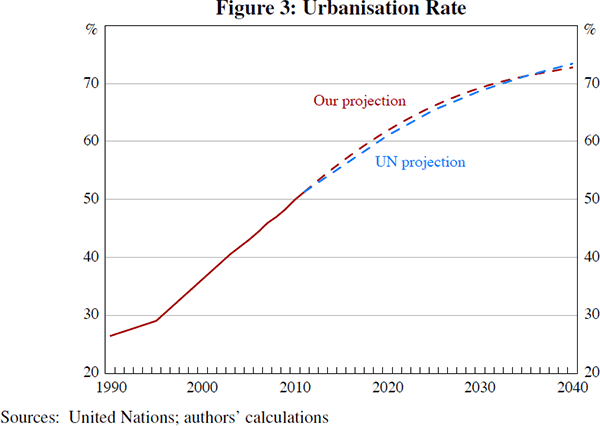
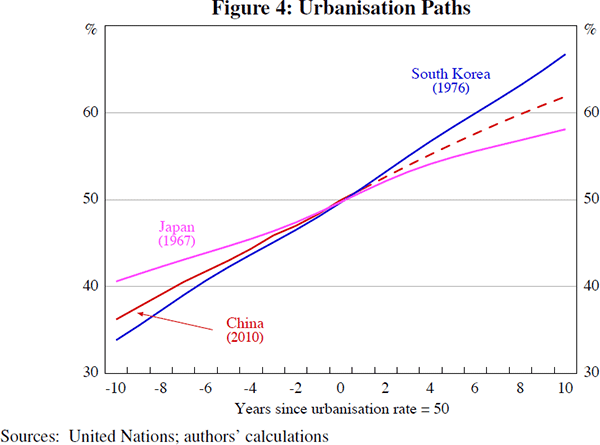
Our projected path is not unprecedented. Figure 4 shows the urbanisation path followed by Korea, Japan and China. All paths are centred at the point where the urbanisation rate reached 50 per cent, the date of which is indicated in parentheses for each country. Korea experienced an even more rapid urbanisation than we are projecting for China. Japan's was slower, but not significantly so; 10 years after reaching 50 per cent, Japan's urbanisation rate stood at 58 per cent, while we are projecting that China's urbanisation rate will reach 62 per cent at a similar point. Moreover, Japan's urbanisation rate was increasing at a much slower pace than China's as it approached 50 per cent.
Aside from the UN, other institutions have also made projections of China's urbanisation rate for 2030. Table 1 shows some of these estimates, which vary substantially, and the assumptions behind the differences are not entirely clear. Our projections are in line with the median projection.
| CASS | CSMC | UN | Berkelmans and Wang | REICO | CCIEE | DRC |
|---|---|---|---|---|---|---|
| 65 | 65 | 69 | 69 | 70 | 70 | 80 |
|
Sources: China Academy of Social Sciences (CASS); China Center for International Economic Exchanges (CCIEE); China Small Medium Cities (CSMC); Development Research Center of the State Council (DRC); REICO Studio (REICO); United Nations (UN); authors' calculations |
||||||
There are fundamental reasons for the relatively rapid increase in the urbanisation rate. The wage gap between rural and urban areas is large, which should attract workers to cities (Harris and Todaro 1970; Henderson 2009). Also, the Chinese rural population is relatively well educated given China's stage of development, which may increase their mobility (Henderson 2009). While the hukou system acts as a barrier to migrant flows, the system has evolved gradually over recent years and further reform bodes well for improving population mobility.
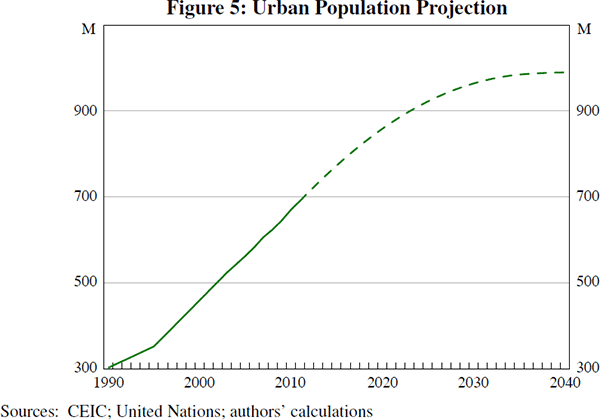
We calculate the urban population path using the projections for the urbanisation rate along with ‘medium variant’ population projections from the UN's World Population Prospects database (Figure 5).[5] Accordingly, we project the urban population will reach almost one billion by 2030 from its current level of 691 million, and then stabilise. Our projected rate of increase gradually recedes over the projection horizon: compared to the current 20 million annual increase in urban population, the rate of increase is projected to fall to 7½ million per year by 2030 and to just over 1 million per year by 2040.
3.3 Floor Space per Capita
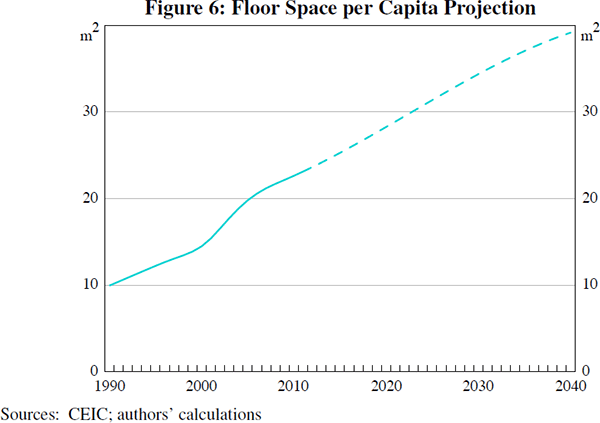
When considering Chinese urban per capita residential floor space, we use data from the NBS China Statistical Yearbooks. However, we believe the official figures overstate the actual urban floor space per capita as they are calculated using an understated population base. Instead of using actual urban population as the denominator, the official data appear to be calculated by dividing the total residential housing stock by the non-agricultural hukou population, which does not account for the migrants from rural areas who still hold an agricultural hukou (Beijing Municipal Bureau of Statistics 2006).[6] We correct for this by multiplying the original data by the ratio of the non-agricultural hukou population to actual urban population.[7] Floor space per capita data prior to 2002 are not published in the latest Yearbook, but these data are available in earlier Yearbooks. The data exhibit a large jump in 2002, which suggests that there is a break in the series. But because the pre-2002 data carry information, we do not discard them. Instead, we smooth the full dataset using a Hodrick-Prescott filter with a parameter of 6.25 to extract the trend, which delivers the historical path shown in Figure 6. The aim of extracting the trend is to obtain a realistic path that reflects the data, but smooths through any aberrant movements.
We base our projections of floor space per capita on estimated international relationships between income and residential floor space. While the regressions generally focus on total floor space per capita rather than urban floor space per capita, they are nonetheless informative; the regressions generally cover highly urbanised countries, so the overall relationship is a reasonable proxy for the urban relationship in the datasets. Like Isaac and van Vuuren (2009), we find the following equation generally fits the data better than a linear alternative.

We estimate this equation on three datasets. First, we use Taiwanese regional panel data from Directorate-General of Budget, Accounting and Statistics (2011). The original income data are nominal and so we deflate income by the consumer price index to obtain real income.[8]
The second dataset consists of international panel data. The floor space data are sourced from International Energy Agency (2004) and GDP per capita data are sourced from the Penn World Tables, version 7.0.[9] These floor space data cover 13 industrialised countries from 1973 to 1998.[10] While a linear regression fits the IEA data better, we still use Equation 3 to be consistent with the models estimated using other data.
Finally, we also estimate Equation 3 on Chinese nationwide floor space data from 1990 to 2010. GDP per capita numbers are once again taken from the Penn World Tables.
The estimated value of the income coefficient, β, ranges from 6.6 to 25.7 (Table 2). The panel data give lower coefficients when controlling for fixed – regional or country effects – and year effects.[11] This might be because technology improvements – which would allow more floor space to be constructed for given inputs – are picked up by the income variable when year effects are omitted. Despite this, the Chinese coefficients, which are estimated without year effects, are lower than other estimates, especially in recent years. Prima facie, this could be due to the type of accommodation rural migrants inhabit and the increased share of floor space they occupy. Small dormitories for workers are a common image associated with those who move from the countryside. However, this issue may not be a significant concern, as less than 25 per cent of migrants live on construction and manufacturing sites (National Population and Family Planning Commission of China 2011; NBS 2012). Alternatively, it may be that the supply of housing in China is not adjusting to income in the ‘usual’ way, given the rapid growth in income. If floor space per capita were to have increased according to the long-run estimated relationship, then residential construction as a share of GDP would be above its current high level. The lower income coefficient estimated may also reflect an increase in the cost of building materials, which may have held back the rate of construction during this period.
| Data | Taiwan | Taiwan | IEA | IEA | China | China |
|---|---|---|---|---|---|---|
| β | 19.3 | 9.2 | 25.7 | 13.6 | 9.2 | 6.6 |
| Fixed effects | Y | Y | Y | Y | na | na |
| Year effects | N | Y | N | Y | na | na |
| Data range | 1998–2010 | 1998–2010 | 1973–1998 | 1973–1998 | 1990–2010 | 2003–2010 |
| Within R2 | 0.07 | 0.05 | 0.93 | 0.19 | 0.97 | 0.94 |
| Note: (a) For Taiwan y is our measure of real household income, for IEA and Chinese data, y is real GDP per capita. | ||||||
To be consistent with the Chinese historical experience, and also within the range found in other contexts, we choose a conservative value of 10 for China's long-run income coefficient. This choice suggests that a one per cent increase in real income, on average, would lead to a 0.1 square metre increase in urban floor space per capita. However, this value is larger than the coefficient estimated using more recent data, i.e. 6.6, so a projection of China's floor space per capita based on the value of 10 would induce a large immediate level shift in urban residential construction. To avoid this, we project floor space per capita in the following way. First, we assume floor space per capita increases in line with our long-run income coefficient of 10 by the end of the projection period.[12] Second, we interpolate all years from the present to the end of the projection period using a cubic spline, which ensures that there is no large change in the rate at which floor space per capita increases. This implies an income coefficient below 10 in the short-run that subsequently goes above 10 to allow catch-up to the estimated long-run level by the end of the projection period. Alternative assumptions for this coefficient are considered in the sensitivity analysis below.
To complete the projection of floor space per capita, we base our projection of per capita GDP growth on GDP projections from World Bank and Development Research Center (2012) and the UN population projections discussed in Section 3.2. This projection gives an annual GDP per capita growth rate that gradually falls from 9.1 per cent in 2011 to 3.6 per cent in 2040. This implies a level of PPP-adjusted GDP per capita of a touch over US$40,000 at 2005 prices by 2040.[13] The resulting projection for floor space per capita increases from 22.6 square metres per capita in 2010 to almost 40 square metres per capita in 2040 (Figure 6).
3.4 Demolitions
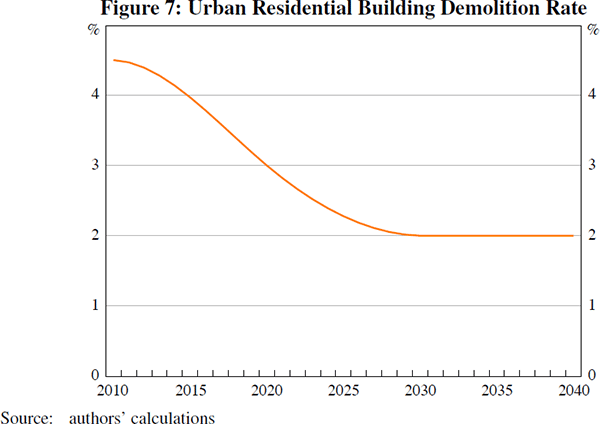
Between 2008 and 2010, around 1.8 billion square metres of floor space was demolished to reduce the number of dilapidated buildings in China (State-Owned Assets Supervision and Administration Commission of the State Council 2011). These demolitions imply an annual demolition rate of at least 4½ per cent, based on our estimates of the stock of floor space.[14]
It is unlikely, however, that China will sustain such a high demolition rate, because the stock of dilapidated residential buildings will gradually decline. As these buildings are replaced with higher-quality construction, the average life-span of a building will increase. Also, the legal system has moved to enforce property rights for citizens, which will add cost to the expropriation process and reduce the rate of demolition. Hence, we assume the demolition rate will gradually fall to 3 per cent by 2020 and to 2 per cent by 2030 (Figure 7). The 2 per cent demolition rate is in line with the depreciation rate from the Chinese national accounts, which implies an average building life span of 50 years (Lardy 2012). The depreciation profile is smoothed using a cubic spline interpolation.
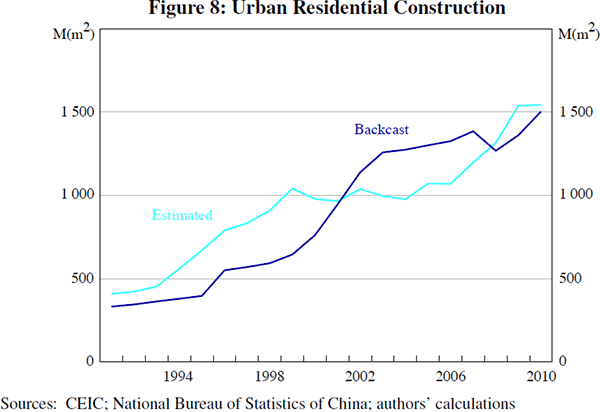
3.5 Backcast Testing the Validity of Our Approach
We can gauge the validity of our approach by comparing two series. The first is the estimated history of urban residential construction from Section 2. The second series is a backcast using the modelling approach described in Section 3.1 and applying it to actual data for each of the various components in Equations (1), (2) and (3).[15] Figure 8 shows that, despite the different methodologies and data sources, the paths are quite similar. Both series suggest that about 1.5 billion square metres of urban residential floor space was constructed in 2010 from a level of about 400 million square metres in 1991. Integrating over the 20 year period leads to approximately the same cumulative floor space construction. The alignment of these series supports our hypothesis about the reclassification of land from rural to urban discussed in Section 2, namely that rural reinforced concrete floor space should be treated as urban floor space. The two series do appear to have different cyclical properties, but there could be many reasons for this. For example, the stock of floor space per capita would depend upon the timing of land reclassification, which would affect our backcast series, but not our estimated series.
Footnotes
Demolitions are broadly defined as any floor space that is destroyed, whether it be through intent or neglect. [3]
World Urbanization Prospects is available at <http://esa.un.org/unpd/wup/index.htm.> Like the UN, we project the ratio of the urban to rural population using the weighted sum of two growth rates. The first growth rate is the growth of the ratio of the urban to rural population over the recent past (rurpast). The second growth rate is a ‘hypothetical’ growth rate (hrurt) calculated on the basis of cross-country regressions in United Nations (2012) and follows hrurt = 0.033 − 0.025PUt, where PU is the proportion of the urban population in the total. The UN keeps hrur constant at its current value, i.e. hrurt = hrur2011 for t > 2011, whereas we allow hrurt to change over time with the urbanisation rate. The weighted average of the growth rate follows rurt = Wtrurpast +(1−Wt)hrurt where Wt = 1 for the first year of the projection. Wt then declines linearly by 0.04 each year until Wt = 0, from which point it is constant. Our projections start from the most recent NBS statistics and begin with rurpast = 0.055 and hrur2011 = 0.019. rurpast is calculated from 2005 to 2011 and PU2011 = 0.51. [4]
World Population Prospects can be found at <http://esa.un.org/unpd/wpp/index.htm.> This database provides data at 5-year intervals, and we generate annual data using a cubic spline interpolation. [5]
Also, the reported increments to per capita floor space in Table 10–36 of the 2011 China Statistical Yearbook are more closely aligned with the construction numbers in Table 10–35 divided by the hukou population rather than the actual population. [6]
All data are from the NBS. Hukou data are only available for 1990 and after 1997. We therefore omit data before 1990 and the urban hukou population is linearly interpolated between 1990 and 1997. [7]
The Taiwanese GDP deflator has been declining for a number of years, reflecting falling export prices. As exports are not purchased by households, using this deflator is arguably a misleading basis for our real income calculations. [8]
As mentioned in Isaac and van Vuuren (2009), International Energy Agency (2007) contains more recent data that ‘due to changes in the methodology are not consistent with data from the earlier publication’. From the Penn World Tables, we use the ‘rgdpl2’ measure of PPP-adjusted GDP per capita, which is the ‘new, preferred growth rate series’ (Heston, Summers and Aten 2011). [9]
The countries are Australia, Canada, Denmark, Finland, France, Germany, West Germany, Italy, Japan, Norway, Sweden, the United Kingdom and the United States. Germany and West Germany have separate fixed effects. [10]
All our estimates of β are larger than the estimate of 6.3 from Isaac and van Vuuren (2009). [11]
This projection is used for both 2039 and 2040. This is to ensure, within the spline framework, that the slope at the end of the projection is consistent with the slope of the long-run path. [12]
The current level of GDP per capita, which is used as the base, is taken from the Penn World Tables. A cubic spline is used to extrapolate growth from 2030, the final projection year for World Bank and Development Research Center (2012), to 2040. [13]
These demolished buildings arose from relocation, so they were arguably predominately in urban areas, making way for improved facilities. [14]
Demolitions are assumed to start at 3 per cent of the housing stock in 1990 and are interpolated using a cubic spline. [15]