RDP 2011-08: The Mining Industry: From Bust to Boom 3. The Australian Mining Industry during the 2000s
December 2011
- Download the Paper 1.02MB
Australia is a signifcant producer and exporter of a wide range of commodities, and is well placed to beneft from the rise in demand for steel and energy. The country is endowed with reserves of coal, iron ore, bauxite, copper and gold that rank in the top six worldwide (Geoscience Australia 2010). These reserves are suffcient to sustain current production levels for many more decades, and ongoing exploration and technological advances are likely to continue to increase supply (Table 1). In contrast to these resources, Australia's reserves of oil and gas are small in a global context. While Australia's oil reserves would be exhausted in around 20 years at current rates of extraction, known reserves of gas have grown strongly over recent decades and would sustain the current production rate for an extended period.
| Share of global reserves in 2009(a) Per cent |
Remaining years of production at 2009 rate |
Share of global production Per cent | ||
|---|---|---|---|---|
| 2000 | 2009 | |||
| Coal(b) | 7 | 98 | 7 | 6 |
| Iron ore | 17 | 71 | 18 | 25 |
| Bauxite | 23 | 95 | 39 | 34 |
| Copper | 13 | 94 | 6 | 6 |
| Gold | 16 | 33 | 11 | 9 |
| Oil | 0.3 | 21 | 1 | 1 |
| Gas | 2 | 61 | 1 | 2 |
|
Notes: (a) Economic-demonstrated resources for coal, iron ore, bauxite,
copper and gold; proved reserves for oil and gas Sources: ABARES; BP Statistical Review of World Energy, June 2011; Geoscience Australia |
||||
In the early 2000s, the Australian mining industry was suffering from the weakness in global commodity markets outlined in the previous section. Parts of the industry, including gold and base metals, were in the downward phase of an investment cycle following the Asian fnancial crisis, and exploration expenditure was at its lowest level as a share of the economy since the early 1960s. The weakness was highlighted by the failures of several mining companies early in the decade, including Pasminco and Centaur Mining in 2001, and Anaconda Nickel defaulting on its bonds in 2002.[5] In a global wave of mergers and acquisitions, several Australian mining companies became part of multinationals as companies sought economies of scale to sustain proftability, with the most notable being the merger of BHP and Billiton, along with the takeovers of Mount Isa Mines (MIM) by Xstrata and North Limited by Rio Tinto. Overall, of the top 20 mining companies on the Australian Securities Exchange (ASX) in 2000, only 7 of these were still listed in Australia at the end of 2005 (Table 2).
| Top 20 mining companies listed on ASX in 2000 | ASX market capitalisation $ billion |
Mergers, takeovers and failures in the first half of the 2000s | |
|---|---|---|---|
| March 2000 | July 2011 | ||
| BHP | 32.0 | 139.5 | 2001: merged with Billiton |
| Rio Tinto(a) | 15.4 | 45.7 | |
| WMC | 7.4 | 2005: taken over by BHP Billiton | |
| Woodside Petroleum | 6.6 | 31.6 | 2001: attempted takeover by Royal Dutch Shell |
| Comalco | 5.3 | 2000: taken over by Rio Tinto | |
| North(b) | 2.6 | 2001: taken over by Rio Tinto | |
| Santos | 2.4 | 11.7 | |
| MIM | 1.8 | 2003: taken over by Xstrata | |
| Normandy Mining(c) | 1.8 |
2002: taken over by Newmont Mining (US company) | |
| Pasminco | 1.1 | 2001: placed in voluntary administration | |
| Southern Pacifc Petroleum(d) |
1.1 |
2003: went into receivership | |
| Iluka Resources | 0.8 | 7.9 | |
| Newcrest Mining | 0.8 | 30.6 | |
| Anaconda Nickel | 0.8 |
0.8 |
2002–2003: defaulted on bonds, recapitalised by investors; changed name to Minara Resources |
| Sons of Gwalia | 0.6 | 2004: placed in voluntary administration | |
| QCT Resources | 0.5 | 2000: taken over by BHP | |
| Delta Gold | 0.4 |
2002–2006: involved in series of mergers and takeovers, eventually taken over by Barrick Gold (Canadian company) | |
| Ticor | 0.3 | 2005: taken over by Anglo American | |
| Novus Petroleum | 0.2 |
2004: taken over by Medco Energi (Indonesian company) | |
| Ashton Mining | 0.2 | 2000: taken over by Rio Tinto | |
|
Notes: (a) Includes market capitalisation of Coal & Allied, which was
majority owned by Rio Tinto throughout the decade, and ERA following Rio
Tinto's takeover of North Ltd Sources: AFR (2011); BRW (2000); RBA; company announcements |
|||
The value of Australia's resource exports rose strongly during the 2000s, to be over half of total exports by the end of the decade, driven by annual average growth in commodity prices of 9 per cent in Australian dollar terms (Table 3). In contrast, the volume of resource exports only increased at an annual rate of 3 per cent over the period, half its rate of growth during the 1990s. Within the mining industry there was considerable structural change over the decade. In the 1990s, processed metals (such as aluminium, copper and gold) made up almost one-third of Australia's resource exports, as large as the combined exports of iron ore and all other ores. However, by the end of the 2000s, Australia's comparative advantage had clearly shifted towards the export of coal and iron ore, where volumes and especially prices growth were high. In contrast, processed metals export volumes contracted, and their share in total exports fell sharply. With the gradual exhaustion of some of Australia's major oil basins, the volume of crude oil exports also fell, although this was offset by the shift in production away from oil towards LNG, which grew at a rapid pace over the decade.
| Average annual growth | Share of total export values | ||||||||
|---|---|---|---|---|---|---|---|---|---|
| Volumes | Prices | ||||||||
| 1990–2000 | 2000–2010 | 1990–2000 | 2000–2010 | 1990 | 2000 | 2010 | |||
| Coal | 6 | 6 | −1 | 10 | 9 | 6 | 15 | ||
| Oil and gas | 9 | 1 | 6 | 5 | 5 | 9 | 8 | ||
| Crude oil | 11 | −2 | 5 | 6 | 3 | 6 | 4 | ||
| LNG | 11 | 9 | 6 | 5 | 1 | 2 | 3 | ||
| Iron ore | 5 | 10 | 2 | 15 | 4 | 3 | 17 | ||
| Other ores | 4 | 0 | 0 | 9 | 10 | 6 | 8 | ||
| Processed metals(a) | 5 | −2 | 0 | 5 | 13 | 10 | 7 | ||
| Total resources(a) | 6 | 3 | 1 | 9 | 40 | 35 | 55 | ||
|
Note: (a) Net of gold imports, which are largely re-exported Sources: ABS; ABARES; RBA |
|||||||||
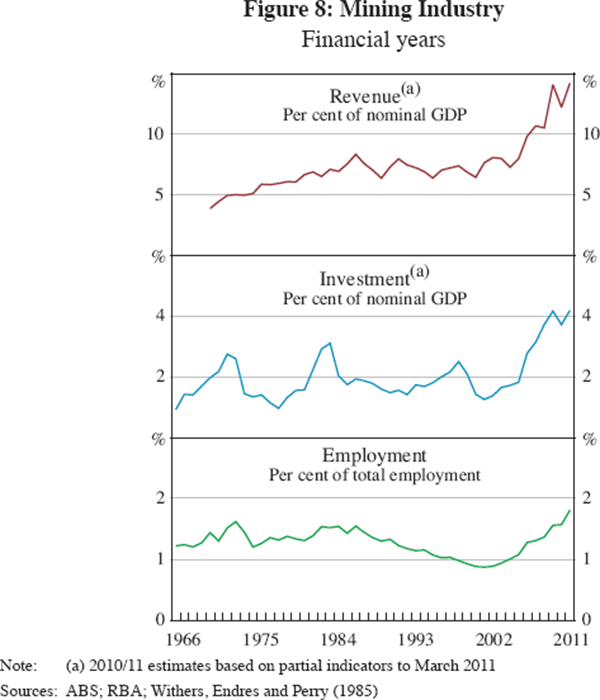
In a historical context, the mining boom in the 2000s was much larger as a share of the economy than the mining booms in previous decades in terms of sales revenue, investment and employment (Figure 8).[6] Mining revenue increased from 6 per cent of GDP in 2000 to 14 per cent by the end of the decade, driven by the growth in bulk commodity export receipts. Mining investment rose from 1½ per cent of GDP in 2000 to over 4 per cent recently, to be well above the levels during previous booms. Mining employment increased from under 1 per cent of total employment in 2000 – the lowest share in at least a century – to 1.7 per cent by the end of the decade – the highest share in over 50 years. These ratios are continuing to rise into the current decade.
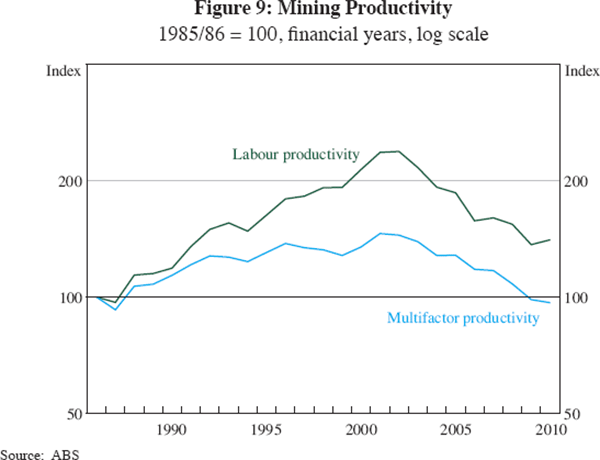
While mining industry revenue has grown rapidly over the decade, the volume of output has only grown at an annual average rate of 3 per cent, despite mining employment more than doubling and strong growth in the capital stock. As a consequence, both labour productivity and multifactor productivity are estimated to have fallen from around 2003, when commodity prices started rising sharply (Figure 9). This followed a period of strong productivity growth, as mining frms reduced costs through industry consolidation, outsourcing and the adoption of new technologies in response to the low commodity prices around the beginning of the decade (Mélanie et al 2002). Topp et al (2008) explored the potential explanations for this fall in productivity, highlighting two factors as the most signifcant, with both related to the mining boom. First, the depletion of reserves for commodities such as oil and copper reduced productivity, as mining companies began to extract lower-grade resources using more inputs.[7] This effect was exacerbated by the rise in commodity prices, which made the extraction of more marginal deposits proftable. Second, there are long lead times between investment in new capacity and the output coming on stream, with Topp et al estimating that the lead time had historically been around three years.[8] Looking ahead, production and export volumes of iron ore, coal and LNG are expected to grow strongly over coming years, as currently committed investment projects are completed, which may contribute to a recovery in mining productivity (Christie et al 2011).
The rise in mining revenue over the 2000s has been dominated by iron ore and coal, while the largest investments have occurred in oil and gas, particularly LNG (Table 4). In contrast, the mining of other ores has experienced a much smaller boom, while metals manufacturing has weakened over the decade. The composition of mining employment is quite different from revenue and investment, with the oil and gas industry employing relatively few workers, refecting its high capital intensity. Most employees in the industry work in ores mining and mining exploration and support services. The most striking trend in employment has been the steady decline of metals manufacturing, which employed more than twice as many workers as the mining industry at the start of the decade, but ended the 2000s as a smaller employer.
| Revenue | Investment | Employment | ||||||
|---|---|---|---|---|---|---|---|---|
| 1999/2000 | 2009/10 | 1999/2000 | 2009/10 | 1999/2000 | 2009/10 | |||
| Share of total | % | % | % | % | % | % | ||
| Coal | 25 | 29 | 8 | 14 | 25 | 27 | ||
| Oil and gas | 26 | 18 | 36 | 44 | 5 | 10 | ||
| Iron ore | 9 | 23 | 4 | 19 | 8 | 9 | ||
| Other ores | 35 | 21 | 49 | 16 | 41 | 33 | ||
| Mining services | 5 | 9 | 3 | 6 | 21 | 21 | ||
| Totals | $b | $b | $b | $b | '000s | '000s | ||
| Mining | 43 | 157 | 10 | 48 | 78 | 173 | ||
| Metals manufacturing(a) | 13 | 17 | 3 | 7 | 182 | 147 | ||
|
Note: (a) Metals manufacturing value added is presented instead of revenue to avoid double counting the inputs from the mining industry Sources: ABS; RBA; company reports |
||||||||
3.1 The Boom in Bulk Commodities
The rise of Chinese demand for steel and energy has led to signifcant changes in bulk commodities markets. Iron ore and coking coal are key inputs into the production of steel, while thermal coal is primarily used to generate electricity. Australia is a relatively low-cost supplier of iron ore and coal, with large reserves of hematite iron ore, requiring little processing before export, and good quality black coal, characterised by low ash and sulphur content. Australia's mining operations are also relatively effcient and close to Asian markets, reducing freight costs (Mélanie et al 2002). Iron ore has become a larger share of the mining industry over recent years, with revenues rising from less than 1 per cent of GDP through the 1990s to over 3 per cent of GDP by the end of the 2000s, and investment has risen well above historical levels as a share of GDP (Figure 10).
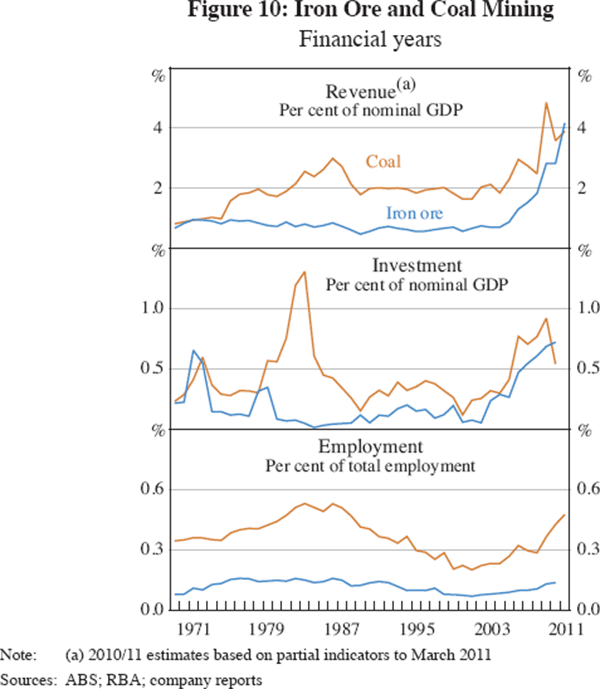
Revenue in the coal industry has also risen strongly over recent years, to above the highs following the energy boom in the early 1980s, while investment has risen to its highest levels since that period.
At the beginning of the decade, analysts were forecasting weak growth in demand for coking coal and iron ore. They were expecting moderate increases in world steel production to be partly offset by more effcient steelmaking operations that required fewer raw materials. While growing demand from China was recognised, China was thought to have abundant reserves of coal, and following the Asian fnancial crisis, the Chinese Government provided incentives for producers to export coal, with the consequent increase in exports depressing international prices (Schneider 2004; Andrews 2009). Following the global wave of consolidation noted earlier, Rio Tinto, BHP Billiton and Vale (in Brazil) accounted for around 70 per cent of the seaborne trade in iron ore (ABARE 2002).
The benchmark contract prices for bulk commodities, which had been settled annually with Japanese steel mills and utilities since the 1960s, rose strongly in response to the surge in Chinese demand. Thermal coal contract prices increased by 70 per cent in 2004, while coking coal prices rose by 120 per cent and iron ore prices by 70 per cent in 2005 (Figure 11). These were the largest price increases seen since the energy price boom of the 1970s. However, there were doubts at the time as to whether the rapid growth in demand would be sustained, with commodities analysts predicting longer-term price declines of around 40 per cent (discussed in RBA (2005)). Throughout the remainder of the decade, analysts repeatedly forecast iron ore and coal prices to remain fat or decrease from their relatively high levels, only for them to increase further in subsequent years, consistent with the general under-prediction of Chinese growth. Following the contract price rises of 2004 and 2005, investment in the coal and iron ore industries as a share of the economy increased to above historical averages.
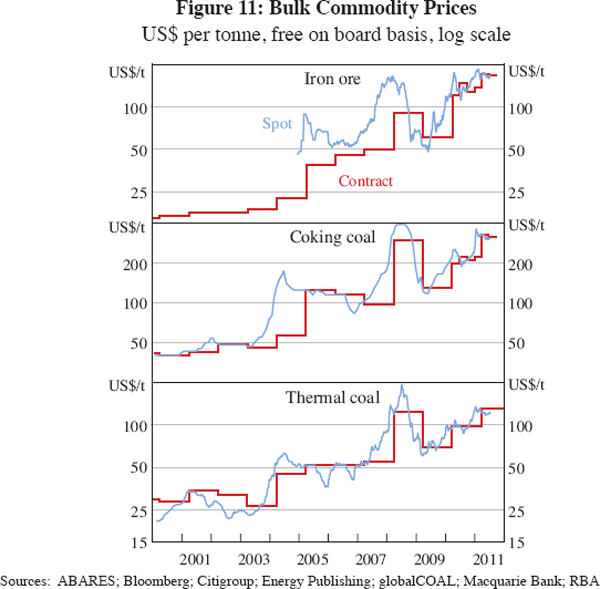
There was a second round of very large increases in bulk commodity contract prices in 2008, which was followed shortly after by a collapse in demand during the North Atlantic fnancial crisis, and eventually an overhaul of the pricing mechanism for iron ore and coking coal when demand recovered. Spot prices soared through 2007, culminating in coking coal contract prices rising by 200 per cent in 2008, and thermal coal prices by 125 per cent. However, iron ore negotiations were unusually protracted. While Vale settled for a 65 per cent increase in iron ore prices, the Australian producers sought a higher price from their Asian customers to take into account the lower cost of shipping iron ore from Australia relative to Brazil. The steel mills eventually agreed to an 85 per cent increase in Australian iron ore prices. When the North Atlantic fnancial crisis struck in late 2008, the demand for steel collapsed, spot prices fell dramatically, and some customers were unwilling to pay the contract price, preferring instead to purchase more cheaply on the spot market. As the market tightened again in late 2009, producers advocated shorter-term reference pricing to narrow the gap between spot and contract prices. Although customers preferred the certainty provided by the annual benchmark system, they accepted a shift to quarterly reference prices for both iron ore and coking coal in 2010.[9] Since then, the producers have continued to seek short terms for contract prices.
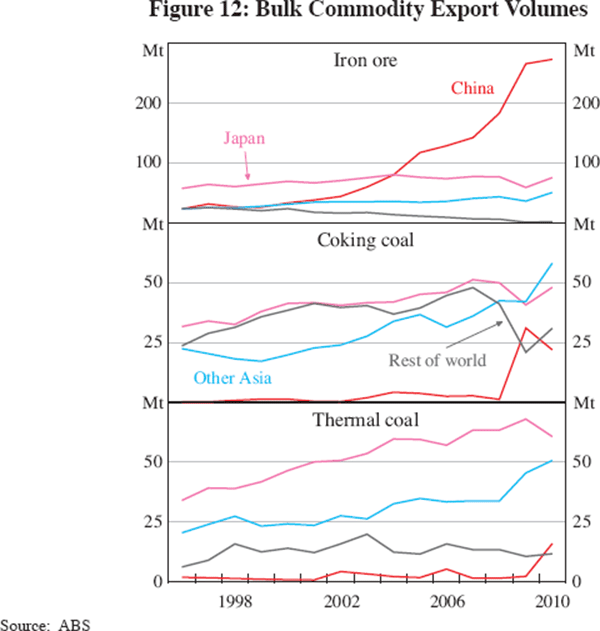
The increase in Chinese demand through the decade had a very clear effect on the direction of trade in the seaborne iron ore market. However, the effect on the global coal market was more subtle, given China's status as the world's largest producer, as well as consumer. The proportion of global iron ore exports purchased by China rose from around 15 per cent in 2000 to a peak of almost 70 per cent in 2009, with Australian iron ore remaining in high demand due to the lower cost of shipping relative to Brazil. Consistent with this, Australia overtook Brazil during the decade to become the world's largest producer of iron ore, supplying a quarter of the world's production in 2009 (Table 1). While China remained self-suffcient in coal until 2008, its exports began to fall in 2003, as the Chinese Government removed export incentives. During this period, Australia's coal exports to other Asian countries increased, buoyed by Indian demand in particular (Figure 12). While China's demand for steel recovered in 2009 following the North Atlantic fnancial crisis, lower global prices meant Chinese coal mines – which are relatively high-cost producers – were not able to compete, and imports of Australian coal increased sharply. Chinese steel mills have continued to purchase a signifcant amount of coal from Australia since then.
The boom in iron ore demand later in the decade also triggered several attempts to further consolidate the Australian iron ore industry. As spot prices soared in late 2007, BHP Billiton made a bid to purchase Rio Tinto, which was rejected and eventually abandoned in November 2008 during the North Atlantic fnancial crisis. Rio Tinto was highly leveraged following its takeover of Alcan in 2007, placing the company under fnancial pressure during the crisis. In February 2009, Rio Tinto entered into an agreement with the Chinese company Chinalco to receive an equity injection. However, following an improvement in market conditions, Rio Tinto withdrew from this deal in June 2009, and instead agreed to an iron ore production joint venture with BHP Billiton. This proposal was opposed by steel producers around the world and competition regulators, and was eventually abandoned in October 2010. So at the close of the decade, the ownership of the existing iron ore mines in Australia remained similar to that in 2001.
The proftability of the iron ore industry also encouraged new companies to enter later in the decade, with Fortescue Metals exporting its frst iron ore in 2008. Some of the new developments currently under construction are fnanced by Chinese steel producers, including CITIC Pacifc's Sino Iron project and Ansteel's joint venture with Gindalbie Metals to develop the Karara iron ore project. Joint ventures involving Asian steel producers have historically been important for the expansion of the Australian iron ore and coal industries, with many of the mines opened since the 1960s developed through joint ventures.[10]
The contrast in the ability of the Australian iron ore and coal industries to increase export volumes is partly explained by their differing supply-chain ownership structures. The iron ore industry has a more vertically integrated supply chain, with Rio Tinto and BHP Billiton controlling the mines, railways and ports they use to produce and export iron ore. In contrast, growth in coal exports was slower to pick up, in part refecting co-ordination diffculties among the many participants in the coal supply chain, where the mines, railways and ports are typically owned and operated by several different private and public corporations. These are most acute in New South Wales, and in response the Hunter Valley Coal Chain Coordinator was established from 2010 to plan and co-ordinate long-term capacity usage in the region, along with a new agreement with the mine owners to fund future infrastructure capacity.[11] Early reports indicate these new arrangements are better aligning incentives and streamlining future capacity expansions.
Looking ahead, the pipeline of committed projects is likely to lead to large increases in global iron ore and coal production capacity over coming years. In Australia, there are around $35 billion worth of iron ore investment projects committed, which are projected to increase Australian iron ore export capacity by a further 50 per cent between 2011 and 2015. Signifcant iron ore production capacity expansions are also expected to take place in Brazil over coming years. Australia's capacity to export coal in 2013 is projected to be around 20 per cent higher than it was in 2010 (Christie et al 2011). Signifcant expansions in thermal coal capacity are likely to take place over coming years in Indonesia, South Africa and Colombia, although the global supply of coking coal is not expected to increase to the same extent (ABARES 2011).
3.2 The Decline of Oil and the Rise of LNG
In aggregate, oil and gas revenue did not change signifcantly as a share of the economy over the 2000s, with rising prices and LNG production offset by falling oil production (Figure 13). Australia's oil production peaked in 2000, and since then has fallen by almost 40 per cent due to the maturing of oil wells in the Bass Strait and the basins off Western Australia. In contrast, LNG production more than doubled over the decade, driven by the expansion of the North West Shelf LNG Project off Western Australia, which accounts for over 80 per cent of Australia's total production. As a result of these developments, LNG increased as a share of oil and gas exports from around 20 per cent at the beginning of the decade to 40 per cent by the end. Oil and gas are the most capital-intensive part of the mining industry, with a relatively high level of investment, and although employment has grown strongly during the decade, the industry only accounts for a small share of total mining employment.
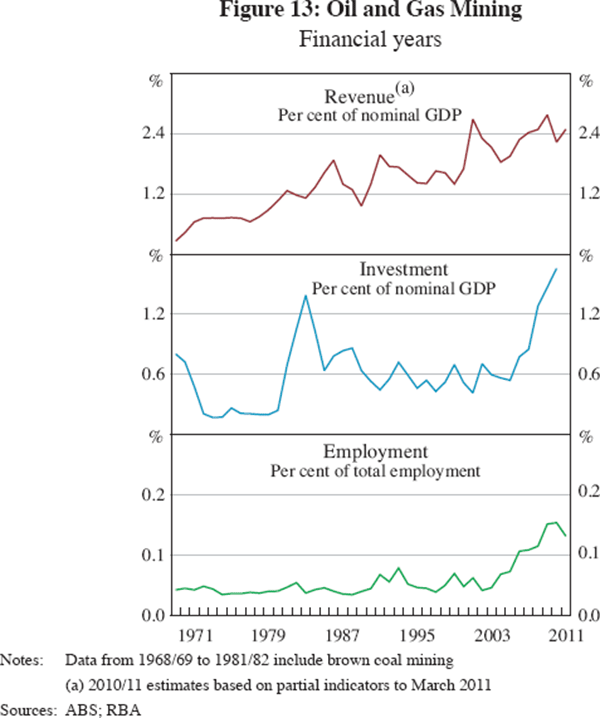
The Australian oil and gas industry has contributed around half of the rise in aggregate mining investment, driven by a series of large LNG projects (Table 5). As a share of the economy, oil and gas investment at the end of the 2000s was well above the peak in the energy boom of the early 1980s, during which investment in the North West Shelf Project commenced. During the 1980s and 1990s, there were large discoveries of gas, including the Gorgon feld, while in the early to mid 2000s there were further signifcant discoveries off Western Australia, with known gas reserves growing by around 40 per cent. The major investments in oil and gas during this period were the expansion of the North West Shelf Project, and the construction of the Darwin LNG plant. Later in the decade, investment in the industry rose sharply, with joint ventures involving multinational and Australian petroleum companies and Asian utilities developing a range of projects. The $15 billion Pluto project commenced in 2007, followed by the $43 billion Gorgon project in 2009, one of Australia's largest ever resource projects.
| Project | Joint-venture partners | Period of development | Cost(a) $ billion |
Production capacity mtpa |
|---|---|---|---|---|
| North West Shelf Phases IV and V |
BHP Billiton, BP, Chevron, Japan Australia LNG, Shell and Woodside |
2001–2008 | 5 | 8.8 |
| Darwin | ConocoPhillips, Eni, Santos, INPEX, Tokyo Electric and Tokyo Gas |
2003–2006 | 2 | 3.6 |
| Pluto Train 1 | Woodside, Tokyo Gas and Kansai Electric |
2007–2012 | 15 | 4.3 |
| Gorgon | Chevron, ExxonMobil, Shell, Osaka Gas, Tokyo Gas and Chubu Electric |
2009–2016 | 43 | 15.0 |
| Queensland Curtis (CSG-LNG) |
BG Group | 2010–2014 | 15 | 8.5 |
| Gladstone (CSG-LNG) |
Santos, Petronas, Total and Kogas |
2011–2015 | 16 | 7.8 |
| Prelude | Shell | 2011–2016 | 12 | 3.6 |
| Australia Pacifc Phase 1 (CSG-LNG) |
Origin Energy, ConocoPhillips and Sinopec |
2011–2015 | 13 | 4.3 |
|
Note: (a) The cost estimates are from company and government announcements; where costs were reported in US$, the exchange rate at the time of theannouncement has been used to convert into A$ Sources: RBA; company and government announcements |
||||
Over the 2000s, improvements in extraction technology and high energy prices also supported the development of coal seam gas (CSG) reserves in Queensland.[12] At the beginning of the decade, consideration was being given to installing a gas pipeline between Papua New Guinea and Queensland to supply the eastern states of Australia, since gas resources in these states were being steadily depleted (Fainstein, Harman and Dickson 2002). At the same time, CSG exploration activity in Queensland started picking up following the development of drilling technologies that significantly decreased the cost of drilling wells. Production of CSG increased in the early 2000s, to the point where it was supplying around 60 per cent of Queensland's gas demand in 2006. From 2006 to 2009, further exploration resulted in a fivefold increase in known CSG reserves, raising the prospect of eastern Australia joining Western Australia as an exporter of LNG to the Asian region (Geoscience Australia 2007, 2010). Three CSG-LNG projects in Queensland have recently received investment approval – the frst CSG-LNG projects in the world to progress to this stage of development. When committed projects in Western Australia and Queensland are combined, Australia's LNG export capacity is expected to be almost three times higher in 2016 than it was in 2010 (Christie et al 2011).
Rising energy security concerns in Asia have also helped to underpin investment in the Australian LNG industry. As noted above, Australia's reserves of gas are small on a global scale, and Australia's potential customers for LNG in Asia – particularly Japan, Korea, China and India – are all relatively close to countries with large gas reserves, such as Russia, Turkmenistan and Iran, where it is possible to import gas through pipelines potentially more cheaply than importing LNG. However, geopolitical issues have led countries in the region to pursue multiple sources of natural gas. Compared to many of the countries with large gas reserves, Australia is viewed as politically stable, both as a destination for petroleum investment and as a source of supply (Angevine and Cervantes 2011). Consistent with this, the very first contract to supply LNG to China was granted to Australia's North West Shelf project in 2002 (Schneider 2004). The interest in Australian LNG has also been enhanced by Qatar's decision in 2005 to place a moratorium on further development of its North Dome gas field, which is the largest field in the world. In this context, the joint ventures in Australian LNG have been able to secure the long-term supply contracts with Asian energy companies necessary to justify developing such large capital-intensive projects.
3.3 Where the Boom Passed By: Other Ores and Metals Manufacturing
The mining of other ores (which include bauxite, copper, gold, lead, nickel and zinc) did not perform as strongly over the 2000s (Table 3). The decade started poorly, with the mid 1990s investment boom in base metals and gold ending with the Asian financial crisis, and investment and employment falling to record lows as a share of the economy. While revenue and investment increased with base metals prices to a peak in 2007, they then eased with the subsequent sharp price falls during the North Atlantic financial crisis (Figure 14). Many producers scaled back or ceased production, with the most prominent example being BHP Billiton's closure of the Ravensthorpe nickel mine in 2009 after less than one year of operation, while Oz Minerals, Australia's third largest diversified mining company at the time, sold most of its assets to the Chinese company Minmetals to reduce its debt burden. Part of the weakness in export volumes over the decade was also due to declining ore grades, particularly for gold, nickel and lead (Mudd 2010). Nevertheless, with the partial recovery in base metals prices since the crisis and the ongoing strength in gold prices, there have been some capacity expansions. These have included the reopening of the Boddington gold mine in 2009, which is expected to become Australia's largest gold mine once at full capacity. There are also some projects under consideration, including BHP Billiton's plans to significantly expand its Olympic Dam copper, uranium and gold mine (ABARES 2011).
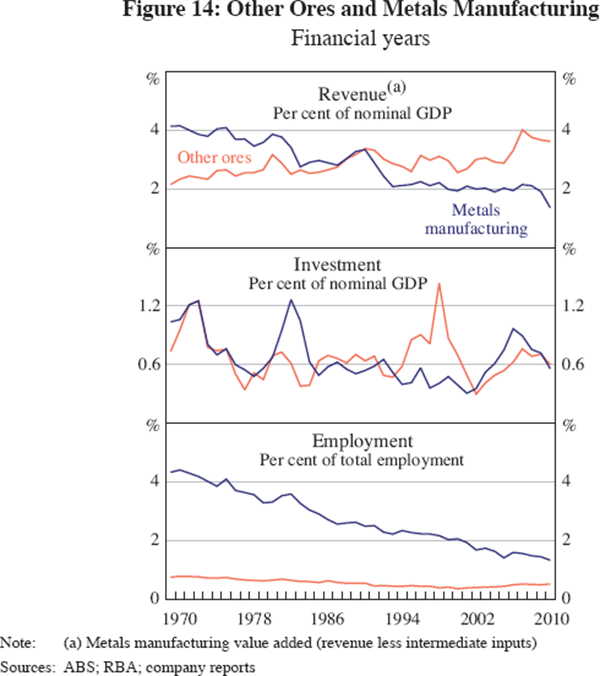
The metals manufacturing industry, which includes smelting, refning and producing metal products, has not been a signifcant benefciary of the mining boom. Metals manufacturing in Australia has faced increased competition from Chinese smelters and refineries with greater scale and lower costs (Maurer et al 2004), while profit margins have been affected by higher energy prices and the appreciation of the Australian dollar. The industry's value added remained fat through most of the 2000s as a share of the economy, before contracting sharply over 2008–2010, as it did during the recessions in the early 1980s and early 1990s. The export volume of processed metals fell over the decade as some processing facilities were shut down, with the weakness broad based across a wide range of refined metals. For instance, BHP Billiton and Rio Tinto both developed iron plants in Western Australia during the late 1990s and early 2000s to add value to iron ore, but these plants have since been shut down. Another example is copper smelting and refining, which has been taking place at Mt Isa and Townsville since the 1950s, with the current owner Xstrata announcing in 2011 that these plants would be closed down over coming years. While investment in metals manufacturing picked up in the middle of the decade, it has since fallen back, and according to New, Ball, Copeland et al (2011), in 2011 there were only two metals processing projects under construction (both alumina refineries) and no committed projects.
Footnotes
Pasminco (Australia's largest zinc mining company and owner of the Century Zinc mine) and Centaur Mining (a nickel and gold exploration and mining company) both failed in 2001 as a result of falling commodity prices and their currency hedging strategies. Anaconda Nickel (developer of the Murrin Murrin nickel mine) went into default on its bonds in 2002, although it recovered following an equity raising from existing shareholders and was renamed Minara Resources in 2003. [5]
Mining revenue is almost entirely sales and service income; it also includes government funding for operational costs, capital work done for own use and the change in inventories. [6]
Mudd (2010) fnds there are long-term declines in average ore grades processed for most metallic minerals in Australia. There is also a compositional element: the oil industry, which is highly capital intensive and therefore has a relatively high level of labour productivity, has been receiving less weight in mining sector productivity measures as its output falls. [7]
Consistent with this, Gruen and Kennedy (2006) noted that it took over fve years from the start of the mining boom in the late 1970s for commodity export volumes to start growing strongly. Also see Eslake (2011) for a discussion of mining productivity. [8]
Pricing for thermal coal continues to be a combination of annual benchmarks and a relatively liquid spot market. [9]
Rio Tinto's Robe River mine was developed from 1970 with the Japanese company Mitsui, and the Channar mine from 1987 with SinoSteel, which was the frst overseas mining project entered into by a Chinese company. BHP's Mount Newman and Mount Goldsworthy joint ventures were developed in the late 1960s with the Japanese companies Mitsui and Itochu, while BHP's Wheelara joint venture was entered into in 2004 with four Chinese steel mills and two Japanese companies. [10]
The process to develop central planning and co-ordination for the Hunter Valley coal chain started earlier in the decade with the establishment of the Hunter Valley Coal Chain Logistics Team in 2005 [11]
The development of unconventional gas supplies in Australia is part of a global trend, with companies in North America utilising new drilling technologies to develop large reserves of shale gas during the 2000s. To extract coal seam gas, a large number of wells are drilled over time, and a significant amount of waste water is produced. The environmental impacts of projects are considered by various government bodies before approval is granted. [12]