RDP 2006-08: A Survey of Housing Equity Withdrawal and Injection in Australia Appendix B: Survey Details
August 2006
- Download the Paper 422KB
Design
The survey sample was selected from Roy Morgan Research's (RMR) Single Source database, which RMR assess to be an accurate representation of Australian households. From this database, households were drawn based on 2001 Census information on the proportion of households living in each region and dwelling type.[20] To raise the accuracy of responses, households were sent a letter indicating the financial information that would be asked in their subsequent telephone interview. Around the time the letters were sent, the Bank issued a media release informing the public of these activities.[21] The survey was tested extensively, both in-house and on a pilot sample of 50 households, before final implementation in February 2005.
In order to achieve the 4,500 responses, RMR endeavoured to contact 10,859 households, broadly in line with expected refusal rates. The average survey length was just over eight minutes, although there was a wide dispersion around this, mostly reflecting variation in the extent of property market involvement. After analysing the responses, RMR endeavoured to re-contact 301 households to clarify ambiguities, a normal part of their surveying process. This occurred in early March 2005; 260 households were successfully re-contacted.
To reduce complexity, respondents were instructed to exclude any transfer costs when answering questions about the sale or acquisition of property. These costs were accounted for by imputation in the data preparation phase according to the location and value of the property, including state-based duties and ownership assistance schemes, and agent and legal fees. Although incorporating these housing expenditures resulted in modest changes in the net values injected or withdrawn, it had very little impact on whether households were classified as net equity injectors or withdrawers. To help limit the length of the survey, some demographic data were instead extracted from RMR's Single Source database.
Although efforts were made to ensure that the sample was representative of the overall population in terms of geographic coverage and dwelling type, the survey results were re-weighted marginally to further refine the representativeness with respect to these two parameters. As part of this process, the 4,500 household responses were scaled up to correspond to the 2001 Census estimate of around 7.6 million households in Australia. This re-weighting and scaling had minimal impact on the distributions of the variables in the survey.
Imputation
RMR checked the data thoroughly, focusing on the internal consistency of responses. RBA staff also performed similar tests and extended them to assess plausibility in a range of areas. Cases of inconsistencies and missing responses were generally corrected using answers provided elsewhere in the survey.
Household income was the dominant missing item among the remaining data, with 641 households (14 per cent of respondents) having no response for this variable. Fortunately, all other demographic data, including the income of the main earner, were complete. Other questions also had missing responses, but generally to a much lesser extent or for variables of lesser interest.
To impute household income, we adopted the hot-deck methodology, which is used in the British Household Panel Survey (BHPS) (ISER 2006) and discussed in Watson and Wooden (2003). As in the BHPS and Yates, Wulff and Reynolds (2004), we used variables that are predictive of household income (main earner's income, number of full-time workers and number of adults in the household) to group similar households together. We then populated the missing income observations with values from randomly selected households in the same group. Hot-deck imputation was preferred to deterministic methods, such as mean imputation, because it maintains an element of randomness and should not bias the distribution (Kalton and Kasprzyk 1982). Nonetheless, the standard error of the income coefficient is likely to be underestimated, and covariances between income and variables other than the selected explanatory variables are reduced. More sophisticated imputation methods could address these problems, but were considered too resource-intensive for the purposes of this paper.
Following Watson (2004), we undertook several checks of the quality of the imputed data, including: comparing the distribution of household income before and after imputation; undertaking within-sample testing; comparing the distribution to external data; and including a dummy variable for the imputed values in our modelling of housing equity changes (Ellis et al 2003). The imputed data performed reasonably well against all of these tests.
Characteristics of the Sample
The distribution of household income shifted slightly lower after imputation, since it allowed us to include relatively more low-income earners (Figure B1). The profile of the imputed household income series is fairly close to 2004 Household, Income and Labour Dynamics in Australia (HILDA) Survey data, although our sample contains relatively more households earning less than $40,000 per year.
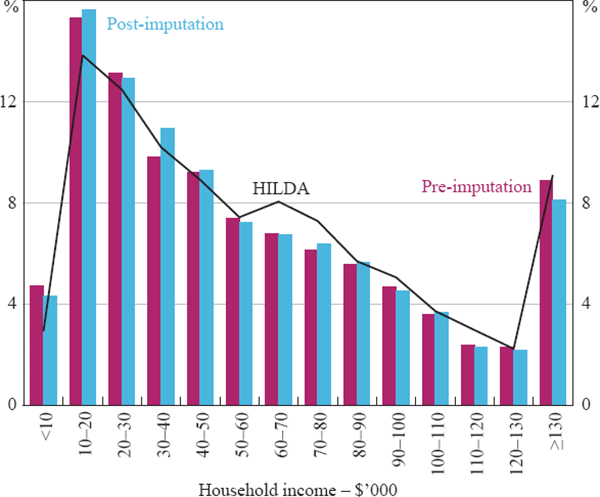
Sources: HILDA Survey 2004, Release 4.0; RBA
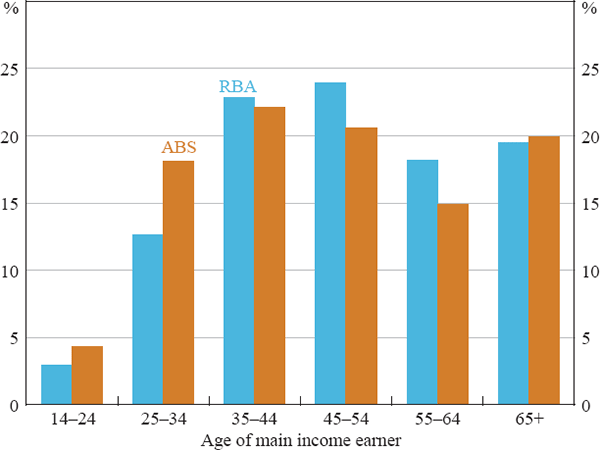
With respect to other relevant household characteristics, the sample appears reasonably representative (Table B1). Of the main household characteristics of interest, the greatest discrepancies between the sample and population estimates (based on ABS and HILDA Survey data) relate to the age of the main income earner (Figure B2); a considerable overweighting of 45–64 year olds means that the overall sample is older than the population.
| RBA | ABS/HILDA | |
|---|---|---|
| Housing tenure(a) | ||
| Own the property outright without debt | 34.8 | 34.9 |
| Own the property with debt | 37.4 | 35.1 |
| Rent | 26.7 | 27.6 |
| Other | 1.1 | 2.4 |
| Total | 100.0 | 100.0 |
| Labour-force status of main income earner(b) | ||
| Employed full-time | 57.6 | 53.4 |
| Employed part-time | 10.7 | 13.4 |
| Unemployed | 1.7 | 2.5 |
| Not in the labour force | 29.9 | 30.7 |
| Total | 100.0 | 100.0 |
| Other demographic information(a) | ||
| Average number of people in household | 2.8 | 2.5 |
| Average number of employed persons in household | 1.3 | 1.2 |
|
Notes: (a) ABS ‘2003–04 Survey of Income and Housing’ (b) HILDA Survey 2004 Sources: ABS; HILDA Survey 2004, Release 4.0; RBA |
||
Sources: ABS; RBA
Footnotes
Households living in multi-storey units are under-represented in RMR's database, as they are more likely than those in other dwellings to refuse RMR's door-to-door interviewers. [20]
See http://www.rba.gov.au/media-releases/2005/mr-05-01.html. [21]