RDP 2004-06: Profitability of Reserve Bank Foreign Exchange Operations: Twenty Years After the Float 5. Profits from Intervention
September 2004
- Download the Paper 585KB
Formal evaluations of the efficacy of intervention are difficult to perform because it cannot be known how the exchange rate would have behaved in the absence of intervention. Furthermore, there is an endogeneity problem when estimating contemporaneous effects of intervention, since intervention is mostly triggered by exchange rate movements (Kearns and Rigobon 2003).
Researchers have come up with indirect measures to evaluate whether intervention has exerted a stabilising influence on the exchange rate. One such measure is the ‘profits test’ (Friedman 1953). The application of the profits test relies on the central bank acting as a stabilising long-term speculator. If the objective of the central bank is to limit the fluctuations in the exchange rate, this will tend to involve the purchase of the local currency (sale of foreign exchange) when the exchange rate is relatively low, and the sale of the local currency (purchase of foreign exchange) when the exchange rate is high. If the central bank is successful in buying low and selling high, its intervention should yield a profit. It follows from this that if a central bank has been profitable in its intervention, it must have bought low and sold high, therefore contributing to the stabilisation of the exchange rate.
While we consider the behaviour of the RBA and the Australian dollar over the post-float period to be well suited to the application of the profit test, this does not imply that the approach will necessarily always be the most relevant in the evaluation of intervention. For example, one possible limitation in using trading profitability to gauge the effectiveness of intervention may arise when the exchange rate exhibits a persistent trend. In such cases the central bank may not have the opportunity to rebuild reserves at a higher exchange rate. Nonetheless, intervention may still have exerted a stabilising influence despite being unprofitable in a trading sense (although this is not the case for Australia over the post-float period).
As can be seen in Figure 2, the RBA has been successful in buying low and selling high in its interventions. The horizontal lines on the graph mark the average exchange rates at which total net transactions took place in each episode. These rates reflect the average exchange rate at which the RBA added to or subtracted from its overall foreign currency position by entering into deals in the market or with its clients. In the first cycle, the RBA bought Australian dollars (sold foreign exchange) at an average rate of US71.8 cents and subsequently sold Australian dollars (bought foreign exchange) at an average exchange rate of US76.9 cents. The respective figures in the second cycle were US72.0 cents and US77.8 cents; and in the third cycle they were US59.9 cents and US67.9 cents. Since in each cycle the RBA bought Australian dollars at a lower exchange rate than it subsequently sold them, the figures indicate that each cycle of intervention, and therefore intervention over the post-float period as a whole, has been profitable.
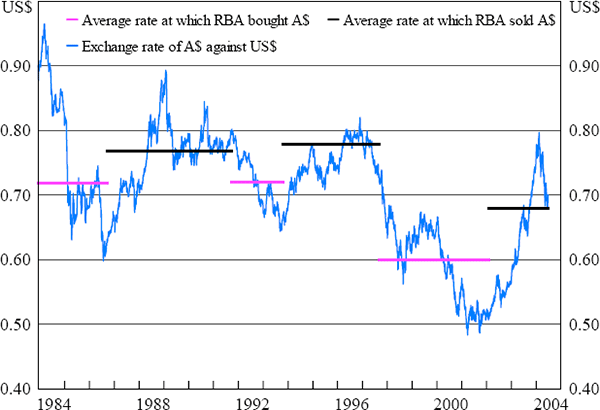
Sources: RBA; Reuters
In this study, we measure the profitability of intervention in the period from the float on 12 December 1983 to 30 June 2004. The profitability of the RBA's operations in relation to its total foreign exchange position can be broken up into three main components as described below.[5]
5.1 Realised Trading Profits
Realised trading profits are those that accrue from trades that act to close out part of an existing open position.[6] Realised gains or losses are measured by comparing the rate applicable to a transaction with the average rate at which the position was established. The calculation can be written as:
where:
Πrp denotes realised trading profits;
m is the reduction in an existing foreign currency position, with m>0 for sales of foreign currency in a long position, and m<0 for purchases of foreign currency in a short position;
e is the exchange rate at which a transaction is made in terms of the number of Australian dollars per unit of foreign currency; and
s is the weighted-average exchange rate at which the position is acquired.
5.2 Unrealised Trading Profits
As the name suggests, unrealised trading profits represent the gain or loss from marking any remaining open position to market at time t. The implied gains or losses result from comparing the prevailing market rate to the average rate of establishing the existing open position, and can be written as:
where:
all notation is as previously explained;
Πup denotes unrealised trading profits; and
ν is the addition to an existing foreign currency position, with ν>0 for purchases of foreign currency in a long position, and ν<0 for sales of foreign currency in a short position.
5.3 Net Interest Earnings
The net interest earnings component of the profit calculation represents an attempt to capture the gain or loss in terms of interest income from switching between domestic and foreign assets which results from the central bank's operations in the foreign exchange market. The impact on interest income arises because domestic and foreign interest rates are not normally the same.
This component of profitability is particularly important if the exchange rate exhibits a longer-term trend that dominates the cycle. In this case the realised and unrealised trading profits alone may not be a reliable gauge in assessing the effectiveness of intervention. For example, if the exchange rate were to exhibit trend depreciation this may prohibit the rebuilding of reserves at an exchange rate higher than at which they were spent. However, intervention may have contributed to the stabilisation of the exchange rate around the broader trend and could therefore be judged to have been successful, albeit unprofitable. The inclusion of net interest earnings in this example would add to profitability as long as there is a long term tendency toward uncovered interest parity, which would imply that interest rates in the economy whose exchange rate is depreciating are on average higher than abroad.[7]
The addition to profits from net interest earnings can be written as:
where:
all notation is as previously explained;
Πni denotes net interest earnings; and
r and r* are the short-term interest rates on Australian dollar and foreign currency assets, respectively.
5.4 Methodologies of calculating profits
The majority of foreign exchange reserves until the early 1990s were held in US dollars. With the shift to a diversified reserves portfolio in mid 1991, while intervention was still exclusively conducted in Australian dollars against the US dollar, it has been followed by transactions in the European euro (previously the Deutschemark) and the Japanese yen against the US dollar to rebalance the reserve portfolio.[8] As such, sales or purchases of Australian dollars were in effect conducted against the three major world currencies, not just the US dollar. One could therefore argue that the measure of profitability of intervention should take into account not only the exchange rate between the Australian dollar and the US dollar, but also that between the Australian dollar and other currencies in official reserves. Although it is important to note that explicit intervention transactions against the US dollar are quite distinct in the timing of their execution to the subsequent reserve rebalancing transactions.
In the estimates below, we present two profit calculations: one which is based purely on the first leg of intervention – i.e. transactions in the Australian dollar against the US dollar which we refer to as the ‘US dollar Intervention’ method; and one which also takes into account the related rebalancing transactions which we call the ‘Reserve Impact’ method.[9]
5.4.1 US dollar Intervention Method (UIM)
To calculate profits using the UIM, all transactions are treated as having occurred in US dollars against the Australian dollar. While this is the case for the bulk of transactions in the market and with clients, some transactions are conducted against a third currency, and for these the appropriate cross-rate is applied. Similarly, earnings on reserves are all converted into US dollar terms despite having also been earned in euro and yen.
Total profits are simply the sum of realised and unrealised trading profits plus net interest earnings over the period, that arise from changes in the overall foreign currency position as a result of transactions and earnings as described above. Table 2 details the composition of profits over the post-float period as a whole and during the three cycles explained earlier.
| Realised | Unrealised | Interest | Total | |
|---|---|---|---|---|
| Since the float(a) | 3,707 | 510 | 1,634 | 5,851 |
| Cycle 1(b) | 405 | −122 | 354 | 637 |
| Cycle 2(c) | 1,146 | −82 | 1,345 | 2,410 |
| Cycle 3(d) | 1,831 | 182 | 1,087 | 3,101 |
|
Notes: (a) 12 December 1983 to 30 June 2004. The sum of profits in each of the
cycles is not the same as profits over the entire post-float period as each
cycle is treated independently. This requires that the cumulative foreign
exchange position be reset to zero at the beginning of each cycle, irrespective
of the remaining open position that is the result of operations from the
preceding cycle. The average exchange rate of transactions within each cycle is
therefore entirely determined by operations undertaken within that cycle. |
||||
Table 2 shows that the RBA's foreign exchange market transactions have been profitable over the 20 years since the float, with realised profits of $3.7 billion, unrealised profits of $0.5 billion, and additional interest earnings of $1.6 billion. Note also that each cycle has been profitable regardless of whether net interest earnings are taken into consideration. This may be interpreted as intervention having exerted a stabilising influence on the exchange rate.
5.4.2 Reserve Impact Method (RIM)
Under this methodology, a decision to intervene is effectively treated as a decision to intervene in the Australian dollar against all three reserve currencies simultaneously (i.e. US dollar, European euro, and Japanese yen). Daily transactions are split into the three reserve currencies according to their respective portfolio weightings.[10] Apart from this, the methodology is the same as that used in the UIM above.[11]
Table 3 shows the profitability of intervention under the RIM method.
| Realised | Unrealised | Interest | Total | |
|---|---|---|---|---|
| Since the float(a) | 2,515 | 318 | 2,385 | 5,218 |
| Cycle 1(b) | 405 | −122 | 354 | 637 |
| Cycle 2(c) | 680 | 195 | 1,612 | 2,487 |
| Cycle 3(d) | 761 | 96 | 1,776 | 2,634 |
|
Notes: (a) 12 December 1983 to 30 June 2004. Profits over the cycles will not add
to profits since the float. |
||||
On this method, total profits from intervention over the floating period to 30 June 2004 are slightly smaller than on the UIM method, at A$5.2 billion. This comprised A$2.5 billion in realised profits, A$0.3 billion in unrealised profits, and A$2.4 billion in interest earnings. Again, intervention in each of the three cycles in the exchange rate has also been profitable. Taking portfolio rebalancing transactions into consideration when calculating profitability, therefore does not materially impact on the interpretation of the results.
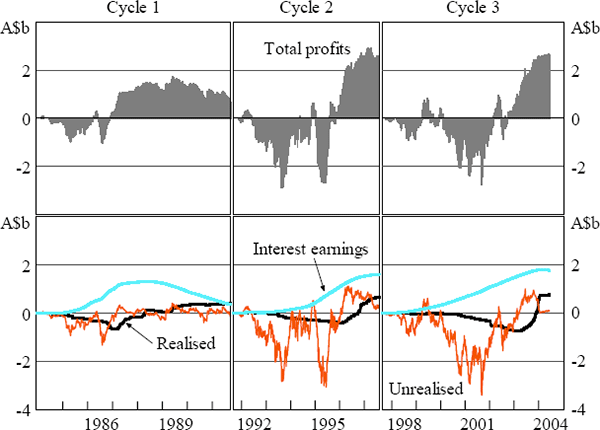
Figure 3 shows the pattern of profits through each of the three cycles, using the RIM. As can be seen, intervention is initially unprofitable as the RBA starts to intervene before the trough in the exchange rate has been reached, consistent with its objective of trying to stabilise the exchange rate. It also indicates that early rounds of intervention do not produce a permanent change in the path of the exchange rate.
Source: RBA
We interpret the overall findings from this study as evidence that intervention over the post-float period has, on balance, worked to stabilise the exchange rate. The results are also in line with similar studies in other major countries. Other methods used to assess the effectiveness of foreign exchange intervention have relied on event studies and even surveys of foreign exchange dealers. Appendix A provides a literature survey of the main findings of these studies.
Footnotes
These three components of profitability were also identified in Andrew and Broadbent (1994), who found that over the period between 1983 and 1994, the RBA's foreign exchange operations had been profitable and were thus judged to have exerted a stabilising influence on the exchange rate. [5]
Realised trading profits are calculated on the basis of economic gain in these examples. For financial reporting purposes the RBA accumulates foreign exchange on the basis of ‘average stock cost’ and accounts for gains and losses only when it sells this foreign exchange out of stock. There are two main differences between the concepts. Firstly, because for the purpose of this paper we are only concerned with events over the post-float period, gains arising from the average stock cost of foreign exchange reserves that had been acquired prior to the float of the Australian dollar are ignored. Secondly, the economic gain method used in the example implies that gains over the most recent episode have already been realised, whereas for financial reporting purposes they will not be realised until the RBA sells the foreign exchange acquired when replenishing reserves. [6]
For a more in-depth discussion of the rationale behind including net interest earnings in the calculation of profits, see Andrew and Broadbent (1994). [7]
Prior to the formal adoption of a diversified portfolio, the RBA held its foreign exchange reserves mainly in US dollars. While there were always assets denominated in other currencies, there was no systematic rebalancing. In the middle of 1991 the policy of managing reserves changed to formally hold 40 per cent of reserves in US dollars and 30 per cent each in Deutschemark (later euro) and Japanese yen. Rebalancing transactions took place from time to time to approximate these weights. However, active management of reserves meant that there were prolonged periods during which the actual portfolio composition departed from the prescribed weightings. In early 2000 the RBA adopted a more passive management policy where rebalancing transactions were conducted on a daily basis with a tolerance for a 1 per cent deviation from the allocation. A further change occurred in early 2002 when the RBA modified the benchmark weights to 45 per cent US dollars, 45 per cent euro, and 10 per cent yen. [8]
Andrew and Broadbent (1994) presented profit estimates based only on the ‘US dollar Intervention’ method as for most of the period they covered in their study, reserves were held primarily in US dollars. [9]
Transactions with clients in the Australian dollar that are not directly dealt against the US dollar are initially converted into US dollar terms at the appropriate exchange rate before the portfolio weightings are applied. Once the daily sum of transactions is split into three parts, each part is then converted into reserve currency terms using the daily 4pm AEST exchange rate. [10]
Realised profits are calculated from any trade that acts in the direction of closing out the RBA's position in any one of the three foreign currencies. Unrealised profits are calculated from the RBA's open position, using the average exchange rate of obtaining each position and the currently prevailing exchange rate of the Australian dollar against the US dollar, euro, and yen. Interest earned or foregone by the RBA as a result of shifting between domestic and foreign assets reflects the differential between domestic and overseas interest rates. The net interest earnings for the US portfolio are calculated on the interest differential between Australian 13-week Treasury notes and the 3-month US Treasury bill. Net interest earnings for Japan (Europe) are calculated by applying the interest differential against the Japanese 3-month government bill (3-month Euribor) to the RBA's net open yen (euro/Deutschemark) position. [11]