RDP 2004-03: Fear of Sudden Stops: Lessons from Australia and Chile 2. Similar Shocks, Different Responses: Australia versus Chile 1997–1999
May 2004
- Download the Paper 194KB
In this section we characterise the different performance of Australia and Chile during the Asian-Russian crisis. Although these economies faced similar external real shocks, Australia continued to grow strongly while Chile suffered a severe slowdown. The main factor behind the different responses is the behaviour of capital flows. We characterise the nature of these flows, the key role played by the respective banking systems and derivatives markets. We also dismiss a few traditional fear-of-floating explanations. In concluding the section we highlight the key differences between these two economies in terms of country-trust and currency-trust.
2.1 The Asian-Russian Crisis in Chile and Australia
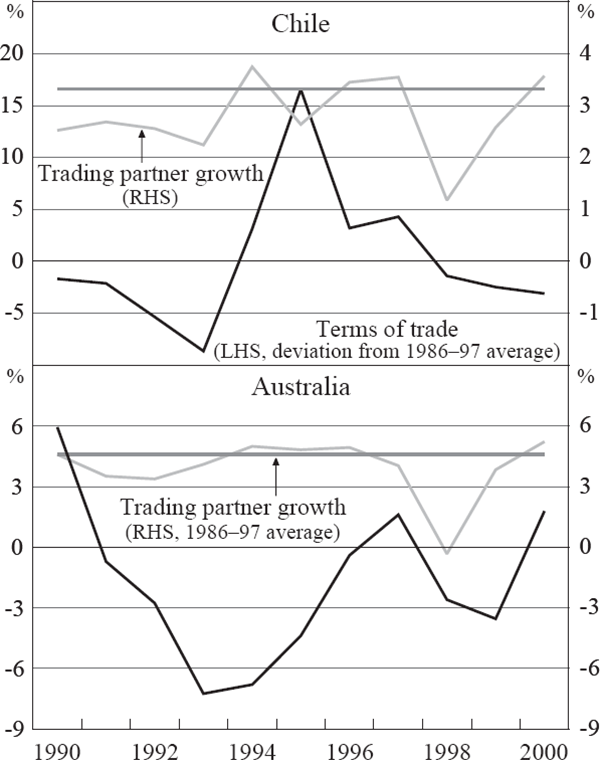
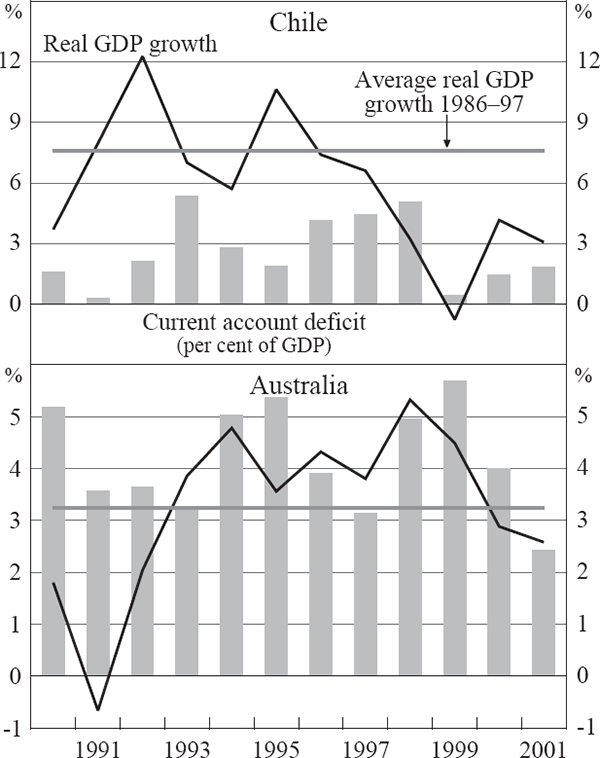
Chile experienced a substantial slowdown following the 1998 deterioration in its terms of trade and external demand (as measured by trading partner GDP growth) shown in Figure 1. The current account deficit narrowed to 0.5 per cent of GDP in 1999, down from an average of 3 per cent over the previous decade and a peak above 5 per cent before the slowdown (Figure 2). Annual growth fell a full 8 percentage points below the average of the previous decade, to −1 per cent, by 1999. Despite facing similar external shocks, higher foreign borrowing by Australia financed the temporary drop in income. The current account deficit doubled from around 3 per cent of GDP at the beginning of 1997, and growth was actually higher than average in both 1998 and 1999.
Sources: ABS; authors' construction based on data from the World Bank World Development Indicators and IMF International Financial Statistics
Sources: ABS; IMF International Financial Statistics
Following the negative external shock, the Central Bank of Chile (CBCh) set out to minimise the nominal devaluation and rein in the current account deficit by implementing contractionary monetary policy. Interest rates on loans rose substantially in 1998 – the top panel in Figure 3 shows the jump from pre-shock levels of 8 per cent to over 18 per cent and an average of 11 per cent for 1998. At the same time, the CBCh intervened in the foreign exchange market – selling close to US$3 billion in reserves between 1997 and 1999. This reluctance to let the exchange rate play the stabilising role suggested by traditional open-economy models is fairly common among economies that exhibit ‘fear-of-floating’ (Haussman, Panizza and Stein 2001; Calvo and Reinhart 2002).
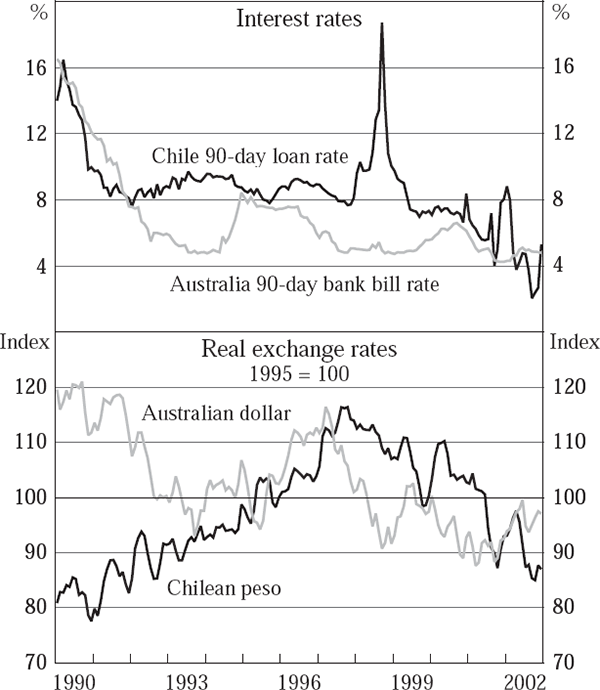
Note: Loan rate for Chile = tasa colocacion promedio sistema financiero a 90 dias en UF
Sources: CBCh; IMF International Financial Statistics; RBA
The reaction of the Reserve Bank of Australia (RBA) was essentially the opposite of that of the CBCh. After interest rates were cut twice in mid 1997 they were then held constant until the end of 1998 when they were cut once more (the target cash rate – the RBA's policy instrument – averaged 5.4 per cent in 1997, 5.0 per cent in 1998 and 4.8 per cent in 1999). In addition, the RBA did not attempt to counteract the substantial depreciation of the Australian dollar.[1] By mid 1998 the nominal effective exchange rate had depreciated by 15 per cent from its level at the beginning of 1997. In contrast, by mid 1998 the effective Chilean peso exchange rate was back at the early 1997 level, having appreciated slightly through 1997.[2] The bottom panel of Figure 3 shows that in real terms the contrast is even more extreme – a 15 per cent depreciation for the Australian dollar versus a 5 per cent appreciation for the peso.
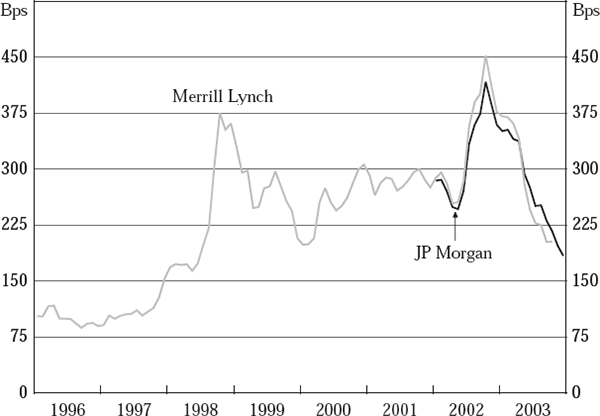
There is no question that the stark difference in the reactions of the respective monetary authorities played a role in the relative performances of these two economies. However, stopping there does not recognise that these responses were the result of substantially different pressures. While Australia had little concern for a sudden stop, Chilean authorities were extremely worried by that possibility. In fact, the sudden stop had already started in Chile at the time of the monetary contraction, and fears of a catastrophe in emerging markets could be felt from Washington to Santiago.[3] The change in external financing conditions faced by Chile in late 1997 and 1998 is evident in Figure 4, which shows the spread between the returns on Chilean corporate bonds and the rates on US treasury bills. The spread on Chilean bonds rose by more than half in 1997 and then doubled in 1998. Moreover, the price of Chilean debt in secondary markets is likely to understate the constraints faced by Chile following the Asian and Russian crisis, as primary markets were effectively closed during this period.
2.2 The Role of Capital Flows
In the latter part of the Asian-Russian crisis and its immediate aftermath, the period 1998–1999, net capital flows behaved very differently in these two countries. For Australia, net inflows in US dollar terms were higher than their 1990–1997 average, as seen in Figure 5.[4] For Chile, net inflows were lower by around 5 per cent of GDP in 1998, and remained below average for the rest of our sample.
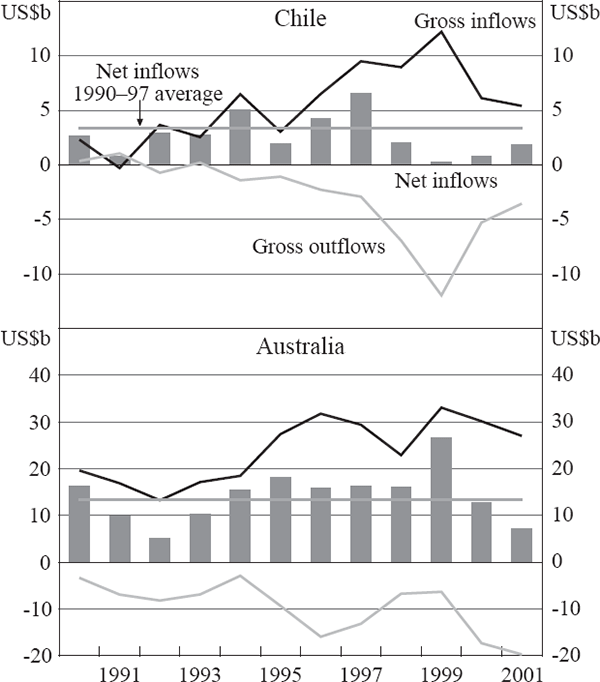
Source: IMF Balance of Payment Statistics
It is the behaviour of net capital flows that is ultimately important from a macroeconomic perspective. However, it is useful to analyse gross inflows and outflows to shed light on the factors behind the Chilean net capital flow reversal. Following the Asian-Russian crisis, gross capital inflows into both Chile and Australia increased. As seen in Table 1, in Chile most of the rise in inflows in 1998–1999 relative to the previous three years came in the form of foreign direct investment (FDI). In Australia, on the other hand, there was a large rise in the other investment category of the capital account, which is mostly foreign loans. An important part of this is rising bank debt, although the non-financial sector also borrowed directly from abroad. This highlights that the similarity in the behaviour of gross capital inflows to Australia and Chile is misleading: it is likely that Chile had to sell heavily discounted assets to obtain funding, while Australia could borrow at non-fire-sale international rates.
| Chile | Australia | ||||||
|---|---|---|---|---|---|---|---|
| 1994–1997 | 1998–1999 | 2000–2001 | 1994–1997 | 1998–1999 | 2000–2001 | ||
| By type of inflow: | |||||||
| FDI | 3.9 | 6.9 | 4.1 | 7.7 | 5.9 | 8.3 | |
| Portfolio equity | 0.9 | 0.6 | −0.3 | 5.4 | 8.4 | 4.6 | |
| Portfolio debt | 0.4 | 1.2 | 1.0 | 11.3 | 3.7 | 12.2 | |
| Other investment | 1.1 | 2.0 | 1.0 | 2.3 | 10.0 | 3.4 | |
| By type of agent: | |||||||
| Government debt | −0.8 | 0.0 | 0.2 | 3.2 | −3.4 | −2.2 | |
| Bank equity | 0.1 | 0.1 | 0.0 | 0.4 | 1.4 | 1.3 | |
| Other equity | 0.5 | 0.5 | −0.3 | 5.0 | 6.9 | 3.3 | |
| Bank debt | −0.4 | −0.3 | 0.1 | 11.2 | 13.7 | 11.6 | |
| Other debt | 3.2 | 3.4 | 1.7 | −0.8 | 3.4 | 6.2 | |
| FDI | 3.5 | 6.4 | 4.1 | 7.7 | 5.9 | 8.3 | |
|
Source: IMF Balance of Payment Statistics |
|||||||
The second and more significant difference between the two economies is the behaviour of gross outflows. While outflows from Australia shrank in 1998–1999, in Chile there was a rise in outflows in both of these years. Following the terms of trade shock, Chilean residents shifted their portfolios towards foreign assets. The outflows were particularly large in 1999, amounting to over 15 per cent of GDP.
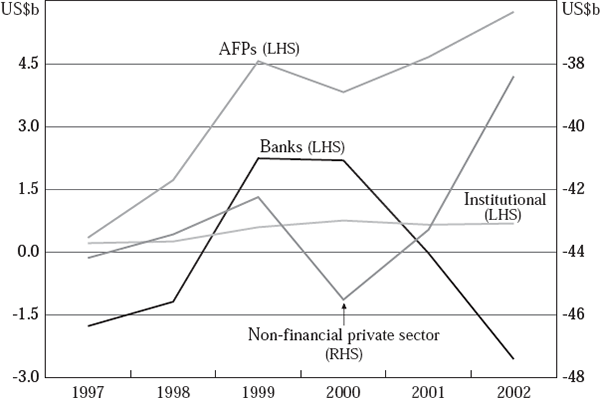
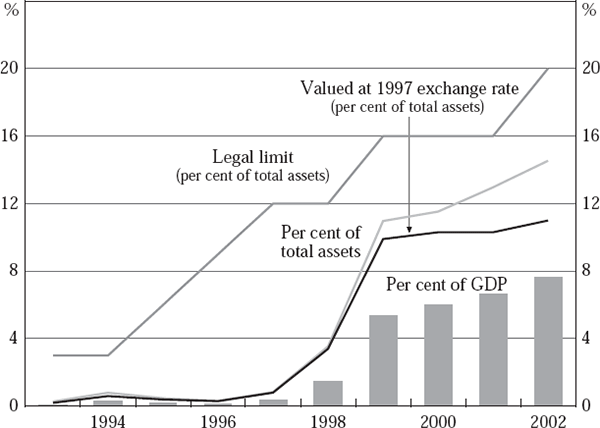
A substantial part of the net capital outflow from Chile in this period can be explained by the behaviour of two groups of institutional investors: pension fund management companies (AFPs) and banks (especially foreign resident banks). This can be seen in Figure 6, which plots the net international investment position of the Chilean private sector. AFPs are a significant part of the Chilean capital market. In 1999 they controlled assets worth close to 50 per cent of GDP at a time when equity market capitalisation was 100 per cent of GDP and private bank credit around 60 per cent of GDP. Pension funds increased the share of foreign assets in their portfolio substantially over the period 1998–1999. Starting from levels close to 1 per cent in 1997, Figure 7 shows the share of foreign assets in AFP portfolios rose to above 10 per cent in 1999 – an increase equivalent to 5 per cent of GDP.[5] The rising share of foreign assets coincides with widening legal limits on foreign asset holdings. This makes it difficult to determine whether the higher share of foreign assets is the result of changes in the optimal portfolio or the lifting of regulatory constraints. However, the increase in the share of foreign assets was larger than the regulatory change. This suggests that unfortunate timing on behalf of the pension regulators is at most a partial explanation for Chile's capital outflows.
Source: CBCh
Sources: CBCh; Superintendencia de AFP
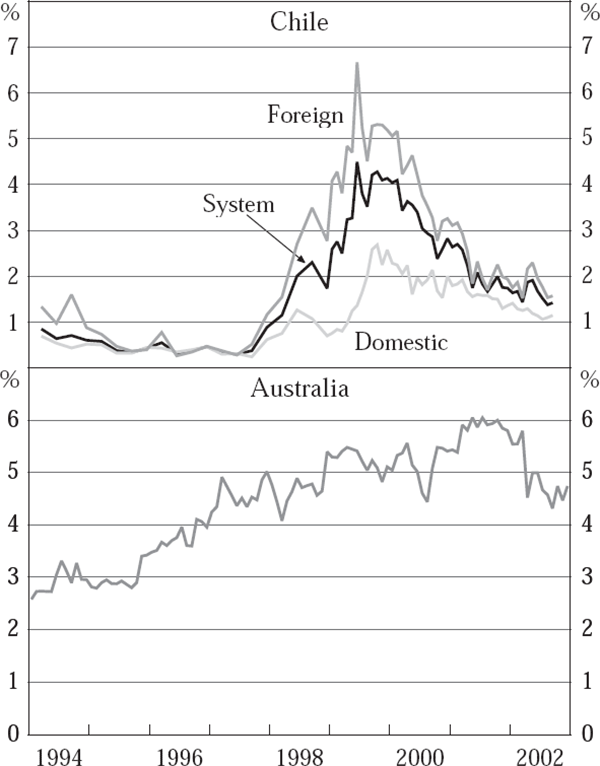
Rather than smoothing the loss of international liquidity from the terms of trade shocks, Chilean banks exacerbated it by joining in the capital flow reversal. Figure 8 plots the evolution of gross foreign assets as a share of total assets for domestic and foreign-owned banks. While all banks increased their positions in foreign assets, the shift in foreign-owned banks' portfolio was more pronounced, rising to over 6 per cent in 1999.[6] However, this was not a permanent shift. By the end of 2002 the share of gross foreign assets in banks' portfolios was close to its initial level. In contrast, in Australia over the same period there was no jump in banks' foreign assets as a proportion of total assets. Rather, there was a continuation of the upward trend that began in the early 1990s.
Sources: RBA; Superintendencia Bancos e Instituciones Financieras Chile
2.3 Exchange Rate Defence
Some observers have focused on the exchange rate defence aspect of the contractionary monetary policy of the CBCh. It was not until September 1999 that Chile abandoned its exchange rate band (which had been narrowed since the initial shock) and allowed the peso to float freely against the US dollar. As we discussed in Section 2.2, this was not the case for Australia, which did not base its policy on a defence of the currency. Why would policy-makers in Chile be more concerned than Australia about a depreciation?
2.3.1 Unlikely (conventional) explanations
The first conventional explanation has been the fear of high inflation pass-through. There were concerns that a nominal devaluation would lead to a jump in prices, so at best a brief real depreciation, and in the case of a highly indexed economy like Chile, to a period of prolonged inflation. Figure 3 suggests that, ex-post, this was not the case. The real exchange rate did depreciate substantially and inflation did not pick up. In fact, inflation in 1997 was above 6 per cent while average inflation during the period 1998–2002 was only 3.7 per cent. Furthermore, empirical estimates for Chile and Australia suggest a similar degree of pass-through. For Chile, Garcia and Restrepo (2001) find that pass-through is approximately 0.3 after 8 quarters, and even lower if there is a positive output gap (as happens with a negative terms of trade shock).[7] Long-run pass-through in Australia is estimated to be around 0.3, and close to 0.2 after 8 quarters (Dwyer and Leong 2001), not substantially lower than in Chile.
The second concern was that, because of the private sector's unhedged dollarised liabilities, a devaluation could have a negative impact through balance sheet effects. The perception was that inflated liabilities would activate collateral constraints leading to reductions in output and investment. If firms or the government are exposed to significant currency mismatches, then the expansionary Mundell-Flemming effects of a real devaluation will be offset by the negative balance sheet effects of dollar debt.[8] In addition, if foreign debt is denominated in a foreign currency, then a real devaluation will increase the local-currency value of required factor payments, aggravating any existing liquidity shocks. However, existing data suggest that unlike some neighbouring Latin American economies, currency mismatches (at least in the conventional sense) were not a severe problem in Chile. This does not imply that Chile would not benefit from a further reduction of its ‘original sin’.
We start by looking at currency mismatches at the aggregate level. Table 2 shows that Chile's net and gross liabilities, as a proportion of GDP, were significantly lower than Australia's in 1997. The structure of these liabilities also differs. Chile had more FDI, both as a share of GDP and as a share of total liabilities. Outstanding debt, on the other hand, made up a smaller share of Chilean net and gross foreign liabilities. Table 2 also shows that banks play a larger role in intermediating capital inflows in Australia than they do in Chile. In Australia, gross foreign liabilities in the banking sector were over 24 per cent of GDP, while in Chile banks' foreign liabilities were less than 4 per cent of GDP. Firms in Chile wishing to access international capital must do so directly – either through FDI or by issuing debt or shares – not through the banking sector. More generally, BIS data suggest that in all of Latin America, direct borrowing by non-bank sectors from foreign banks is a larger source of financing than bank-to-bank lending. We return to this issue later and explore possible explanations and implications.
| Chile | Australia | ||||||
|---|---|---|---|---|---|---|---|
| Gross assets | Gross liabilities | Net liabilities | Gross assets | Gross liabilities | Net liabilities | ||
| Private sector: | |||||||
| Banks | |||||||
| Debt | 1.4 | 3.0 | 1.6 | 4.8 | 22.3 | 17.6 | |
| Portfolio equity | 0.0 | 0.6 | 0.6 | 0.1 | 2.5 | 2.4 | |
| Non-financial private sector | |||||||
| Debt | 11.6 | 21.6 | 10.0 | 4.6 | 18.9 | 14.3 | |
| Portfolio equity | 1.1 | 8.0 | 6.9 | 7.7 | 12.6 | 4.9 | |
| FDI | 6.2 | 41.7 | 35.5 | 16.5 | 28.9 | 12.4 | |
| Private sector | |||||||
| Debt | 13.1 | 24.6 | 11.6 | 9.4 | 41.2 | 31.8 | |
| Portfolio equity | 1.1 | 8.6 | 7.5 | 7.8 | 15.1 | 7.3 | |
| FDI | 6.2 | 41.7 | 35.5 | 16.5 | 28.9 | 12.4 | |
| Total | 20.3 | 74.9 | 54.6 | 33.7 | 85.3 | 51.5 | |
| Government | |||||||
| General government | 0.6 | 5.8 | 5.2 | 0.3 | 8.8 | 8.5 | |
| Central bank | 22.1 | 0.2 | −21.9 | 4.3 | 0.0 | −4.3 | |
| Total | 22.7 | 6.0 | −16.7 | 4.6 | 8.8 | 4.2 | |
| Total | 43.0 | 80.9 | 37.9 | 38.4 | 94.1 | 55.7 | |
| Memo items: | |||||||
| Chile | Australia | ||||||
| Share of private sector offshore bonds in local currency: | 100 | 76 | |||||
| Share of public sector offshore bonds in local currency: | 100 | 63 | |||||
| Share of foreign-currency deposits in total deposits: | 3.5 | – | |||||
|
Notes: Debt = portfolio debt + loans + commercial loans + currency and deposits.
General government corresponds to central government plus other public sector.
Sources: CBCh; IMF Balance of Payment Statistics and International
Financial Statistics. Bond currency |
|||||||
However, statistics on total foreign debt do not completely summarise currency mismatch. They ignore both the currency composition of debt and the response of income to exchange rate fluctuations. With this in mind, in Table 3 we build an aggregate measure of currency mismatch for Chile, Australia, and for a sample of other Latin American and small open developed economies. Cross-country data on the currency composition of total external debt are not available, so it is not possible to construct exact measures of total foreign-currency external debt. Instead, we use the measure of ‘original sin’ from Eichengreen, Hausmann and Panizza (2003) as a proxy for the share of foreign debt denominated in foreign currency. To take into consideration differences across countries in openness and the size of the tradable sector – and hence the effect of real exchange rate on income – our measure of mismatch is the ratio between our estimates of foreign-currency external debt and total exports. The ratio of foreign-currency debt over exports is lower in Chile than in any other country in our sample, and less than half the average of other Latin American economies. Other measures of mismatch reported in Table 3 – such as net debt liabilities, and net debt liabilities including international reserves as a fraction of exports and of GDP – all suggest that Chile's aggregate currency mismatch was relatively low on the eve of the Asian-Russian crisis.[9]
| Total foreign debt D* | Total foreign debt in foreign currency D*US$ | Net foreign debt in foreign currency D*US$–A* | Net foreign debt in foreign currency minus reserves D*US$–A*–R* | |
|---|---|---|---|---|
| As a per cent of GDP | ||||
| Chile | 27 | 27 | 13 | −9 |
| Australia | 47 | 34 | 23 | 19 |
| NZ | 60 | 57 | 47 | 40 |
| Canada | 70 | 57 | 30 | 27 |
| Israel | 53 | 53 | 35 | 15 |
| LAC | 70 | 70 | 23 | 8 |
| As a per cent of exports | ||||
| Chile | 125 | 125 | 61 | −41 |
| Australia | 291 | 209 | 142 | 116 |
| NZ | 280 | 266 | 218 | 187 |
| Canada | 206 | 168 | 87 | 79 |
| Israel | 238 | 238 | 157 | 68 |
| LAC | 299 | 295 | 140 | 57 |
|
Notes: D* (total foreign debt) = debt securities liabilities + other investment liabilities. D*US$ (foreign debt in foreign currency) = D* adjusted by the share of external debt in foreign currency from Eichengreen et al (2003). D*US$–A* (net foreign debt in foreign currency) = D*US$ minus foreign assets, where assets are defined as the sum of debt securities assets and other investment assets. D*US$–A*–R* (net foreign debt in foreign currency minus reserves) = D*US$–A* minus reserves. The data of liabilities and assets were extracted from IFS International Investment Position. LAC (Latin American countries) includes: Argentina, Colombia, Costa Rica, Panama, Peru, Uruguay and Venezuela. Sources: BIS; IMF International Financial Statistics; World Bank World Development Indicators |
||||
It is not only aggregate currency exposure that is important. The distribution of dollar-denominated contracts within the economy is also likely to determine the effects of a devaluation on output, and so the optimal monetary policy response to a terms of trade shock. Existing evidence suggests that currency mismatches were not a severe problem within the Chilean economy. According to a recent report by the Chilean Finance Ministry, gross central government debt denominated in US dollars was 13.5 per cent of GDP in 1996.[10] The net exposure of the central government balance sheet to a devaluation was even lower since the Chilean government held foreign-currency denominated assets worth 5.5 per cent of GDP.
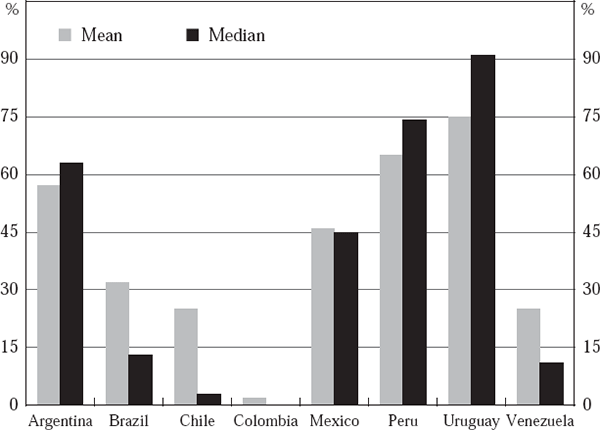
Data from publicly listed firms suggest that liability dollarisation within the Chilean private sector was not a severe problem either. Figure 9 reports average levels of liability dollarisation for a sample of firms from eight Latin American economies. Both the average and median shares of US dollar debt in total debt for Chilean firms were among the lowest in the region. Whereas the median share of foreign-currency debt in total debt of a publicly listed firm in Chile was less that 5 per cent, the median shares in Argentina, Peru and Uruguay were all above 60 per cent. Table 4 suggests that, in addition to being relatively low (compared to neighbouring economies), dollar-denominated liabilities in Chile were concentrated among firms in the tradable sector. This was not the case in Argentina.
Note: Refers to share of total debt denominated in foreign currency; sample coverage varies by country.
Source: Authors' calculations based on data from Cowan and Kamil (2004)
| Sector (ISIC) | Tradable, non-tradable | Dollar debt/total debt | ||||
|---|---|---|---|---|---|---|
| Chile | Argentina | |||||
| Mean | Median | Mean | Median | |||
| Agriculture | T | 0.32 | 0.21 | 0.65 | 0.82 | |
| Mining | T | 0.34 | 0.09 | 0.73 | 0.85 | |
| Manufacturing | T | 0.37 | 0.31 | 0.53 | 0.62 | |
| Electricity, gas and water | NT | 0.21 | 0.00 | 0.63 | 0.74 | |
| Construction | NT | 0.00 | 0.00 | 0.51 | 0.55 | |
| Trade | NT | 0.22 | 0.17 | 0.49 | 0.61 | |
| Transport, storage and communications | NT | 0.32 | 0.13 | 0.54 | 0.62 | |
| Financing, insurance, real estate and business services | NT | 0.15 | 0.00 | 0.81 | 0.76 | |
| Community, social and personal services | NT | 0.00 | 0.00 | 0.37 | 0.33 | |
| Tradable | 0.40 | 0.38 | 0.56 | 0.63 | ||
| Non-tradable | 0.15 | 0.00 | 0.58 | 0.63 | ||
| Total | 0.24 | 0.02 | 0.57 | 0.63 | ||
|
Notes: For both Chile and Argentina tradable firms are those in Agricultural, Mining and Manufacturing sectors. For Chile the sample is 237 publicly listed firms. For Argentina the data set includes 202 non-financial firms (publicly traded companies, publicly held but not publicly traded companies and privatised companies). Source: Authors' calculations based on data from Cowan and Kamil (2004) |
||||||
To look in more detail at the extent to which firms were ‘matching’ the currency compositions of their debt and income we use firm-level data to estimate the determinants of liability dollarisation in Chile. Table 5 reports the results of estimating Equation (1) on a sample of accounting data from 270 publicly listed firms for December 1997:

| Dependent variable – dollar liabilities/total liabilities | |||
|---|---|---|---|
| (1) | (2) | (3) | |
| Tradable sector dummy | 0.134*** (0.043) |
0.117** (0.046) |
0.072 (0.048) |
| Export dummy | 0.134*** (0.051) |
||
| Exports/sales | 0.290** (0.120) |
||
| Size (ln[assets]) | 0.053*** (0.008) |
0.057*** (0.009) |
0.047*** (0.083) |
| Observations | 232 | 232 | 232 |
| R2 | 0.22 | 0.29 | 0.25 |
|
Notes: Robust standard errors reported in parentheses. Sample includes publicly listed firms only. ***, ** and * indicate significance at 1, 5 and 10 per cent levels respectively. Source: Authors' calculations based on data from Cowan and Kamil (2004) |
|||
where for firm i,  is the ratio of dollar-denominated debt
to total liabilities, tradable is a dummy for firms operating in the agricultural,
mining or manufacturing sectors, x/s is the ratio of exports to total sales,
firm size is measured as ln(total assets) and z is a matrix
of additional firm controls detailed in the table. The estimated coefficients confirm that
dollar debt is 7 per cent higher in the tradable sector and 13 per cent higher in exporting
firms. The share of dollar debt is also higher for larger, and so presumably less
credit-constrained, firms.[11]
These results imply there is a ‘matching’ of the currency compositions of firm
income and liabilities so that the negative balance sheet effects of a devaluation will be
partly offset by rising peso income.[12]
Indeed, a recent study by Benavente, Johnson and Morande (2003) for Chilean firms over the
period 1990–2000 finds that publicly listed firms holding dollar debt do not invest
significantly less than their ‘peso-indebted’ counterparts following a devaluation.
is the ratio of dollar-denominated debt
to total liabilities, tradable is a dummy for firms operating in the agricultural,
mining or manufacturing sectors, x/s is the ratio of exports to total sales,
firm size is measured as ln(total assets) and z is a matrix
of additional firm controls detailed in the table. The estimated coefficients confirm that
dollar debt is 7 per cent higher in the tradable sector and 13 per cent higher in exporting
firms. The share of dollar debt is also higher for larger, and so presumably less
credit-constrained, firms.[11]
These results imply there is a ‘matching’ of the currency compositions of firm
income and liabilities so that the negative balance sheet effects of a devaluation will be
partly offset by rising peso income.[12]
Indeed, a recent study by Benavente, Johnson and Morande (2003) for Chilean firms over the
period 1990–2000 finds that publicly listed firms holding dollar debt do not invest
significantly less than their ‘peso-indebted’ counterparts following a devaluation.
We also use firm-level data from Bloomberg to compare the dollarisation of liabilities in Chile and Australia. Since direct data on liability dollarisation are not available for both economies, using firms' income statements we derive a measure of currency mismatch from the exchange rate losses as:
where  is
dollar debt,
is
dollar debt,  is dollar denominated assets, ait
is total assets, all in local currency, and Δet is the nominal
depreciation. This allows us to construct mit, a measure of currency
mismatch, using firm-level data on
is dollar denominated assets, ait
is total assets, all in local currency, and Δet is the nominal
depreciation. This allows us to construct mit, a measure of currency
mismatch, using firm-level data on  and aggregate data on
depreciations. As seen in Table 6 we find similar average values of mit for
listed firms in Australia and Chile. Note that this measure does not take account of off-balance
sheet hedging of foreign-currency liabilities. We would expect such
hedging to be of greater significance in Australia because of the larger currency derivative
markets and the substantial aggregate asset position in foreign-currency derivative contracts
outlined in Section
2.3.2. However, what is evident in the raw data is that in both countries, currency
mismatch, as measured by mit, is higher for firms in the tradable sector.
This suggests that firms in Australia also match the currency income of their net foreign
liabilities to that of their income stream.
and aggregate data on
depreciations. As seen in Table 6 we find similar average values of mit for
listed firms in Australia and Chile. Note that this measure does not take account of off-balance
sheet hedging of foreign-currency liabilities. We would expect such
hedging to be of greater significance in Australia because of the larger currency derivative
markets and the substantial aggregate asset position in foreign-currency derivative contracts
outlined in Section
2.3.2. However, what is evident in the raw data is that in both countries, currency
mismatch, as measured by mit, is higher for firms in the tradable sector.
This suggests that firms in Australia also match the currency income of their net foreign
liabilities to that of their income stream.
| Derived mismatch mit – per cent | |||||
|---|---|---|---|---|---|
| Australia | Chile | ||||
| Mean | Median | Mean | Median | ||
| Non-tradable | −1.19 | 0.00 | 0.33 | 0.13 | |
| Tradable | 5.50 | 0.00 | 4.85 | 2.31 | |
| Total | 2.38 | 0.00 | 3.00 | 1.13 | |
|
Note: Derived mismatch is foreign-currency liabilities net of foreign-currency assets as a ratio of total assets. Source: Authors' calculations based on Bloomberg data |
|||||
In conclusion, neither pass-through nor dollarisation of liabilities are strong reasons to support the view that the main concern of the CBCh was, or should have been, the stabilisation of the exchange rate per se.
2.3.2 A role for the exchange rate: banks and derivatives
In Chile there was one clear reason to defend the exchange rate that did not exist in Australia: banks have limited ability to hedge currency risk.
As we discussed in the preceding section, Australian banks have played an important role in intermediating capital inflows. Importantly, exchange rate risk is not passed on to the domestic borrowers – as has often been the case in emerging markets – nor is it taken on by banks themselves. Rather, banks hedge their net foreign-currency liabilities using derivatives. This is an important point: as discussed in Section 4.2.3, Australia has a highly developed currency derivative market which allows exchange rate risk to be separated from loan decisions (credit risk). Small firms, likely to be more dependent on bank credit and more vulnerable to currency mismatches, can therefore access international capital markets through loans in Australian dollars from the banking sector.
The contrast with Chile, in which banks did not intermediate foreign capital either before or during the crisis, is stark. Furthermore, following the external shocks in 1997, Chilean banks contributed to capital outflows by increasing their holdings of foreign assets. Chilean banks did not have the means to unload the (explicit or implicit) exchange rate risk. So it is conceivable that exchange rate uncertainty was partly responsible for their role in capital outflows. Moreover, this was exacerbated by foreign resident banks whose measures of performance may be more directly linked to foreign currency. It is also conceivable that the CBCh was concerned with this potential link.
The difference in the development of the derivatives markets in Australia and Chile is highlighted in the survey conducted by the Bank for International Settlements (BIS 2002), summarised in Table 7. Total derivative turnover relative to GDP, a measure of derivative market coverage and liquidity, is more than one order of magnitude larger in Australia than it is in Chile. Derivative turnover with non-financial agents, which is probably a better measure of firms' use of derivatives to cover exchange rate positions, is also substantially higher in Australia. The same BIS survey also shows that more Australian dollar trading takes place off-shore, which is suggestive of larger net holdings by foreigners.[13]
| Chile | Australia | Latin America | Emerging, excluding Latin America | Developed, excluding Australia | Chile (1998) | |
|---|---|---|---|---|---|---|
| Derivative turnover as a per cent of: | ||||||
| Spot currency turnover | 0.4 | 3.1 | 0.5 | 1.2 | 2.5 | 0.6 |
| Trade flows | 4.4 | 78.1 | 2.1 | 6.7 | 32.3 | 3.2 |
| Trade + capital flows | 3.3 | 58.2 | 1.7 | 10.0 | 23.3 | 2.5 |
| GDP | 2.2 | 25.1 | 0.7 | 5.4 | 27.4 | 1.5 |
| Derivative turnover with non-financial agents as a per cent of GDP | 0.4 | 1.6 | 0.1 | 0.3 | 1.8 | 0.1 |
|
Notes: Trade flows are the sum of exports and imports; capital flows are the sum of gross capital inflows and gross outflows. Total turnover corresponds to total transactions of currency derivatives contracts in the foreign exchange and over-the-counter (OTC) markets with domestic and foreign agents, net of double accounting. Derivative turnover with domestic non-financial counterparties excludes turnover between reporting agents, between reporting agents and other financial institutions, and between agents and non-financial counterparties abroad. Emerging economies are those in the lower and middle income groups from the World Bank World Development Indicators in 2002. Sources: Authors' calculations based on BIS (2002); IMF International Financial Statistics; World Bank World Development Indicators |
||||||
Table 7 also compares Australian and Chilean currency derivatives markets to a broader sample of countries from the BIS survey. These data suggest that the derivatives market in Australia is large even by developed economy standards. Relative to GDP, trade, and capital flows, total turnover in Chile is higher than in the other Latin American economies included in the survey, but lower than other emerging markets (this is also true using data for 1998, the survey closest to the Asian-Russian crisis). However, compared to other emerging markets, Chile does have fairly large derivative turnover with non-financial agents.
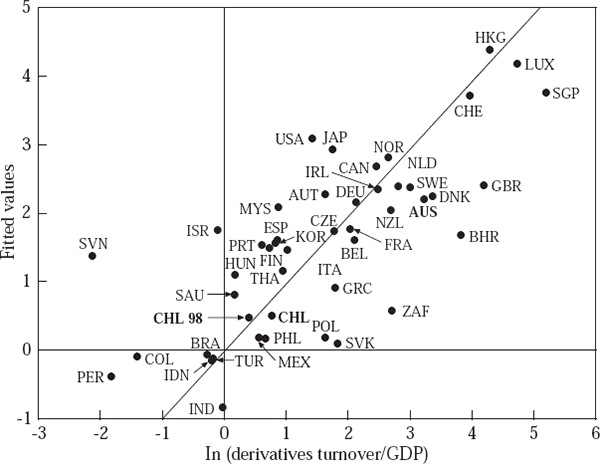
To assess whether Chile has an underdeveloped derivatives market, we run a very simple cross-country regression relating derivative turnover from the BIS survey to variables that capture the degree of financial development, openness and overall level of development. Specifically we estimate:

on the sample of countries included in the 2001 BIS survey. In this specification Fx is currency derivative turnover in 2001 scaled by nominal GDP, y is per capita income on a PPP basis for the period 1996–2000, trade is the ratio of exports + imports to GDP and fdev is the ratio of private bank lending to nominal GDP (a measure of financial development). Figure 10 plots the fitted values of turnover from this regression against observed turnover. The estimated coefficients are reported in Table 8. As expected, turnover is positively correlated with openness, income per capita and financial development. The estimated coefficient on the emu dummy, which indicates countries that have adopted the Euro, is negative as expected, although not significant at conventional confidence intervals. Other measures of exchange rate volatility and importance of commodities in exports we tried were all insignificant. Interestingly, turnover in Chile is not significantly below the predicted value. Derivative turnover in Australia is larger than predicted. It is interesting that South Africa and Poland, outliers in this regression, are also outliers in the Eichengreen et al (2003) measure of original sin.
| Specification | Dependent variable ln(derivatives turnover/GDP) | ||||||
|---|---|---|---|---|---|---|---|
| 1 | 2 | 3 | 4 | 5 | 6 | 7 | |
| Income per capita (PPP) 1995–2000 | 0.095*** (0.025) |
0.108*** (0.028) |
0.132*** (0.022) |
0.154*** (0.026) |
0.127*** (0.021) |
0.127*** (0.022) |
0.125*** (0.022) |
| (Exports + Imports)/GDP | 0.713** (0.349) |
0.713** (0.349) |
0.844** (0.355) |
0.382 (0.587) |
0.960*** (0.344) |
1.102*** (0.357) |
1.054*** (0.354) |
| Private lending/GDP | 1.015* (0.604) |
0.912 (0.614) |
|||||
| Dummy EMU membership | −0.461 (0.501) |
||||||
| Gross capital flows/GDP | 0.107 (0.441) |
||||||
| Commodities share of exports | −0.011 (0.012) |
||||||
| Dummy for commodity currency | 0.410 (0.747) |
||||||
| Years with floating exchange rate (1995–2000) | 0.074 (0.078) |
||||||
| Dummy for floating exchange rate in 2000 | 0.212 (0.385) |
||||||
| R2 | 0.549 | 0.558 | 0.54 | 0.782 | 0.526 | 0.54 | 0.533 |
| Observations: | 46 | 46 | 46 | 15 | 47 | 46 | 46 |
|
Sources: Authors' calculations based on data from BIS (2002); Cashin et al (2001); IMF International Financial Statistics; Levy-Yeyati et al (2003); World Bank World Development Indicators |
|||||||
These results – while tentative in that they do not account for endogeneity of the right-hand-side variables – suggest that the size of the Chilean derivatives market is broadly consistent with its overall level of development, openness and financial development. Therefore, one should not expect that a very rapid growth of Chile's currency derivatives market will take place, absent a deliberate set of policies aimed at boosting these markets.
We turn now to understanding how the Australian private sector uses the derivatives market to hedge currency risk. According to a recent ABS/RBA survey (ABS 2001; RBA 2002), derivatives have a large impact on Australia's overall foreign-currency exposure. While resident enterprises (including general government) had a net liability position in foreign-currency debt of A$164 billion they also had a net A$85 billion asset position in foreign-currency denominated derivative contracts. This implies that approximately half of the foreign-currency debt position is hedged.[14] Unfortunately, it is not possible to trace who ultimately holds the other side of the net hedging position of the Australian government and private sector (i.e., who has taken on the Australian dollar currency risk through derivatives). What we can say is that since the domestic financial system in Australia is denominated solely in Australian dollars, it is not the case that Australian households are effectively holding the other side to these positions, leaving foreign residents as the remaining candidates. The high share of off shore turnover in total turnover, seen in Table 9, also points in this direction.
| Financial Sector | ||||||
|---|---|---|---|---|---|---|
| Instrument | Banks | RBA and CBAs(a) | Other financial corporations | General government | Other resident sectors | Total all sectors |
| FC denominated financial debt | ||||||
| Assets | −69.8 | −36.9 | −33.6 | −5.5 | −10.6 | −156.5 |
| Liabilities | 186.5 | 8.8 | 61.4 | 4.1 | 60.1 | 321.0 |
| Net position on debt | 116.7 | −28.1 | 27.8 | −1.4 | 49.5 | 164.5 |
| Principal of FC derivative contracts | ||||||
| In a bought position | −435.3 | −11.3 | −69.8 | −0.4 | −31.7 | −548.4 |
| In a sold position | 325.8 | 32.1 | 61.8 | 8.9 | 34.9 | 463.4 |
| Net position on derivatives | −109.5 | 20.8 | −8.0 | 8.5 | 3.2 | −85.0 |
| Net position on debt unhedged after derivatives |
7.2 | −7.4 | 19.8 | 7.2 | 52.6 | 79.5 |
| Foreign equity assets | −30.7 | 0.0 | −84.0 | 0.0 | −113.9 | −228.5 |
| Foreign-currency exposure | −23.4 | −7.4 | −64.1 | 7.2 | −61.2 | −149.0 |
|
Note: (a) CBAs: State and Territory Central Borrowing Authorities Source: ABS |
||||||
The same study shows that foreign-currency exposure was largest (relative to total net foreign liabilities) in the non-financial private sector and in the government. Banks have a relatively small exposure considering the size of their foreign exchange liabilities. Banks are by far the largest holders of gross and net positions in foreign-currency derivative contracts in Australia.
It would seem that the currency derivatives market in Australia plays two key roles. First, it allows banks to decouple credit from exchange rate risk. In doing so it plays an important part in the intermediation of capital inflows by the banking sector, allowing a broader range of Australian firms access to international capital markets. Second, it provides a mechanism for external insurance against events that depreciate the Australian dollar by effectively reducing total foreign borrowing indexed to foreign currencies. We will return to these two aspects in Section 3.
Footnotes
The RBA did intervene, notably in mid 1998 when there was seemingly large amounts of speculative activity, but was certainly willing to allow the currency to depreciate. [1]
We use the IMF effective exchange rates for comparability. The depreciation of the Australian dollar based on the RBA's Trade Weighted Index, which uses different weights, over this period was less than 5 per cent. [2]
Of course, with the benefit of hindsight, it is likely that the response of the Chilean monetary authority was excessive. Caballero and Krishnamurthy (2003) argue that optimal monetary policy is counter-cyclical even if that does little to reduce the real impact of the sudden stop once it takes place. This does not lessen our assertion that the conditions faced by the two central banks were very different, and that the main reason behind this difference is in the actual and expected behaviour of capital flows. [3]
Unlike output and terms of trade we look at deviations from the period 1990–1997 because 1990 marks the return of capital inflows to emerging markets. [4]
The rising share of foreign assets is not a result of the depreciation of the peso. This is evident from the line in Figure 7 that plots the share of foreign assets adjusting for changes in the dollar/peso exchange rate. [5]
See Caballero (2002) for a more extensive discussion of this point. [6]
For example, when there is an exogenous output gap of 2 per cent, pass-through is below 0.115. [7]
There is extensive theoretical literature on this issue. See for example Krugman (1999a, 1999b), Aghion, Bachetta and Banerjee (2001) and Cespedes, Chang and Velasco (2001). Empirical results are less abundant and categorical, see Bleakley and Cowan (2002). [8]
Note that these measures of mismatch overstate the sensitivity of Australia's indebtedness to currency movements as Australia has a large foreign-currency asset position on derivative contracts, as detailed in Section 2.3.2. [9]
Source: ‘Informe Estadisticas de la Deuda Publica’, Ministerio de Hacienda Chile. [10]
Similar results are found by Bleakley and Cowan (2002), and Cowan (2002). [11]
For comparison purposes we carry out a similar set of regressions for Argentina. We find that the currency ‘matching’ that we see in Chile does not take place in Argentina. Not only is average dollar debt considerably higher in Argentinean firms, but it is distributed equally between tradable and non-tradable sectors. [12]
Close to two-thirds of turnover in Australian is cross-border. None of Chile's turnover is cross-border (BIS 2002). [13]
This measure of foreign-currency ‘exposure’ ignores the elasticity of export revenue to exchange rate fluctuations and substantial foreign equity asset holdings of A$228 billion. Indeed, accounting for foreign equity assets, in 2001 Australia had a net foreign-currency asset position of A$149 billion. [14]