RDP 2003-08: A Tale of Two Surveys: Household Debt and Financial Constraints in Australia 5. Understanding Constraints Better: A Model
July 2003
- Download the Paper 169KB
5.1 Methodology
We construct a logit model and estimate it using the cross-sectional data from the 1998/99 HES. The results of this estimation are interesting in their own right in that they highlight what demographic and economic factors affect the likelihood that a household will be financially constrained. The model will also be used to predict the likely incidence of constraints using different underlying data in later sections.
The specification of the logit model includes variables which economic theory suggests will be related to cash flow problems or which previous empirical studies have shown to be important determinants. The estimated logit equation is:[9]
where Pi is the probability of household i being financially constrained and {Xki} is the set of N independent (demographic and economic) variables for household i. We adopt the following modelling strategy:
- An equation including a large number of demographic, geographic and economic variables is initially estimated.
- Variables with coefficients not significant at the 5 per cent level are eliminated, starting with the least significant.
- As insignificant variables are excluded, the p-values of remaining variables are monitored in case of possible multi-collinearity.
- The final set of (mainly) significant explanatory variables forms the basis of the model.[10] We leave in some variables of particular interest even if they are insignificant.[11]
Variables were selected that best explain cash flow constraints in the 1998/99 model. However, we also compromised, to some extent, on the choice of variables in order to allow comparisons across time. For example, we have data on the outstanding stock of mortgage debt for 1999 and 2001, but not for 1994. This prevented us from using a measure of home equity (the difference between reported dwelling value and the outstanding stock of mortgage debt), despite this variable being an important determinant of constraints in 1998/99. Instead, we simply use the reported dwelling value. We also cannot use interest payments on credit card and personal loan debt, despite these variables being statistically significant, as we do not have these data for 2001. However, tests that compared the models suggested that our choice of variables did not appreciably alter the results.
In making comparisons across time we also need to account for the effect of inflation on households' purchasing power. We do this by adjusting the household income and wealth figures for headline CPI inflation (which was approximately 10 per cent between 1993/94 and 1998/99 and 11 per cent between 1998/99 and 2001, including the effect of the GST).
5.2 Results
The results from the logit estimation, based on the HES 1998/99 data, are presented in Table 1. Since the estimated coefficients represent the effect of the independent variables on the logarithm of the odds of the probability rather than on the probability itself, we also report the partial derivatives or ‘marginal effects’, δP/δXk, evaluated at the sample means in the last column. For continuous variables the marginal effect in the last column is calculated as:
| Variable | Coefficient | Sample mean | Selected unit | Marginal effect |
|---|---|---|---|---|
| Age | −0.05*** | 47.4 years | 5 years | −3.1 |
| Gender | 0.14 | 38.9% | Female | 1.3 |
| Family size | 0.26*** | 2.6 people | 1 person | 3.2 |
| Disability | 0.65*** | 51.2% | Disabled | 5.6 |
| Couple without children | −0.38*** | 24.6% | Compared to person living alone |
−3.2 |
| Couple with children | −0.25 | 33.3% | Compared to person living alone | −2.1 |
| Single parent | 0.32* | 8.5% | Compared to person living alone | 2.9 |
| Mixed family | −0.18 | 9.4% | Compared to person living alone | −1.6 |
| Home ownership | −0.68*** | 69.1% | Home owner | −6.2 |
| Unemployment | 0.40*** | 0.1 people | 1 person | 4.9 |
| Weekly household disposable income | −9.8×10⁻⁴*** | $716 | $100 | −1.2 |
| Dwelling value | −1.78×10⁻⁶*** | $136,500 | $25,000 | −0.6 |
| Income from interest | −2.41*** | 4.5% | 1% of HHY | −0.3 |
| Income from government benefits | 0.92*** | 3.1% | 1% of HHY | 0.1 |
| Mortgage repayments | 1.62*** | 6.4% | 1% of HHDY | 0.2 |
| Credit cards | −0.19*** | 1.2 | 1 card | −2.3 |
| Credit card interest | 0.55*** | 31.2% | Pays interest | 4.9 |
| Constant | 0.84 | |||
| Number of observations = 6,793 LR χ2 (17) = 995.85 Probability that the LR > χ2 = 0.00 Pseudo R2 = 0.25 Number of cases correctly predicted = 82 per cent |
||||
|
Note: ***, ** and * denote the 1, 5 and 10 per cent levels of significance respectively. |
||||
For dummy variables the partial effect measures the estimated change in probability of a discrete change in the dummy from 0 to 1. The last column shows the estimated effect of a change in the variable equal to the ‘selected unit’ on the probability of the household being constrained. A positive sign indicates that the variable is estimated to increase the likelihood of the average household being cash-constrained.
5.2.1 Demographic variables
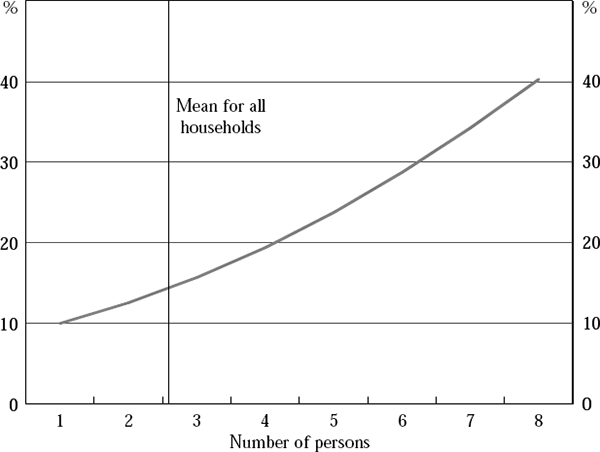
On the basis of the logit model, Figures 5 and 6 plot the marginal effects of age and family size on the estimated probability of being financially constrained, holding all other variables constant at their sample means.
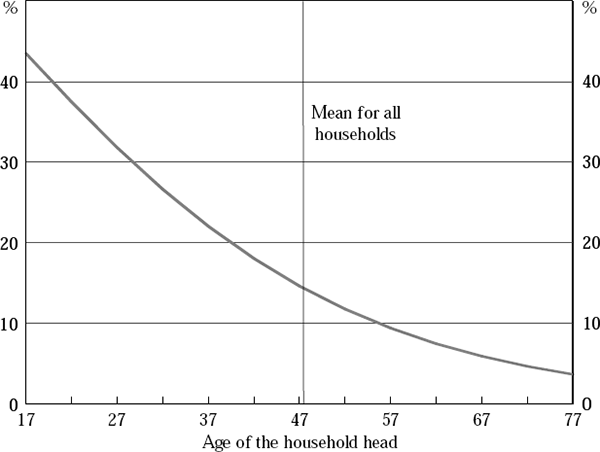
From Figure 5 and Table 1, as the age of the household head rises by 5 years, the likelihood of being cash-constrained is estimated to fall by 3.1 percentage points, on average. On the supply side, adverse selection in lending markets may lead to credit rationing for younger households as there is likely to be greater uncertainty over the future income streams of younger households and they are also less likely to have accumulated financial assets that could be used as collateral. On the demand side, cash flow constraints are likely to be tighter in the formative years of a household, given that desired consumption tends to be high relative to current labour income.
Because our data are not a panel we cannot rule out the possibility that this represents a cohort effect rather than an age effect. It may be that today's older people, as a result of the experiences they had when growing up, especially during World War II, go cold and eat less when they have liquidity problems, but rarely get behind on payments or seek assistance (or admit to it). It follows that they will be less likely to be cash-constrained according to our measure. Similarly, younger people may have different attitudes to debt and bills. It may be the case that younger households are choosing not to pay their bills (but are still classified as constrained) rather than being unable to pay their bills. Ultimately, this reflects the limitations of our data.
Figure 6 reveals that constraints are estimated to become tighter with more dependents, suggesting that, as families get bigger, their desired consumption increases relative to their income. An additional person in the household increases the probability of cash flow problems by 3.2 percentage points, on average.
In terms of household structure, the probability of couples without children being financially constrained is 3.2 percentage points lower than for persons living alone, on average. Both demand and supply effects are likely to work in the direction of relaxing the constraint for couples without dependents. For instance, they may have a lower level of desired consumption because of economies of scale in consumption (of both durables and non-durables). On the supply side, they could be given more credit because loans may be jointly underwritten. On the other hand, the probability of single parents with dependents being constrained is 2.9 percentage points higher than for persons living alone, ceteris paribus.
5.2.2 Economic variables
Home ownership is correlated with fewer cash flow problems. The likelihood that home owners (with and without a mortgage) are constrained is 6.2 percentage points lower, on average, than for renters. The number of unemployed persons in the household is also a strong determinant of cash flow problems. If a household member becomes unemployed, the household is nearly 5 percentage points more likely to be constrained, on average.
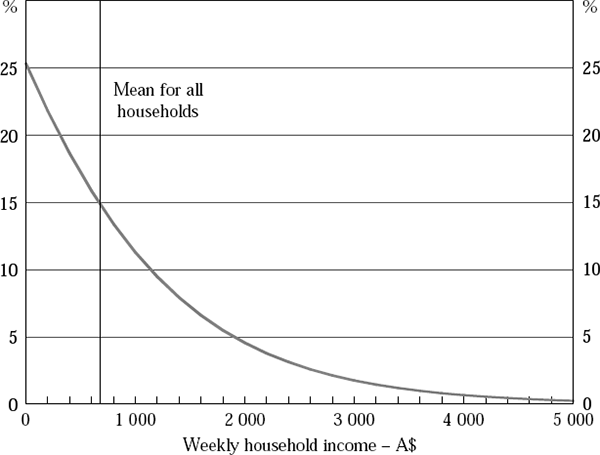
Figures 7 and 8 plot the marginal effects of weekly income and housing wealth on the predicted probability of being constrained, ceteris paribus. As we can see in Figure 7, a $100 increase in weekly household income reduces the probability of being cash-constrained by 1.2 percentage points, on average. However, most of the effect of income on cash flow occurs at low-income levels. For instance, the probability of being constrained declines by about 13 percentage points when household income rises from $0 to $1,000 per week. It only falls a further 6 percentage points when income rises from $1,000 to $2,000.
Dwelling value is also a good predictor of financial constraints. An increase in dwelling value of $25,000 reduces the likelihood of being constrained by 0.6 percentage points, on average (Figure 8).
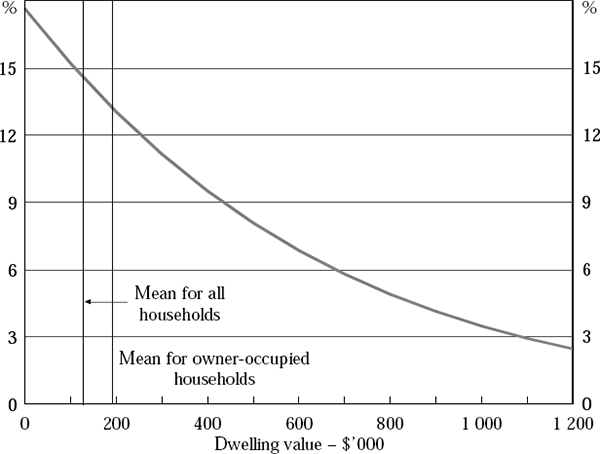
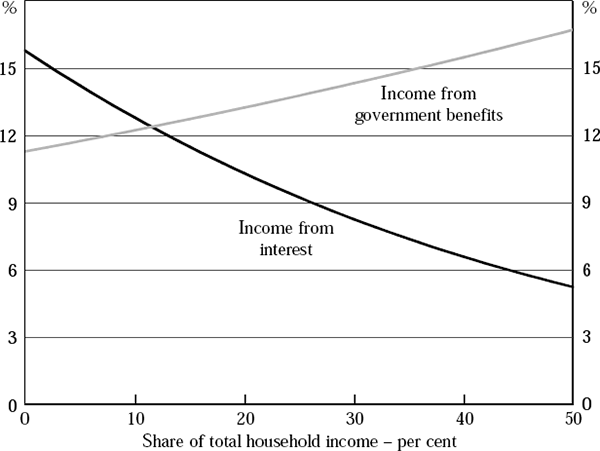
Figure 9 shows that the greater the share of income sourced from interest the less likely a household is to be constrained. Increasing the share of income earned from interest by 1 per cent reduces the probability of being cash-constrained by 0.3 percentage points. This is presumably because these households are wealthier and/or hold higher levels of precautionary savings to effectively buffer against adverse cash flow movements. Conversely, a 1 per cent rise in the share of income coming from government benefits is estimated to increase the likelihood of being financially constrained by 0.1 percentage points. The significant, albeit mild, effect of this variable is unsurprising given that cash-constrained households include a higher proportion of pension recipients such as the unemployed, the disabled and the elderly.
5.2.3 Interest-sensitive variables
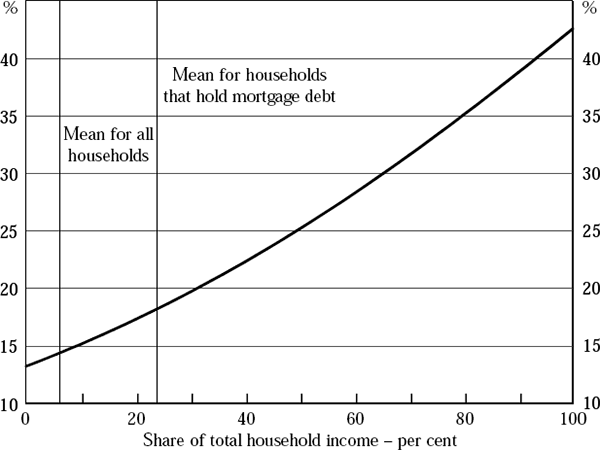
A 1 per cent rise in mortgage debt (as a share of income) increases the probability of the average household being constrained by 0.2 percentage points, all other things being equal (Figure 10). While the magnitude of the effect is not large, it is statistically significant at the 1 per cent level.
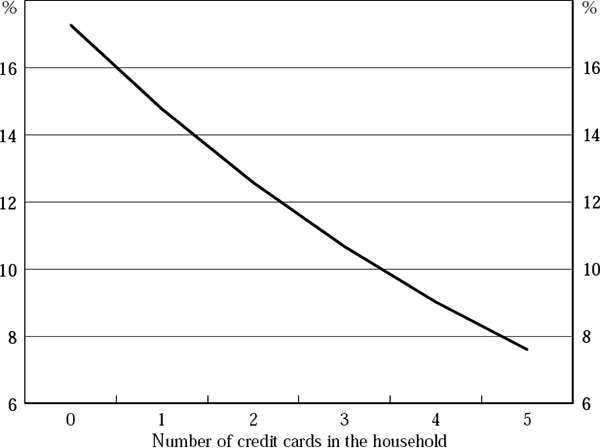
As Figure 11 shows, a higher number of credit cards is correlated with less binding constraints, on average. Having an additional credit card is associated with a fall in the probability of being cash-constrained of 2.3 percentage points, ceteris paribus. This most likely reflects the fact that banks are less likely to issue credit cards to high-risk households. As such, this variable may be related to whether households have been denied credit – the variable used in some US studies.
Importantly, if any member of the household pays interest on their credit card, the probability of the household being constrained is estimated to rise by 4.9 percentage points, all other things being equal. However, the overall effect of the credit card debt-service burden is small, as credit card interest payments generally constitute a small share of the weekly household budget.
Finally, there are some interesting differences between constrained and unconstrained households. As Table 2 reveals, the average mortgage debt-service ratio is higher for constrained households at 6.6 per cent of disposable income, compared to 6.3 per cent for unconstrained households. When mortgage repayments are split into principal and interest it becomes clear that the composition of the burden differs significantly between the two groups. On average, mortgage interest payments take a greater share of income for constrained households. Conversely, greater cash flow for unconstrained households allows them to make more voluntary excess repayments, so their principal debt payments are higher.
| Variable | Constrained households | Unconstrained households | Full sample |
|---|---|---|---|
| Weekly household disposable income ($) | 573 (9) |
757 (7) |
716 (6) |
| Dwelling value ($) | 69,600 | 155,600 | 136,500 |
| (2,600) | (2,100) | (1,800) | |
| Home ownership (% HH) | 42.7 (1.3) |
76.6 (0.6) |
69.1 (0.6) |
| Mortgage repayments – total (% HHDY) | 6.6 (0.3) |
6.3 (0.2 |
6.4 (0.2) |
| Mortgage repayments – interest (% HHDY) | 3.8 (0.2) |
3.0 (0.1) |
3.2 (0.1) |
| Mortgage repayments – principal (% HHDY) | 2.7 (0.2) |
3.3 (0.1) |
3.2 (0.1) |
| Has at least one credit card (% HH) | 50.7 (1.3) |
70.0 (0.6) |
65.7 (0.6) |
| Has at least one housing loan (% HH) | 29.9 (1.2) |
30.0 (0.6) |
30.0 (0.6) |
| Has at least one loan (% HH) | 70.0 (1.2) |
77.7 (0.6) |
76.0 (0.5) |
|
Notes: Standard errors in parentheses. |
|||
5.3 What Has Happened Over Time?
In this section we take the model estimated on the 1998/99 data, and apply it separately to the data from the 1993/94 HES and 2001 HILDA Survey to investigate how the factors that influence financial constraints may have changed over time. That is, we look at how the demographic and economic variables (that our model finds are significant) have evolved over time and, using our model, predict what may have happened to household constraints. We adopt this procedure because the 1993/94 HES did not ask the particular questions on financial fragility, while the 2001 HILDA Survey's financial fragility questions elicited very different answers suggesting that they are not directly comparable with the HES questions and answers.
5.3.1 Comparing the HES and HILDA
The raw data from HILDA for 2001 suggest that approximately 30 per cent of households in the sample have experienced some form of financial constraints. This is significantly higher than the 22 per cent found in the HES for 1998/99. On the face of it this would suggest that constraints have risen significantly in the two years between surveys.
However, it seems more likely that the difference in reported cash flow problems is mainly the result of the relevant questions in the HES being administered on a face-to-face basis whereas the HILDA financial stress questions were self-administered. If respondents see the answers to some of these questions as sensitive or embarrassing then the likelihood of obtaining truthful responses will be reduced by the presence of the interviewer. Some respondents may be reluctant to admit that they have asked for financial help from others or, for example, actually went without meals because of money problems. This reluctance will be most likely to occur when the question is posed directly by an interviewer in the home situation (as was the case with the financial stress questions in the HES).[12]
To investigate this further, we look at the results we get if we use the 2001 data with the 1998/99 model and also if we estimate a 2001 model and apply it to the 1998/99 HES data. Doing so, we find that while the constant is higher in 2001, the slope coefficients and marginal effects are broadly the same for the two models, both in magnitude and significance. In other words, there does not appear to have been any change in the cross-sectional relationships between the explanatory variables and the dependent variables, merely a change in the level.[13] Secondly, the predicted change in cash constraints between the two periods from both models are roughly similar. Thus, the 1998/99 model predicts that the proportion of constrained households falls by 3.6 percentage points from 1998/99 to 2001 and the 2001 model predicts a fall of 4.9 percentage points which, given the higher level involved, is roughly similar in percentage terms. Thus, there is some question about the actual level of constraints but less about the relative change.[14]
Given all this, we believe that the model we have estimated is fairly robust across time. On this basis we report the results from the 1998/99 model across all time periods. This allows us to focus on the main demographic and economic factors driving the changes in financial constraints over time without worrying about the changes induced by the change in survey between 1998/99 and 2001.
5.3.2 Changes in key variables
The base model estimates that financial constraints have fallen from 22.5 per cent of households in 1993/94 to 18.9 per cent in 2001. Table 3 shows how some of the key explanatory variables in the model have contributed to this estimated change in the level of constraints in Australia between 1994 and 2001. A positive sign in either of the last two columns indicates that the variable is estimated to have contributed to increased cash constraints over the period.
| Variable | Sample means | Marginal effects | ||||
|---|---|---|---|---|---|---|
| 1993/94 |
1998/99 |
2001 |
From 1994 to 1999 | From 1999 to 2001 | ||
| Weekly household disposable income (1999 $) | 673 | 716 | 757 | −0.56 | −0.50 | |
| Dwelling value (1999 $) | 123,200 | 136,500 | 157,800 | −0.33 | −0.48 | |
| Income from interest (% HHY) | 5.0 | 4.5 | 2.5 | 0.12 | 0.62 | |
While our base regression estimated that demographic variables were important explanators of cash constraints, most of them did not change significantly over the sample period. Thus, demographic variables are not estimated to have contributed significantly to the estimated relaxation in constraints. This is unsurprising given the relatively short period of seven years between the three surveys.
Relatively strong economic growth and rising housing wealth from 1994 to 2001 are estimated to have contributed the most to relaxing constraints in Australia over this period. Combined, growth in real income and wealth are predicted to have reduced the probability of being cash-constrained by around 0.9 percentage points between 1994 and 1999 and a further 1 percentage point between 1999 and 2001, ceteris paribus.
Our model predicts that an increase in the mortgage debt-service ratio raises the probability of an average household being constrained, though the effect is relatively small. Ceteris paribus, it increased the probability of being constrained by 0.2 percentage points between 1993/94 and 2001.
In addition, the model predicts that the fall in income earned from interest has increased constraints.[15] The share of household income sourced from interest fell from 5 per cent in 1993/94 to 2.5 per cent in 2001, partly offsetting the positive effect of economic growth. More significantly, the number of respondents reporting zero weekly interest income rises from around 30 per cent of the population in 1994 to 73 per cent of the population in 2001. This is estimated to have increased the likelihood of a given household being cash-constrained by 0.74 percentage points, ceteris paribus.
However, we have reason to question the change in this variable. The fall in interest income can be explained by lower retail deposit and investment rates, leading to a reduction in the interest paid on existing accounts. But this effect may have seen household savings redirected towards higher-return investments. This is supported at the aggregate level as households have redirected their wealth into shares and other equity at the expense of interest-bearing accounts. Household wealth held in cash and interest-bearing deposits at banks has fallen (as a percentage of the total stock of household financial assets) by around 5–6 per cent between 1993/94 and 2000/01. If this is true, we cannot conclude that the fall in savings has led to more binding constraints as households are simply holding their wealth in other assets. Thus, households may have been less constrained in 2001 than our model indicates.
In addition to the income from interest variables, there are a number of other explanatory variables that are likely to be problematic when making comparisons across surveys. We remove the partial effects for the number of credit cards owned by the household, whether households pay interest on their credit cards, whether a disabled person lives in the household, and how much household income is sourced from interest and government benefits. Once all these adjustments are made, our preferred model predicts that financial constraints have only fallen slightly between 1993/94 and 2001 from 24.1 per cent to 21.6 per cent. We do not consider this substantially different from the base model, and the numbers tell essentially the same story.
Footnotes
Clearly, it is not feasible for the household surveys to actually cover the whole Australian population. Instead, they sample only a small selection of households. Because the estimates are based on a sample of households, the estimates may not be representative of the population as a whole. To minimise this type of bias, all estimates are adjusted using sampling weights provided by the ABS. The weights are equal to the inverse of the probability of each household being selected from the population. [9]
Definitions for the variables used are available in Appendix B. [10]
Before estimating the model we had to clean the data in a number of ways. We exclude households with ‘unnatural’ budget or income shares. All weekly expenditure items are divided by weekly household disposable income to generate budget shares. Households reporting negative expenditures (often due to refunds) or negative incomes (mainly due to losses from own businesses) imply negative budget shares and are excluded. Budget shares exceeding 100 per cent (i.e., expenditure exceeds income) are also excluded to remove the effect of lumpy expenditures. For example, a household reporting mortgage payments of 250 times their weekly income may be a data error or reflect them having paid off the whole loan during the survey week – in either case it is an unrepresentative observation that needs to be excluded. This means we exclude 99 households (1.3 per cent of the sample) in 1998/99 and 142 households (1.8 per cent) in 2001. Also, we imputed some income observations in the 2001 HILDA data, which are used in Section 6. Details of this procedure may be found in Appendix C. [11]
A change in the wording of the questions may also explain the rise in reported problems. The HES asks one respondent, speaking on behalf of the household, to think about the household's financial position while HILDA asks each person in the household to think about their own personal finances. Larger households may be more likely to have at least one person suffering from financial stress and so the household as a whole would be counted as being in distress. But, alternatively, larger households provide greater opportunities for intra-household income transfers and therefore are less likely to have cash flow problems. However, even single-person households reported higher cash flow problems in 2001, presumably a household type where the distinction between the household and the individual disappears. [12]
This is confirmed in a pooled regression where dummies are interacted with all the estimated coefficients to allow for different cross-sectional relationships across time. [13]
The results of this exercise are available from the authors upon request. [14]
Income from interest includes interest receipts from savings accounts, debentures, bonds, trusts, and personal loans to persons outside the household. It excludes income from superannuation, property income and income from royalties and dividends on shares. [15]