RDP 9804: Stylised Facts of the Australian Labour Market 2. Stylised Facts of the Labour Market
April 1998
- Download the Paper 485KB
The most notable labour market development over the past 30 years has been the rise in the unemployment rate to over 8 per cent. The large rise in the unemployment rate occurred between 1974 and 1983, when the unemployment rate increased from 2 per cent to 10 per cent. Since the early 1980s, the unemployment rate has tended to fluctuate with the economic cycle around a relatively constant mean. Looking further back in history, it is clear that there have been other periods in which the unemployment rate has been in excess of 8 per cent (Figure 1)[1]. The major difference on this occasion is the persistence of the higher unemployment rate.[2]
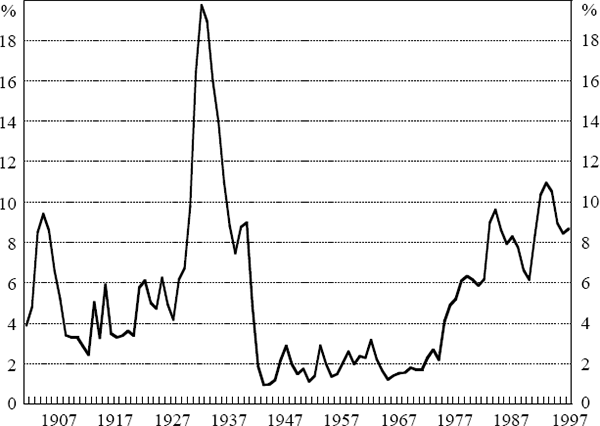
Source: Butlin (1977) and ABS Cat. No. 6203.0
Corresponding to the increase in unemployment in the 1970s, employment growth slowed significantly in the second half of the decade before accelerating again in the 1980s (Figure 2). While being slower than in the 1980s, employment growth in the current cycle (since June 1991) has averaged around 1.6 per cent per annum.
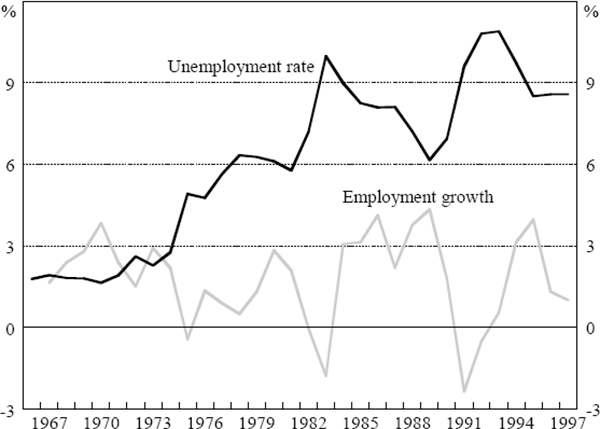
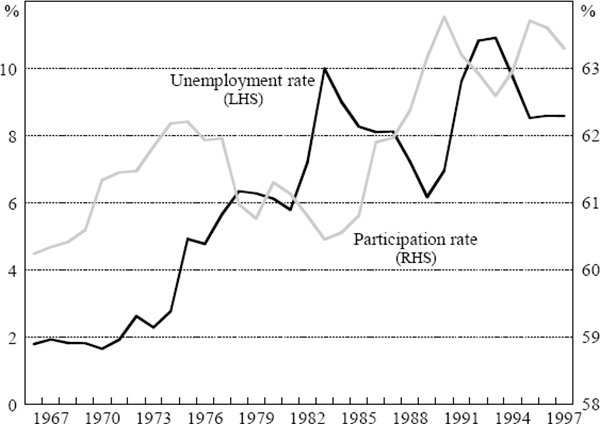
Figure 3 shows that the participation rate – that is, the proportion of the civilian population aged 15 years and over who are either employed or unemployed – has risen over the past 30 years from around 60 per cent to around 63 per cent. This rise in the aggregate participation rate has masked offsetting trends in the participation rate for males, which has declined from around 84 per cent to around 73 per cent, and females, which has risen from around 37 per cent to around 54 per cent. These trends are examined in greater detail below. The fact that the unemployment rate has risen along with the rising participation rate implies that employment growth has not been sufficient to absorb the expansion in the labour force.
In the rest of this section, we decompose the movement in the aggregate unemployment rate by gender, skill, age, industry and duration and consider the trends in these variables by examining employment growth and participation.
2.1 Females and Males
The increase in aggregate unemployment in the mid 1970s was spread across all categories of worker, although to varying degrees. Males looking for full-time work now comprise a larger proportion of the total pool of unemployed, rising from 38 per cent of the total in 1970 to 51 per cent in 1997. On the other hand, the proportion of females looking for full-time work in the unemployment pool has declined from 34 per cent in 1970 to 28 per cent in 1997. To further emphasise the contrast between the genders, since 1970, the number of unemployed males has increased at an average rate of 9.5 per cent per annum, whereas the number of unemployed females has increased by 7.2 per cent per annum. We can further assess the relative performance of the male and female full-time and part-time workers by examining their unemployment rates (Figure 4).
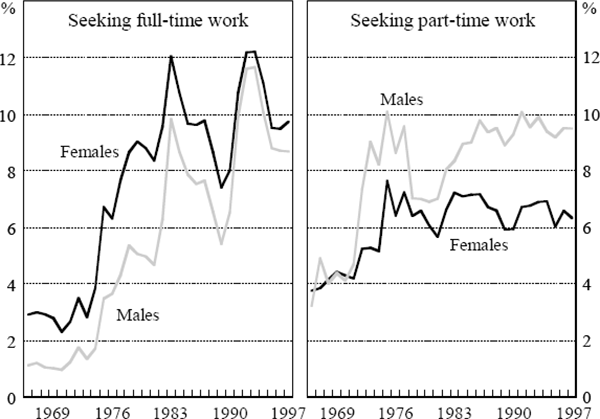
The aggregate unemployment rate has risen from 1.8 per cent in 1966 to 8.6 per cent in 1997. The increase in the unemployment rate of full-time males has contributed 5 percentage points to the total rise of 6.8 percentage points, compared to a contribution of only 0.2 percentage points from part-time males. The increase in the full-time female unemployment rate has contributed 1.6 percentage points, while the part-time female unemployment rate has contributed 0.2 percentage points to the total increase.[3]
In the 1970s, the unemployment rate for full-time females was substantially higher than that for full-time males. It increased from around 2.5 per cent at the beginning of the 1970s to around 9 per cent by the late 1970s while the unemployment rate for full-time males increased from around 1 per cent to around 5 per cent. Subsequently, the difference in unemployment rates between the two genders has narrowed considerably, principally in the two recessions in 1982–83 and 1991, from 4 percentage points in 1980 to only around 1 percentage point in 1997.
A similar analysis of the 1970s for part-time workers is frustrated by data problems; as noted by Fahrer and Heath (1992), the part-time unemployment rate for men was inexplicably high between 1972 and 1977. This was remedied by a new and more comprehensive monthly Labour Force Survey which began in February 1978.
In the early to mid 1980s, the unemployment rate for men wanting to work part-time trended upwards. Over the past ten years it appears to have cycled around a higher mean of just over 9 per cent and is currently around 3 percentage points above the rate for females wanting to work part-time. In addition, the unemployment rate for men looking for part-time work is now higher than that for men looking for full-time work. Finally, part-time unemployment rates for both males and females show considerably less cyclical variation than full-time rates.
As discussed earlier, the above trends in unemployment rates are the net outcome of the differing trends in labour demand (employment growth) and labour supply (participation rates). The fact that the aggregate unemployment rate has risen at the same time as the participation rate implies that demand has not grown sufficiently to absorb the increased supply. We now turn to an examination of the trends in labour demand and supply.
Table 1 shows that with the exception of males working part-time, rates of employment growth for the different types of labour have broadly followed the aggregate over time. The slow growth in employment during the period from 1974 to 1983 compared to the other periods is particularly noticeable.
| Males full-time |
Males part-time |
Females full-time |
Females part-time |
Total | |
|---|---|---|---|---|---|
| Sep 1966 to June 1974 | 1.8 | 1.8 | 3.3 | 7.3 | 2.6 |
| June 1974 to Mar 1983 | −0.1 | 6.7 | 0.4 | 4.2 | 0.2 |
| Mar 1983 to June 1991 | 1.1 | 6.3 | 3.2 | 5.3 | 2.5 |
| June 1991 to Mar 1998 | 0.7 | 5.4 | 1.3 | 2.9 | 1.5 |
| Total | 0.9 | 5.0 | 2.0 | 4.9 | 1.8 |
Another feature of Table 1 is the strong growth in part-time employment for both males and females of around 5 per cent per year over the past thirty years. While the growth in part-time female employment has been well publicised, it has been less widely acknowledged that the growth of male part-time employment has been more than double that of females over the past 10 years. The extremely slow growth of male full-time employment is also evident.
As a result of these variations in employment growth, the share of male full-time employment in total employment has declined from 67 per cent in 1966 to just around 50 per cent in 1997. The share of female full-time employment has risen marginally to around 25 per cent in 1997. However, the share of female part-time employment has risen rapidly from just over 7 per cent of total employment in 1966 to over 18 per cent in 1997.
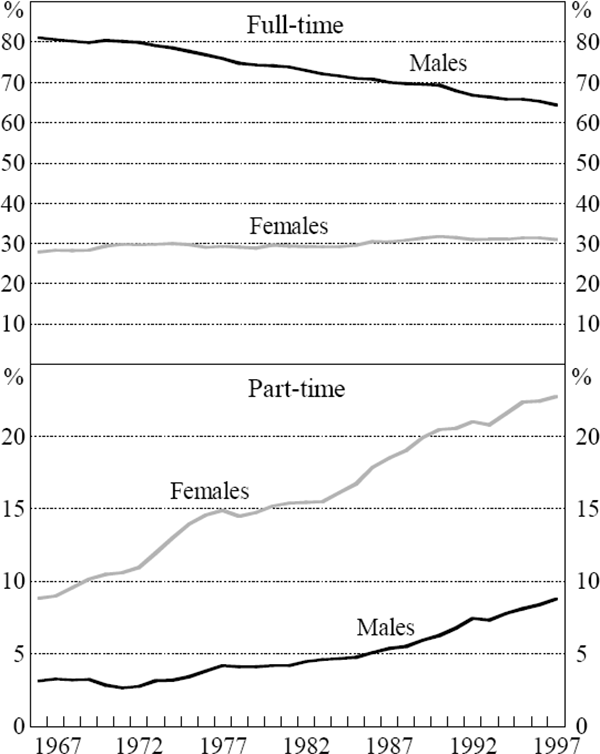
On the supply side, it has been well documented that the participation rate of men has been declining continuously over the past thirty years. This is more than accounted for by a decrease in full-time participation of 17 percentage points, with part-time participation actually increasing by nearly 6 percentage points over that period (Figure 5). The increase in female participation, due primarily to the increase in part-time participation, is also well known. While there has been a strong increase in the participation rate of married women looking for full-time employment, this has been largely offset by the decrease in full-time participation by unmarried females. The past five years or so have not seen any changes to these well-established trends.
Overall, the net effect has been that the participation rate has increased by around 2⅓ percentage points over the past 19 years; if the participation rate was still at its 1978 level and employment growth was unaffected then the unemployment rate would be around 5 per cent.
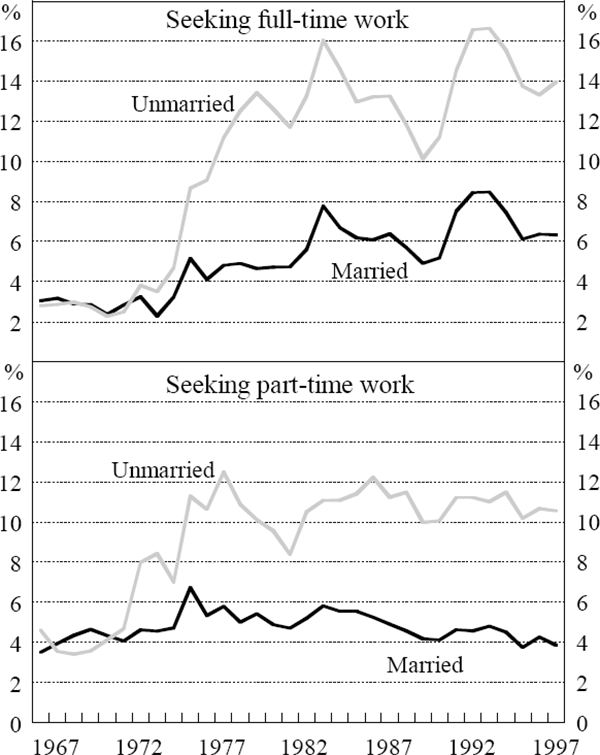
A further understanding of the trends in female labour market performance can be obtained by splitting total female unemployment into married and unmarried females (Figure 6). The unemployment rate of unmarried women has been significantly higher than that for married women since the mid 1970s: in 1997, the unemployment rate for unmarried women looking for full-time jobs was 14 per cent and 10.6 per cent for those looking for part-time jobs, in contrast to rates of 6.3 per cent and 3.9 per cent respectively for married women. These statistics are even more striking when one considers that the participation rate of married women has increased by around 26 percentage points over the past 30 years and is now higher than that for unmarried females which has been roughly unchanged over the same time horizon. Fahrer and Heath (1992) suggest that this difference in unemployment rates reflects the fact that unmarried women are disproportionately young women and so the unemployment rates mirror the very high rates of youth unemployment generally (Section 2.3).
Finally, in a recent study, Miller (1997) examines the concentration of the burden of unemployment on family units. He estimates that one in 13 families with two partners of working age had at least one partner unemployed and that of these, almost a quarter were in families where both partners were unemployed. The concentration in the burden of unemployment also differs according to the characteristics of the family. For example, approximately one couple in eighteen, where there are no dependent children, has either the husband or wife unemployed in contrast to one in ten for families with children. Similarly, one in eight families who were born in non-English speaking countries has at least one partner unemployed, of which 30 per cent have both partners unemployed.
2.2 Skill
Another important feature of Australia's labour market landscape is the relative performances of skilled and unskilled workers. There are two standard approaches to looking at the labour market performance of different skill categories: the first considers a breakdown by occupation, the second by educational attainment. We will consider both in turn.
Figure 7 shows the unemployment rates for both skilled and unskilled workers using occupation data.[4] Skilled occupations include managers and administrators, professionals, para-professionals and trades people; unskilled occupations include sales people and personal service workers, plant and machine operators and labourers. The unemployment rate for skilled workers is lower than that for unskilled workers. Moreover, using this definition of skill, over the past 10 years or so there has been no deterioration in the relative unemployment rate of unskilled workers; if anything the margin has narrowed slightly. This stands in contrast to the much-discussed phenomenon of skill-biased technological change[5] which increases disproportionately the demand for skilled labour. The unemployment rate for unskilled labour may not necessarily be adversely affected however, if either wages fall relatively for unskilled workers (as seems to have occurred in the US)[6] or if the relative supply of skilled labour increases in line with the increase in demand. In Australia, Borland (1997b) finds that the supply of skilled labour has indeed increased broadly in line with the increase in demand so that the return to skill has not risen.
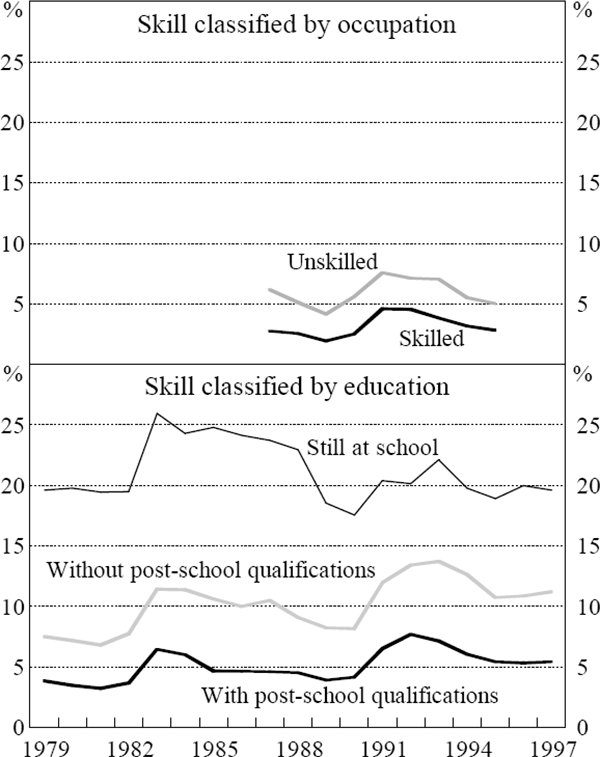
There are, however, a number of problems using the occupation-based classification of skill, as it assumes that there is very low mobility of labour between different occupations in the skilled and unskilled categories, when in reality there are likely to be both skilled and unskilled workers in any particular occupation group. It is also evident that the unemployment rates for both categories are lower than the aggregate unemployment rate. This reflects the fact that around 50 per cent of unemployed workers are not, or cannot be, classified by their last full-time profession. First-time job searchers and people who have not had a full-time job in two years are examples of these.
As an alternative therefore, the second panel in Figure 7 shows unemployment rates by educational attainment. There are three broad categories of workers: those with post-school qualifications, those without, and those still at school.[7]
There is substantial disequilibrium in the market for the labour of those still attending school with the unemployment rate averaging 22 per cent over the past 15 years. However, there is no obvious indication that this situation is deteriorating: the unemployment rate is lower than it was in 1982, a period when the participation rate was lower; and those attending school make up just 6 per cent of the total number of unemployed. Those still at school are clearly restricted in their ability to search for work, and to the extent that they are in the process of becoming increasingly skilled, unemployment is more likely to be a transitory phenomenon. Furthermore, some part of this unemployment is comprised of those seeking part-time work outside school hours, rather than necessarily seeking work as an alternative to education.
Those without post-school qualifications (65 per cent of the unemployed) have a higher rate of unemployment (11.2 per cent in May 1997) than those with post-school qualifications (5.4 per cent).[8] This is even more striking when one considers that the participation rate of those without post-school qualifications is around 15 percentage points lower than those with post-school qualifications suggesting the possibility of a greater rate of hidden unemployment amongst the unskilled. It is also clear that those without post-school qualifications have been relatively harder hit in recessions. Since the most recent recession, the widening in the unemployment rates of those with and without post-school qualifications has only been partially reversed.
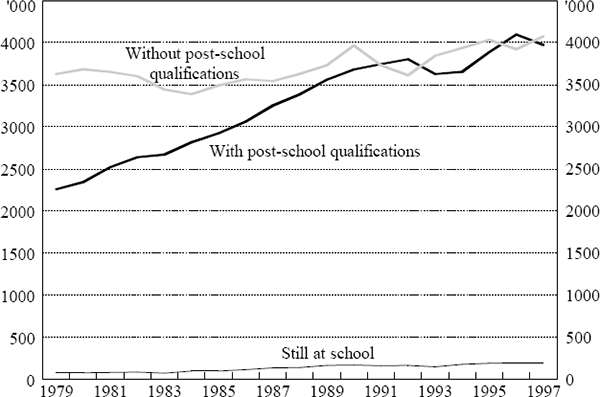
Figure 8 shows employment growth by educational attainment. The lower unemployment rate of those with post-school qualifications is mirrored by strong employment growth. Over the past 18 years (the point when the data on education levels begins) the number of people employed with post-school qualifications has grown at an annual rate of 3.2 per cent. This compares to an average annual employment growth rate of only 0.6 per cent for those without post-school qualifications.
This increase in skilled employment reflects strong increases in the demand for, and supply of, skilled labour. On the supply side, there has been a strong increase in the retention rate at secondary schools and in the number of students going on to complete tertiary education. Since 1980 the retention rate for Year 12 students has doubled to a rate of 72 per cent in 1995, while the proportion of the population in the labour force with post-school qualifications has risen by around 6 percentage points in the past 15 years to 47 per cent.
2.3 Age
When examining unemployment rates by age, we consider four broad groupings, 15 to 19 years, 20 to 34 years, 35 to 59 years, and 60 years and above. The most striking fact is that youth (15 to 19 year olds) unemployment rates are significantly higher than those of older age groups (Figure 9): the unemployment rate for persons aged 15 to 19 years is around 22 per cent in contrast to a rate of around 6 per cent for 35 to 59 years olds.
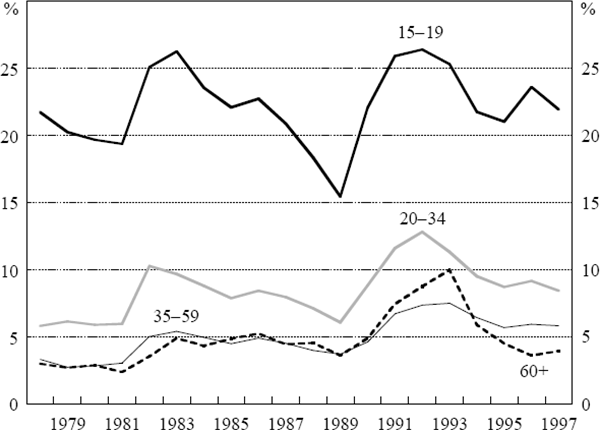
High rates of youth unemployment have been the source of much concern; the true picture is however, somewhat muddied by the fact that roughly one third of unemployed youths are still attending school, an endeavour that is likely to improve their future prospects by raising their skill levels. The unemployment rate of youths who have left school is currently 23.6 per cent; this group comprises around 11 per cent of the total number of unemployed. However, the youth unemployment rate has not increased over the sample period, in contrast to the rate for 20–34 year-olds, and the share of youth unemployment in the total has declined from over 30 per cent to around 20 per cent.
While the unemployment rate for males aged 15 to 19 years has increased by around 3½ percentage points, that for females of a similar age has fallen by roughly the same amount over the past 19 years. In fact, for all age groups up to 55–59 years, the unemployment rate of males has increased and has risen further than that for females over the sample period.
An examination of participation rates by age reveals that the young have a lower participation rate than that of 35 to 59 year olds (Figure 10) and hence, this cannot account for their higher unemployment rate. It is also evident that the differences in the cyclical behaviour of the unemployment rates of these groups cannot be fully explained by the differing cyclical behaviour of participation rates.
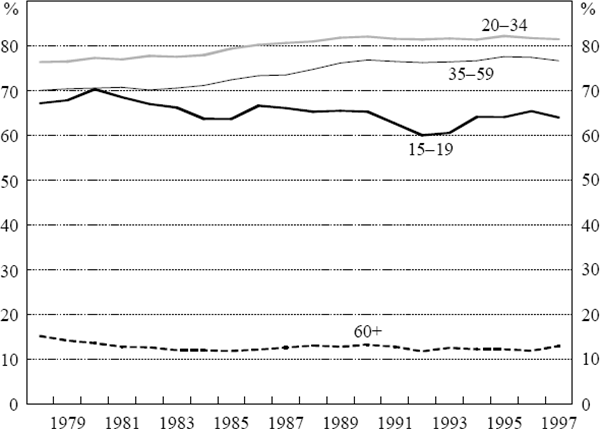
Indeed, the participation rates for both young males and females fell significantly in the early 1990s, thus having a moderating influence on the increase in their unemployment rate. Over the longer run, there has been a trend decline in the labour force participation of young people largely reflecting their increased participation in education. Furthermore, the participation rate of 19 year olds in education has also risen to 51 per cent in 1995.
The increase in the unemployment rates for males does not correspond to a similar rise in their participation rate; in fact participation rates for males across all age groups have fallen over the past 19 years with the largest declines being for the younger (15 to 19) and older (60 to 65) age groups. This is in sharp contrast to the strong increase in participation of females aged between 20 and 59. The increase in the unemployment rate for 20 to 59 year old females in part reflects this strong increase in their participation rate.
In considering employment performances across age we focus on employment to population ratios to help control for demographic changes in the composition of the workforce (Figure 11). Over the past 19 years, employment ratios for males across all age groups have declined, more than accounting for the increase in unemployment rates for these groups. That is, the decline in employment rates of males has been reflected in higher unemployment rates and in more males leaving the labour force completely. The significant decline in the unemployment rate for men older than 60 since late 1993 is in part due to the removal of the activity test for older long-term unemployed males in March 1994, which means that on a survey basis (which underpins the data reported here) they are no longer classified as unemployed even though they still draw the unemployment benefit.
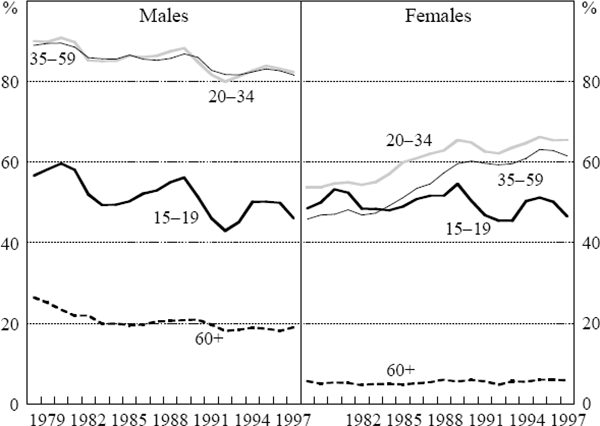
This stands in sharp contrast to employment ratios for females aged 20 to 34 and 35 to 59 which have increased by 12 and 16 percentage points respectively, more than offsetting a fall in employment rates for young females, and an unchanged ratio for older females.
2.4 Industry
The differing labour market experiences of males and females, and full-time and part-time workers can be accounted for by differences in the performances of the various industries in the economy. Table 2 presents annual rates of employment growth by industry and gender since 1984.[9] The table is arranged in descending order of the proportion of total employment accounted for by males and shows that there is substantial variation in the gender shares of employment, and in the shares of full-time employment. There is a strong positive correlation (0.76) between industries with a high share of male workers and industries with a high share of full-time employment.
| Males share | Full-time share | Males full-time | Males part-time | Females full-time | Females part-time | Total |
|
|---|---|---|---|---|---|---|---|
| Mining | 89 | 98 | −1.2 | −3.8 | 1.2 | −2.4 | −1.1 |
| Construction | 86 | 86 | 2.0 | 4.9 | 4.2 | 3.3 | 2.3 |
| Utilities | 86 | 95 | −6.8 | 3.5 | −2.7 | 10.6 | −6.2 |
| Transport | 77 | 87 | 0.1 | 5.8 | 3.8 | 5.9 | 1.2 |
| Manufacturing | 74 | 89 | −0.5 | 3.5 | −0.7 | 2.3 | −0.2 |
| Wholesale trade | 71 | 86 | 1.3 | 6.7 | 0.8 | 3.4 | 1.6 |
| Agriculture | 69 | 77 | −0.4 | 3.6 | 2.4 | 2.1 | 0.6 |
| Communication | 68 | 87 | −1.1 | 9.7 | 2.0 | 2.6 | 0.1 |
| Property | 57 | 77 | 5.6 | 11.1 | 6.7 | 5.9 | 6.3 |
| Recreational services | 55 | 61 | 3.2 | 7.2 | 4.1 | 4.7 | 4.3 |
| Govt admin | 54 | 88 | −1.0 | 2.2 | 1.8 | 6.7 | 0.5 |
| Personal services | 50 | 71 | 3.4 | 4.8 | 2.9 | 3.3 | 3.3 |
| Retail trade | 49 | 57 | 1.7 | 7.3 | 0.6 | 4.2 | 2.6 |
| Accommodation cafes etc. | 45 | 55 | 3.3 | 7.7 | 4.5 | 4.3 | 4.4 |
| Finance | 43 | 82 | 0.0 | 2.8 | 1.2 | 5.2 | 1.2 |
| Education | 34 | 70 | 0.8 | 0.4 | 2.4 | 1.5 | 1.6 |
| Health services etc. | 22 | 62 | 1.1 | 5.4 | 2.3 | 5.0 | 3.0 |
| Total | 57 | 75 | 0.8 | 6.0 | 2.1 | 4.0 | 1.9 |
Notes: Columns 1 and 2 are the share of males and full-time workers
of total employment in each sector. |
|||||||
In keeping with the trends highlighted in Section 2.1, most of the industries that have experienced slow aggregate employment growth have been the male-dominated, full-time employment industries. This is particularly the case for mining, utilities, manufacturing and agriculture. The simple correlation between the share of male workers in an industry and employment growth in that industry is −0.53.
On the other hand, service sector industries, including wholesale and retail trade, property and business services, and recreational, health and other services which employ a much greater percentage of females and part-time workers, have experienced much stronger aggregate employment growth. Part-time employment has grown more strongly than full-time employment for both men and women, with the exception of only a small number of industries.
More precisely, we can examine the data in terms of which industries contributed significantly to stronger or weaker growth in the different employment categories (female, male, full-time, part-time), taking into account the industry growth rate relative to aggregate employment growth, and the importance of each industry as a source of employment for that category.
The relatively slow growth of male full-time employment is primarily due to the relatively slow growth of employment in the manufacturing industry, and to a lesser extent, the relatively slow growth of full-time jobs for males in the utilities sector, agriculture and transport. On the other hand, male full-time employment was buoyed by the strong growth in the property sector. Similarly the relatively slow growth in full-time jobs in the manufacturing sector detracted from female full-time employment, and again relatively strong growth in the property sector supported it.
Relatively strong growth in part-time jobs in the retail sector underpinned growth in part-time employment for both females and males. Female part-time employment was also supported by relatively strong part-time growth in the health and property sectors.
2.5 Duration of Unemployment
The increase in unemployment over the past two decades or so has seen a corresponding rise in the prevalence of long-term unemployment. Figure 12 shows that since 1980, the long-term unemployment rate (those unemployed for longer than a year) has more than doubled to its current level of around 2.5 per cent. The long-term unemployment rate is noticeably cyclical, although it generally lags the economic cycle. The rate has fallen more rapidly from its (higher) peak in the 1990s than it did in the 1980s.
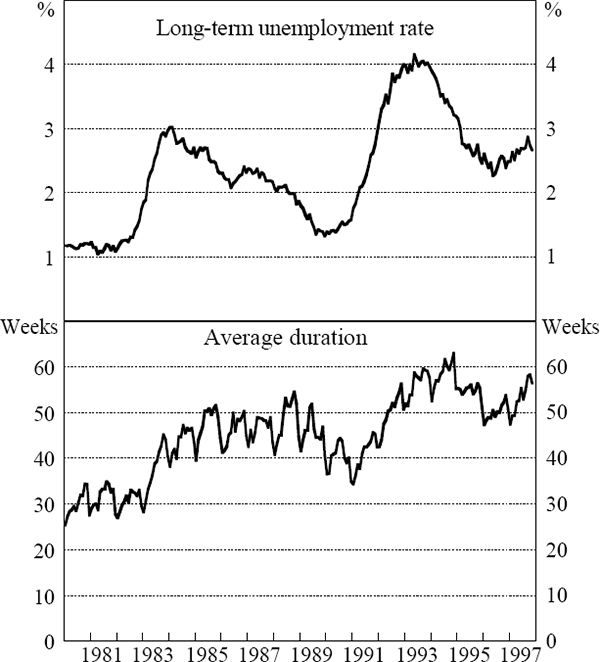
As at December 1997, the long-term unemployed accounted for one-third of the total unemployed. The incidence of long-term unemployment is higher for males than it is for females: long-term unemployed males comprised 37 per cent of the total number of unemployed males, compared to 29 per cent for females. Of the total number of long-term unemployed, around one half had been unemployed for over two years. Again, the proportion was higher for males than for females. These differences between the genders in part reflect the fact that females are more likely to leave the labour force than males (Section 2.6).
Reflecting the increased incidence of long-term unemployment, the average duration of unemployment spells has risen by approximately six months since the early 1980s. The median duration of unemployment spells is considerably shorter than the average: in 1997 the average duration was 53 weeks compared to the median duration of 21 weeks. This implies that there is a relatively large number of people with short spells of unemployment but also a smaller group of people who have remained unemployed for a relatively long period.
Decomposing the average duration data by gender and age (Table 3), indicates that younger people tend to have shorter spells of unemployment. This may reflect the fact that younger people are ‘shopping around’ for better job matches, transiting through a spell of unemployment in the process. Notably, unemployment duration has not significantly increased for younger people since 1980 and in fact has decreased for young females, in contrast to the older age groups. Females also tend to have shorter average duration of unemployment than males, again reflecting the fact that they are more likely to leave the labour force altogether, rather than become or remain unemployed.
| Average | Median | |||
|---|---|---|---|---|
| 1980 | 1997 | 1980 | 1997 | |
| Males | ||||
| Total | 32 | 58 | 13 | 24 |
| 15–19 | 21 | 25 | 12 | 12 |
| 20–24 | 28 | 46 | 12 | 23 |
| 25–34 | 31 | 56 | 13 | 25 |
| 35–54 | 46 | 76 | 20 | 34 |
| Females | ||||
| Total | 28 | 46 | 11 | 17 |
| 15–19 | 25 | 22 | 13 | 11 |
| 20–24 | 31 | 39 | 12 | 15 |
| 25–34 | 25 | 44 | 9 | 17 |
| 35–54 | 33 | 63 | 13 | 26 |
| Persons | ||||
| Total | 30 | 53 | 12 | 21 |
| 15–19 | 23 | 24 | 12 | 12 |
| 20–24 | 29 | 43 | 12 | 20 |
| 25–34 | 28 | 51 | 11 | 21 |
| 35–54 | 40 | 70 | 17 | 31 |
2.6 Transition Probabilities
Another way to summarise the various labour market performances of the different labour market groups is to examine movements in their transition probabilities. A transition probability measures the likelihood that a person will move from one labour market category (for example, unemployment) into another (in this case, either not in the labour force, full-time or part-time employment). This takes account of the fact that changes in the unemployment rate reflect net changes in the inflows and outflows to employment and unemployment.
Figure 13 plots the time series of transition probabilities of moving to and from unemployment for males and females.[10] As noted by Fahrer and Heath (1992), the most striking feature of the graph is the decline in the probability of unemployed labour moving to full-time employment. This is particularly the case for males with the probability falling by 10 percentage points since 1980, consistent with the rise in the male full-time unemployment rate. The probabilities declined substantially in the 1982–83 and the early 1990s recessions and have only recovered very slightly during the ensuing years of recovery.
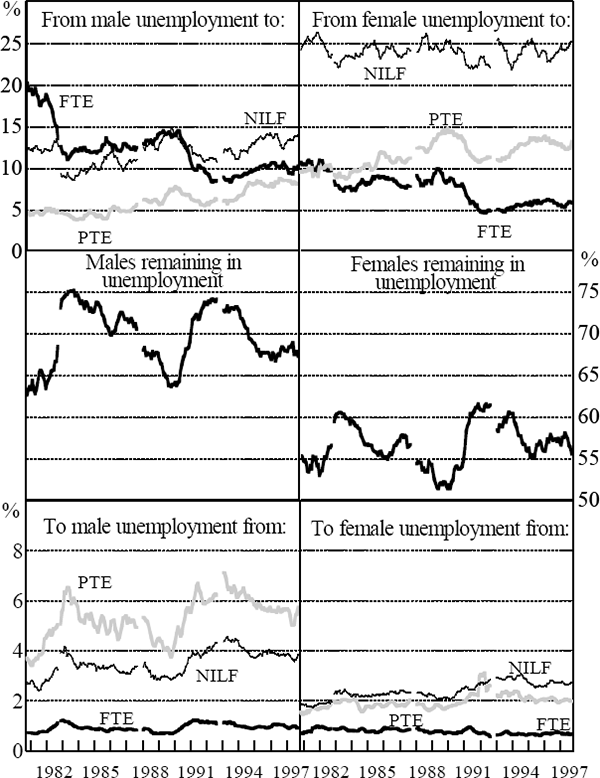
Notes: FTE denotes full-time employment, PTE part-time employment and NILF not in the labour force. The breaks in the series result from changes in the sampling process following censuses.
Despite falling in the 1990s recession, the probability that both men and women will leave unemployment by gaining a part-time job has been on an upward trend since 1980, reflecting the strong growth in demand for part-time workers. The probability that women leave unemployment this way is, however, still higher than that for men.
Women are still nearly twice as likely as men to exit from unemployment by leaving the labour force: about 25 per cent of unemployed women do so each month. These transition probabilities, while cyclical, have had a relatively constant mean. They tend to decline sharply in recessions, recovering only gradually as the upturn progresses. This is likely to reflect the changing composition of the unemployment pool and discouraged worker effects throughout the cycle.
Looking at the flows of people into unemployment, the probability that either a male or female enters unemployment from part-time employment is higher than from full-time employment; however, for males the absolute size of the flows to unemployment are larger for those moving from full-time employment. The probability of men entering unemployment from part-time employment rose strongly in the 1990s recession and as yet has not fallen back to the lower levels of the 1980s. The probability that males enter unemployment directly from outside the labour force ratcheted up in both the 1980s and 1990s recessions. This was also the case for women although the trend is less pronounced.
Other noteworthy labour market developments highlighted by the transition data include:
- There has been a trend increase in the probability that full-time workers move into part-time employment. This has been particularly pronounced for females.
- For males, slow growth in full-time employment has also been evidenced by a decline in the probability of moving from part-time to full-time work. For females there has been an increase in the probability of moving from part-time to full-time work as well as an increase in the probability of moving from full-time to part-time employment.
- There has been a secular decline in the female exit rate from employment (full-time and part-time) to outside the labour force. In contrast there has been a slight rise in the probability of women entering part-time employment from outside the labour force. Although the increase is small (half a percentage point), the implied flows are quite large – around an extra twenty thousand women per month.
- The probability that males will enter full-time employment from outside the labour force has also declined.
In summary the rise in male unemployment and slow growth in male full-time employment has been mirrored by a decline in the probability of men moving into full-time employment from each of the other labour market states. There has also been a small increase in the probability of moving into unemployment from outside the labour force and part-time employment.
For females, the rise in full-time unemployment has again been accompanied by a decline in the probability of gaining full-time employment from unemployment. There is also some evidence of greater churning between full-time and part-time female employment.
Footnotes
Unemployment rates in Figure 1 are calculated as the average unemployment rate for the financial year. Throughout most of the paper, calender year averages are used. See the Data Appendix for further details. [1]
Between 1901 and 1904, the average annual unemployment rate rose from 4 per cent to around 9.5 per cent as a result of a drought-related recession. During the Great Depression, unemployment approached rates of 20 per cent. In both instances, however, within the period of a decade, the unemployment rate had fallen back to around 2 per cent. [2]
The changing composition of the labour force accounts for a decrease in the unemployment rate of around 0.2 percentage points. This decline largely reflects the growing share in the labour force of females who have, or are looking for, part-time work and whose unemployment rate is lower than the aggregate rate. [3]
The series in the graph end in May 1996 due to a reclassification of job categories. [4]
This concept is at the centre of the debate on wage inequality in the United States. There is a rapidly expanding literature that relies on skill-biased technological change as the residual explanation for the widening in inequality. See for example, Lawrence and Slaughter (1993), or Berman, Bound and Griliches (1994). [5]
See in particular Katz and Murphy (1992). [6]
There is a structural break in the series in 1989 when the ABS moved to a new survey which narrowed the scope from 15 to 69 year olds to 15 to 64 year olds. The data prior to 1989 has been spliced onto the later series. [7]
This comparison is affected somewhat by a change in the ABS definition of skilled and unskilled. In 1993, approximately half a million people were reclassified from skilled to unskilled. [8]
Data is not readily available over a longer time period. [9]
The transition probabilities are centred five-month moving averages. [10]